

[Real-time Revenue Disclosure for October] +1,390,000 yen! What became clear about the "importance of signals" through extensive scalping tests?
Here, as the developer of Maasan Trend Arrow, I will introduce what kind of trading and validation I usually perform, using actual revenue calendars and charts.
Normally, I focus on trading that utilizes signals, but that is not all there is to it.
While also doing scalping without signals, I am daily validating the effectiveness and improvements of the signals.
Why do I continue this validation so much?
Because I want to evolve Maasan Trend Arrow into an even more user-friendly indicator.
■ First, I’m publishing a real revenue calendar for October 2026!
Please take a look here first.
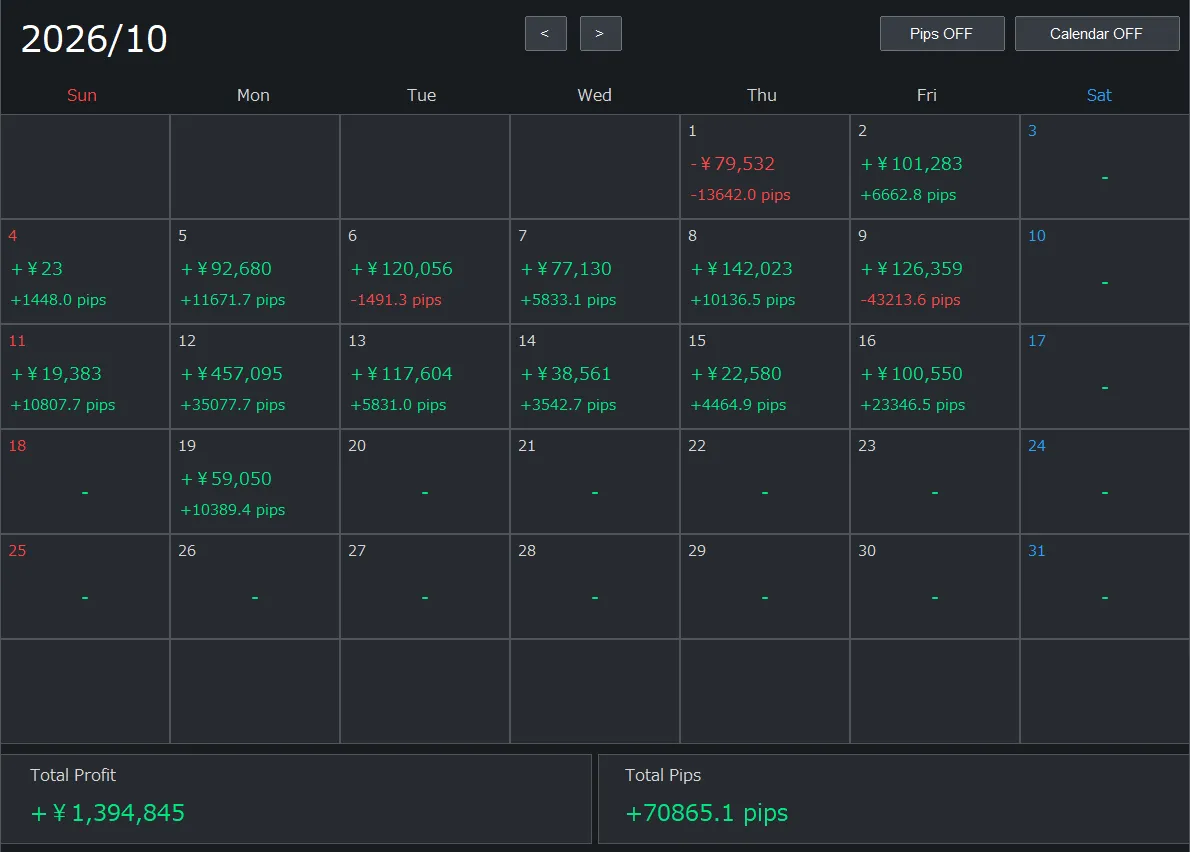
This is the revenue calendar as of October 19.
Cumulative income: +1,394,845 yen
Cumulative pips earned: +70,865.1 pips
This is the revenue calendar for the account I actually trade on.
Of course, not every day was profitable.
October 1st was -79,532 yen. This day is for the sometimes-practiced signalless scalping validation
I am publishing it as-is, including the negative days.
I believe it is important not to show only profitable days, but to disclose losses that occurred during the validation as well.
*The publication date is as of October 19. Profits and losses vary greatly depending on traded quantity and risk, so it cannot be reproduced to yield the same results.
■ Why scalp without using signals?
During the month, I deliberately do not use Maasan Trend Arrow’s signals as entry conditions and set aside time for scalp trading.
The reason is simple.
“What differences would actual decisions show with and without signals?”
I am checking this myself.
Also, I check not only when signals occur, but also when they don’t occur.
In places where signals occur, what kind of price movement happened
What happens when entering in places where there is no signal
What kind of market conditions make signals work well
Conversely, in which situations should we refrain from acting
Is there anything that can be improved in the next update
I am confirming these things in actual markets.
■ Verifying massive scalping on 1-minute and 5-minute charts
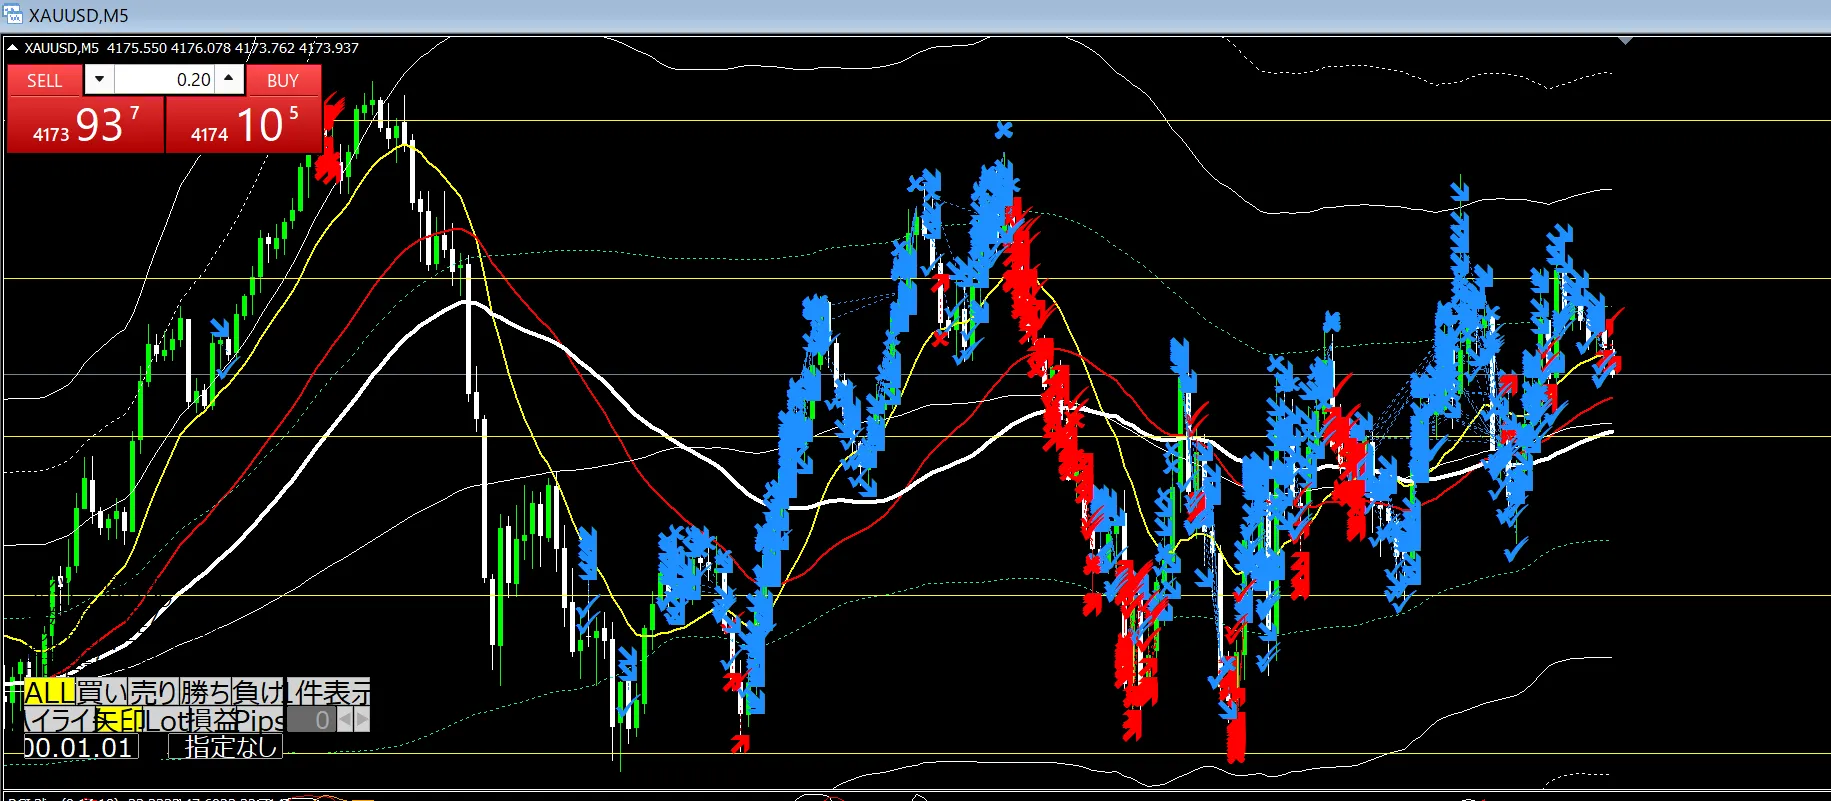
Please look at this image.
You can see many blue and red arrows displayed on the chart.
These are records of the many scalps I conducted focusing on 1-minute and 5-minute charts.
While repeating actual buy-sell trades,
“How different is it between places with signals and without signals?”
I confirmed this.
And in this validation, I personally felt something strongly.
Choosing places with signals clearly makes it easier to structure trades.
In the trades I checked this time,there was a tendency for higher win rates when signal conditions were met than when trading without signals.
Of course, this is just my own validation result and does not mean the same outcome will occur in all markets.
Also, to publish an exact win rate as a numerical figure, you would need totals by number of trades and by conditions.
Still, this validation was a very significant achievement for me.
■ Why I continue daily validation
Maasan Trend Arrow isn’t meant to be a finished one-and-done indicator.
Markets change daily.
There are days with strong trends and days where the direction is unclear and prices swing up and down many times.
In such market conditions,
“Which conditions were effective?”
“Which signals should be avoided?”
I think it’s important to confirm this.
The large amount of scalp validation I do daily is not merely trading practice.
It is also a task to gather materials needed for the next update.
There are improvements I notice only because I use it in actual trading.
Going forward, I will continue validating to make Maasan Trend Arrow easier to use.
■ Introducing recent practical trades
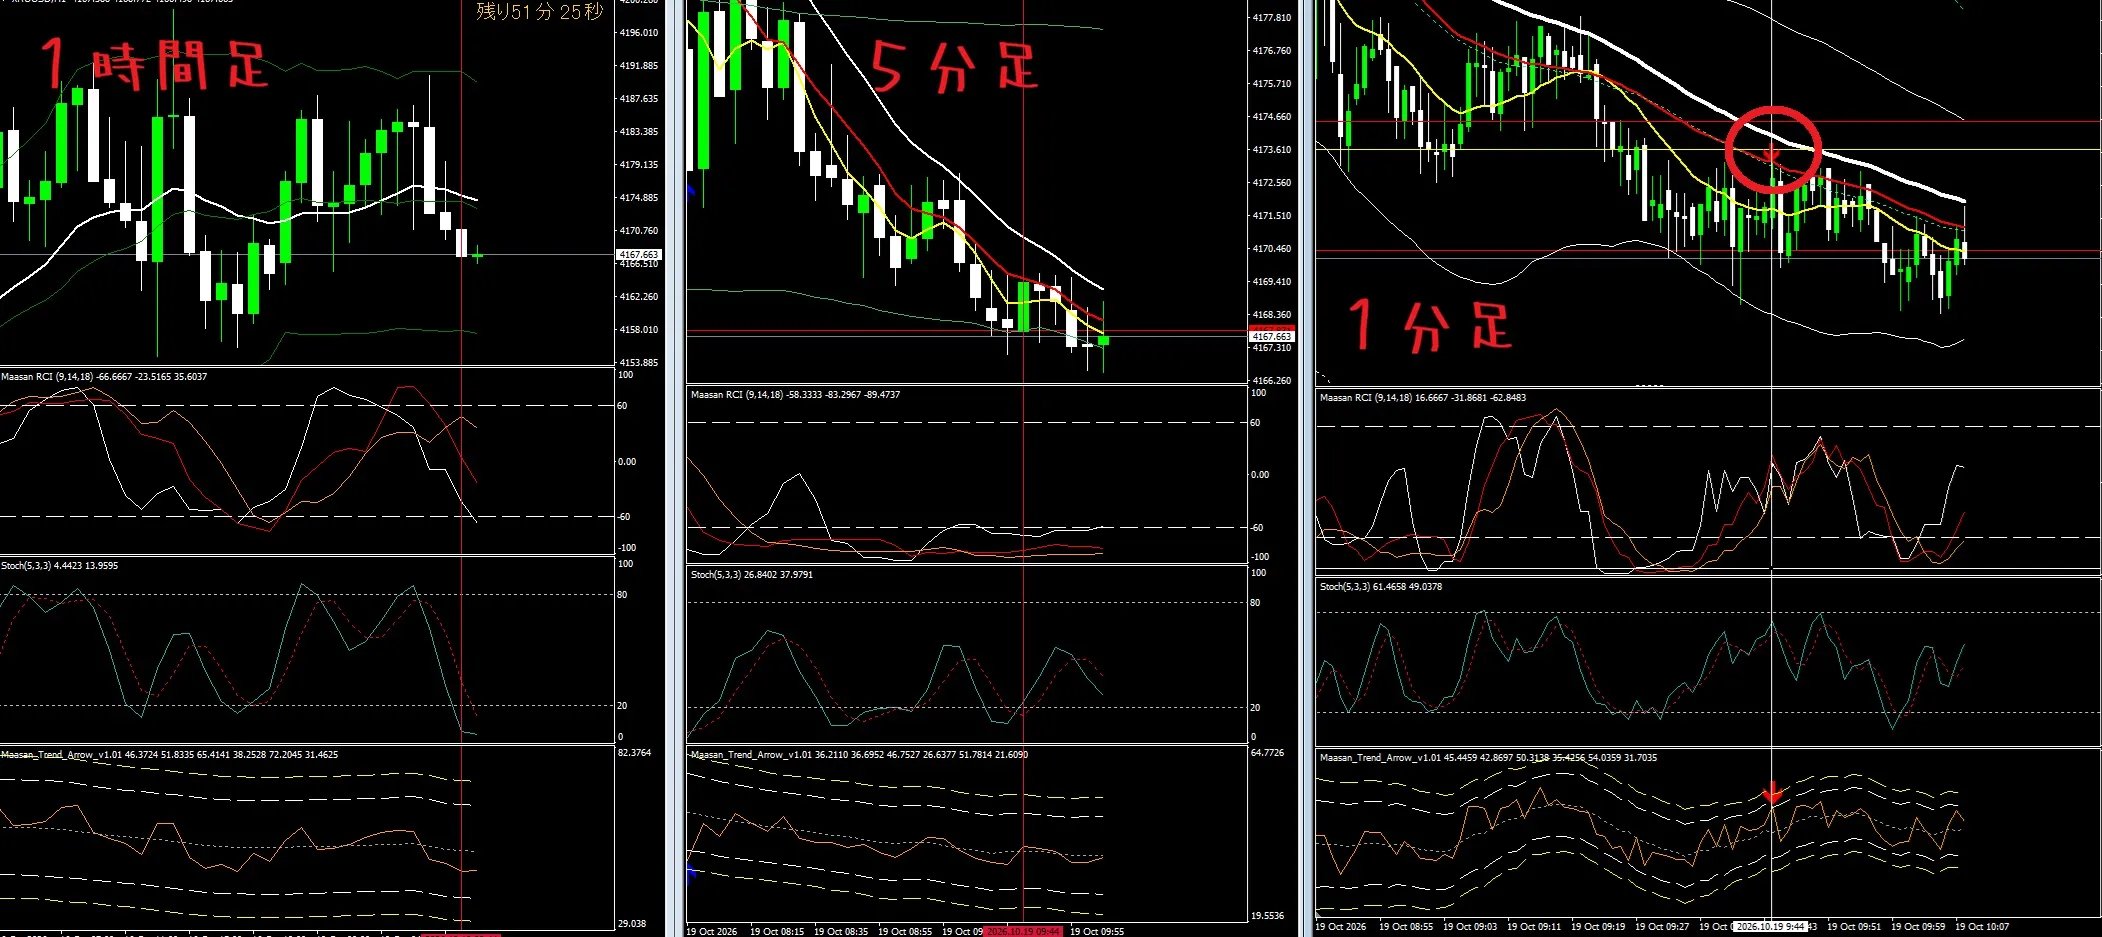
Finally, I will introduce recent trades.
This time as well, I emphasize what I normally value,trades that combine the 1-hour, 5-minute, and 1-minute charts.
① First, confirm the major direction on the 1-hour chart
Please look at the left side of the image.
On the 1-hour chart, the market environment is oriented toward a downward trend.
The first thing I check is the direction on such a higher time frame.
② Next, check the 5-minute chart
In the central 5-minute chart, the moving averages are in a descending order, i.e., a perfect order.
In other words, on both the 1-hour and 5-minute charts, you can be mindful of a selling direction.
After confirming this, I move to the 1-minute chart.
③ Finally, look for entry candidates on the 1-minute chart
Please look at the 1-minute chart on the right side.
The area circled with a red circle is the point I focused on this time.
In this situation, after confirming the direction on the higher timeframe, Maasan Trend Arrow on the 1-minute chart lit up with a signal.
I consider short-term scalping in such situations.
Confirm the direction on the 1-hour chart
Confirm the downtrend and the perfect order on the 5-minute chart
Check the signal and other conditions on the 1-minute chart
Decide to enter at the point where the conditions align
■ Actually, I also pay attention to uncertain signals before they confirm
This is a part I want you to know when using Maasan Trend Arrow.
Maasan Trend Arrow reacts to real-time price movement even before the candlestick closes.
Therefore, even if a signal lights up the moment conditions are met, if subsequent price movement takes it out of the criteria, the signal may disappear.
Unconfirmed candles may cause signals to light up or disappear.
And in my actual trading,I sometimes enter based on signals that briefly lit up before confirmation.
However, what is important here is
“Not entering everything as soon as a signal lights up, even for a brief moment.”
I reference pre-confirmation signals whenother important conditions are also met.
If those conditions are not met, I may refrain from entering even if a signal lights up.
Why consider entering even before confirmation?
Which signals should be avoided?
Where should I take profits?
Because these are crucial parts of my trading method,I share the detailed criteria with purchasers only.
■ Maasan Trend Arrow isn’t just “buy/sell when a signal appears”
Through this revenue calendar, the大量 scalping validations, and recent trade images, I want to convey something.
That is,
which signals you choose is more important than the number of signals.
I don’t enter every place where a signal appears.
I judge by combining the direction of the higher-time frame, the perfect order, RCI, Stochastics, and other conditions.
I want to share this “thinking for selective entry” with purchasers as well.
? Maasan Trend Arrow — Now available with first month free!
If you’re curious about Maasan Trend Arrow,
currently,a campaign offering the first month freeis underway.
Regular monthly fee: 4,980 yen (tax included)
First month: 0 yen
For the first 30 days you can use it for free, so you can try it in MT4 and see what signals appear in actual market conditions.
For purchasers, we share not only how to use the indicator but also the judgment methods I value in real trading and how to select signals.
“I want to try it before buying.”
“I want to see how signals appear in real markets.”
“I want to learn practical usage beyond just the signals.”
If so, please take this opportunity to try it.
Maasan Trend Arrow product page
https://www.gogojungle.co.jp/tools/indicators/86291
※The first month free is a special benefit of the first month’s automatic recurring charge. After the free period ends, the usual monthly fee applies, so please check the continuation and cancellation methods before purchase.
※The displayed revenue is past performance and does not guarantee future profits or win rates. FX/CFD trading involves risk of losses exceeding the initial investment.
In conclusion
I will continue to validate and improve Maasan Trend Arrow through actual trading.
The developer himself uses, validates, and improves it.
That is the philosophy I value most.
I hope Maasan Trend Arrow can help make your trading decisions a little simpler.