
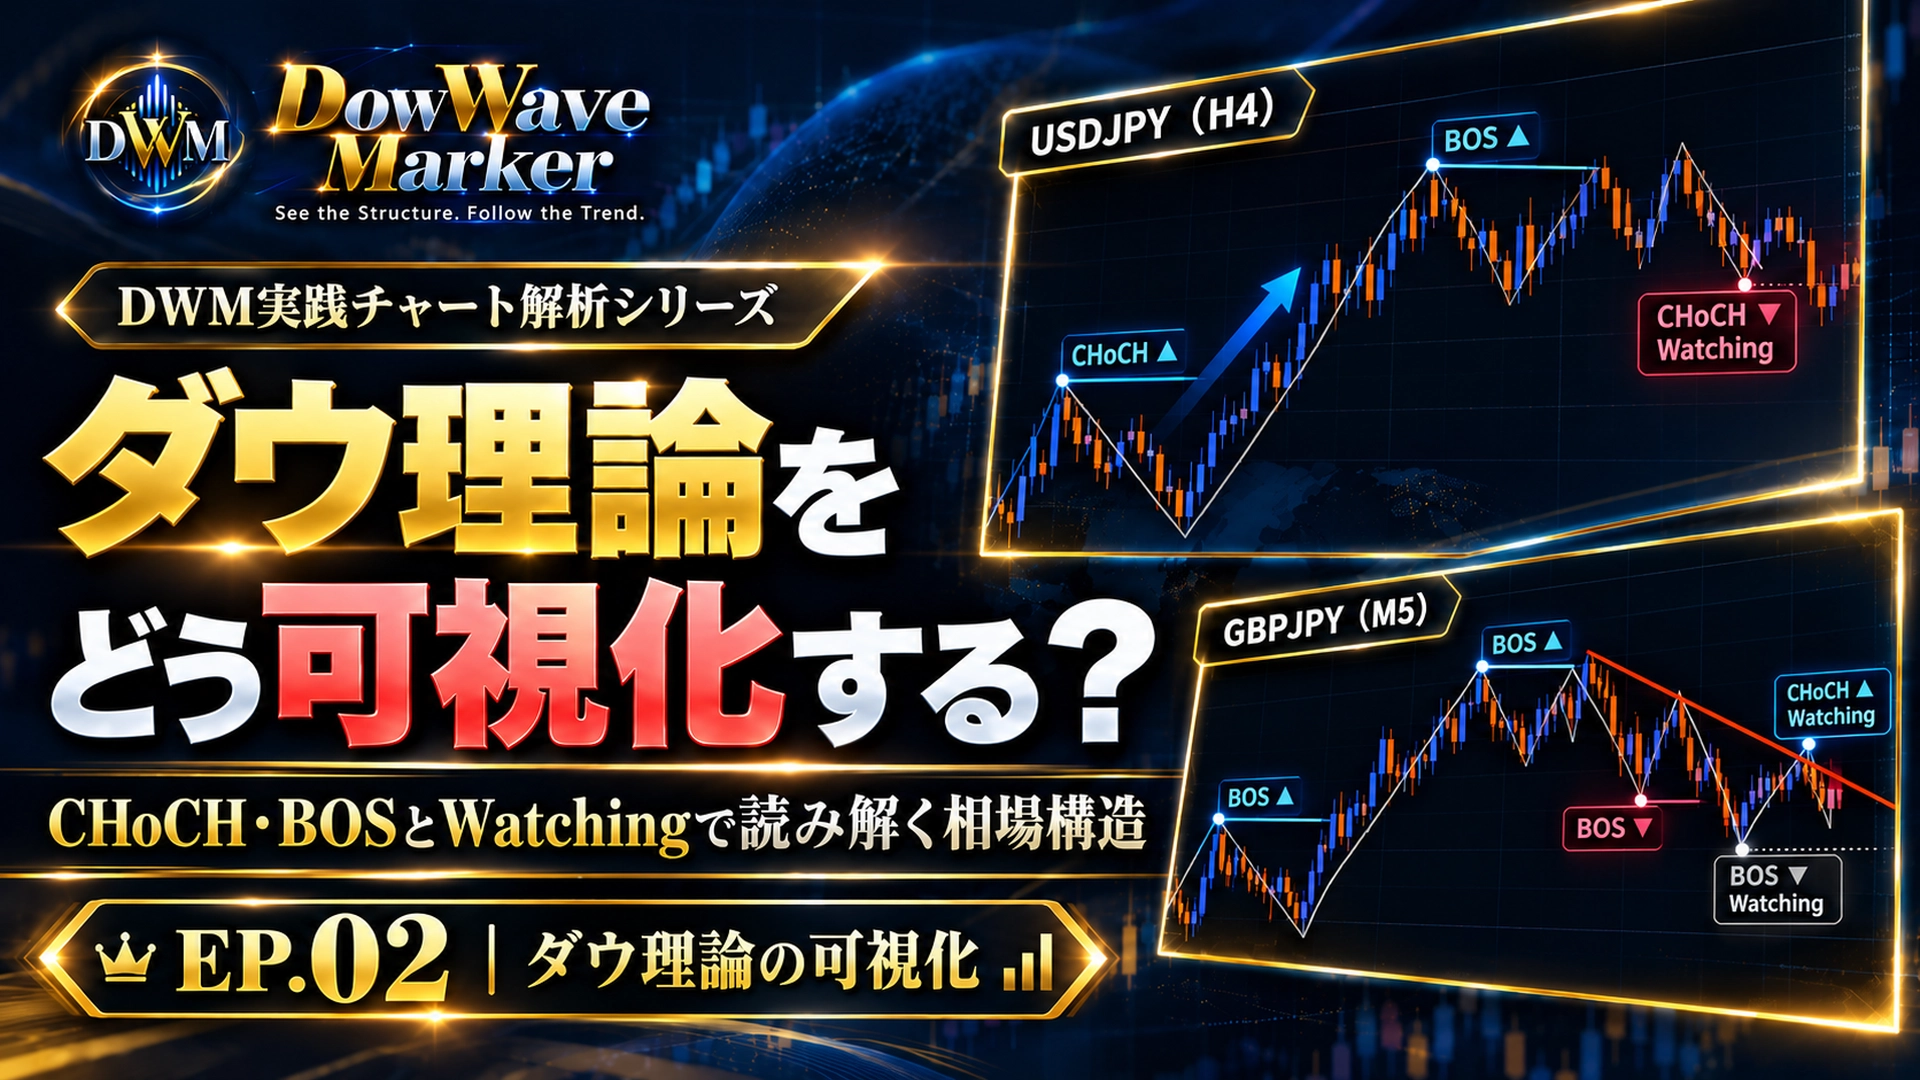
How to visualize Dow Theory? Interpreting market structure with CHoCH, BOS, and Watching — Practical Chart Analysis in DWM EP.02
DOWWAVE MARKER | DWM Practical Chart Analysis Series EP.02
How to visualize Dow Theory?
Reading market structure with CHoCH, BOS, and Watching
Compare charts with only candlesticks and DWM display to read Dow wave changes, continuations, and levels under surveillance from real examples.
Even if you display many indicators on the chart,“which direction of the Dow wave is currently forming”being ambiguous makes environmental recognition difficult.
The basic of Dow Theory is to grasp market structure from the sequence of highs and lows.
However, in real markets small up-and-down movements pile up, and you may wonder where to view as a single wave.
This timeDowWave Marker (DWM)in its coreCHoCH・BOS・Watchingcentered, using 4-hour USDJPY and 5-minute GBPJPYto confirm“how the Dow wave will look”
What to focus on is not the number of buy/sell signals, but three questions: “Has the structure changed?”, “Has it been updated?”, and “Which level are we watching next?”
DWM Practical Chart Analysis Series|EP.02
Video verified: Visualization of Dow Waves and Watching
This article explains on-chart the relationships of CHoCH▲→BOS▲ and the positions of BOS and Watching in short-Term time frames.

Based on the video commentary, the following section organizes the key points for each chart as an article.
01 / MARKET STRUCTURE
From “tracking with the eyes” to seeing as a structure
In an uptrend, higher highs and higher lows are the basis for judgment, and in a downtrend, lower highs and lower lows are the basis.
However, actual candlesticks form many small waves, so depending on the viewing range, readings can vary.
First, view USDJPY/H4 with candlesticks only, without adding the Dow wave display.
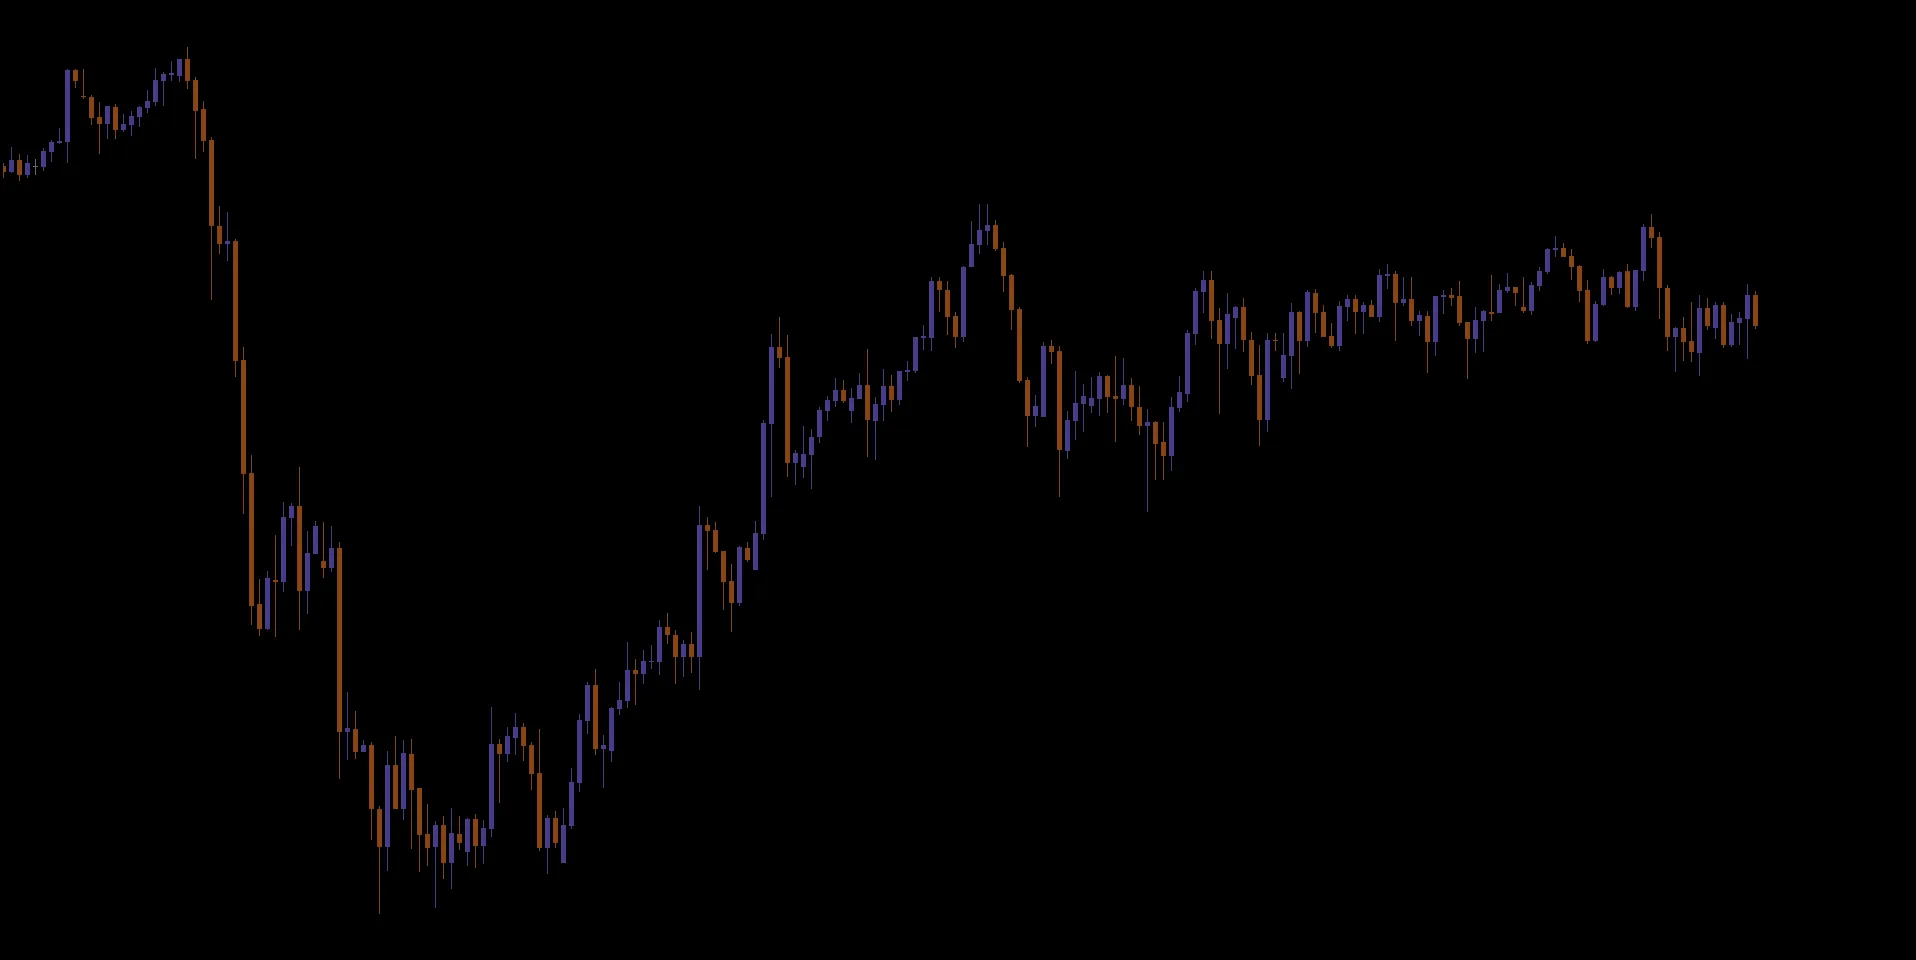
Along the rightward price movement there is a large decline followed by a rebound.
From here, it is not easy to manually organize which highs and lows to treat as structural turning points each time.
Add DWM’s structure display to the same chart
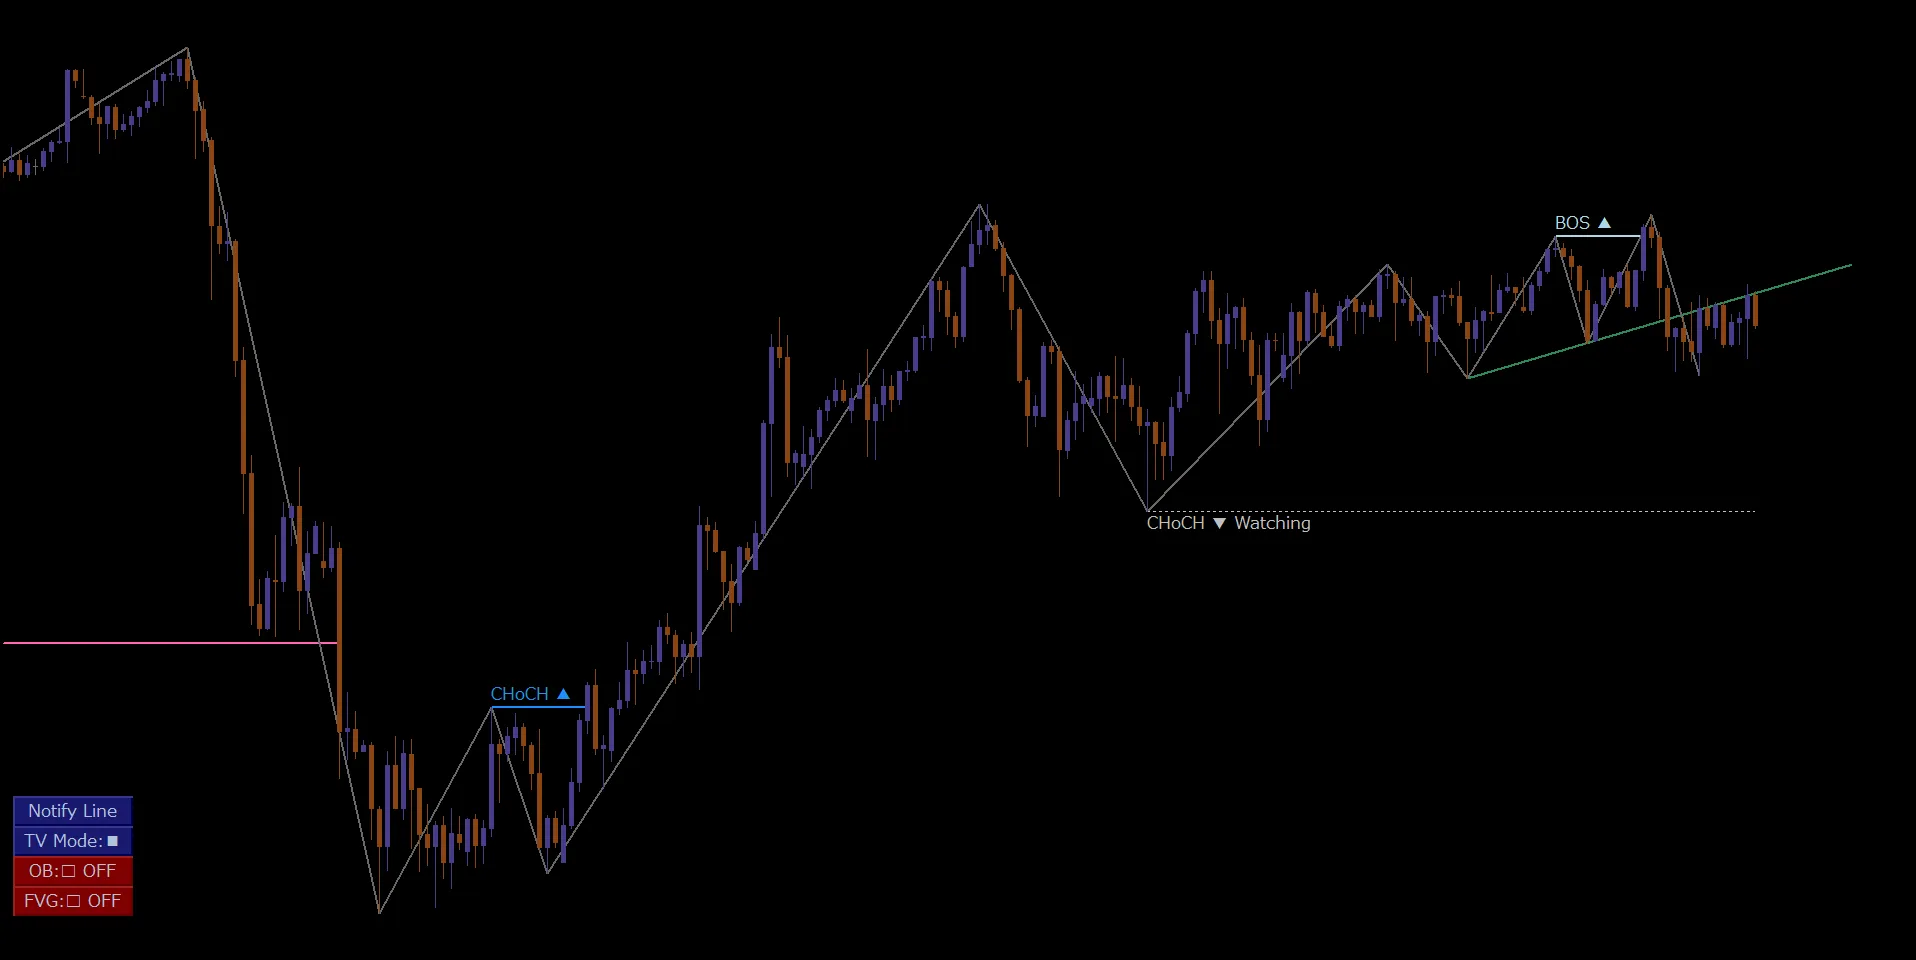
DWMallows you to confirm Dow waves along with CHoCH, BOS, and Watching.Even though the candlesticks are the same, the information about market structure is organizedas a key point of comparison.
DWMdoes not predict future price movement from candlesticks; it visualizes waves and structural turning points based on certain判定 conditions.
02 / CHoCH & BOS
USDJPY/H4: From CHoCH▲ to BOS▲
CHoCH▲ as a material to capture structural change
In this USDJPY/H4, you can see a phase where the price moved downward and CHoCH▲ appeared.
This is information to pay attention to when considering changes in a direction different from prior structure.
However, at the moment CHoCH▲ appears,“an uptrend is confirmed”or “it will surely rise from here” is not determined.
It is only a material for reading Dow structure.
Then BOS▲ confirms an update in the upward direction
On the chart, BOS▲ is displayed following CHoCH▲.
Seeing CHoCH and BOS in a sequence allows you todistinguish structural change from subsequent updatesin the structure.
CHoCH=a material indicating that a change in structure has occurred. BOS=a material indicating an update in structure. Neither alone guarantees future direction or entry success.
03 / WATCHING
Watching is information about “monitoring” rather than “confirmed”
Along with confirmed CHoCH and BOS displays,DWMfeatures Watching as a characteristic.
Watching is the chart indication of the next CHoCH/BOS to monitor, reading differently from confirmed displays.
On the right side of USDJPY/H4, CHoCH▼ Watching can be seen.
Even though this level is being watched, it does not mean a downward structural change is immediately confirmed.
| Display | How to read in article |
|---|---|
| CHoCH (confirmed) | Display where a structural change has been confirmed by DWM judgment |
| BOS (confirmed) | Display where a structural update has been confirmed by DWM judgment |
| Watching | Information currently being watched regarding CHoCH/BOS. Not a confirmed display |
Note, the charts in this article are static images captured at a certain point in time.
Watching appearing and then moving to a subsequent display are not presented as a chronological progression here.
04 / CASE STUDY
GBPJPY/M5: Can we declare a trend change with BOS▼ alone?
Next is a 5-minute example. In the short term, price moves back and forth frequently, so it’s important not to confuse confirmed displays with overall trend judgments.
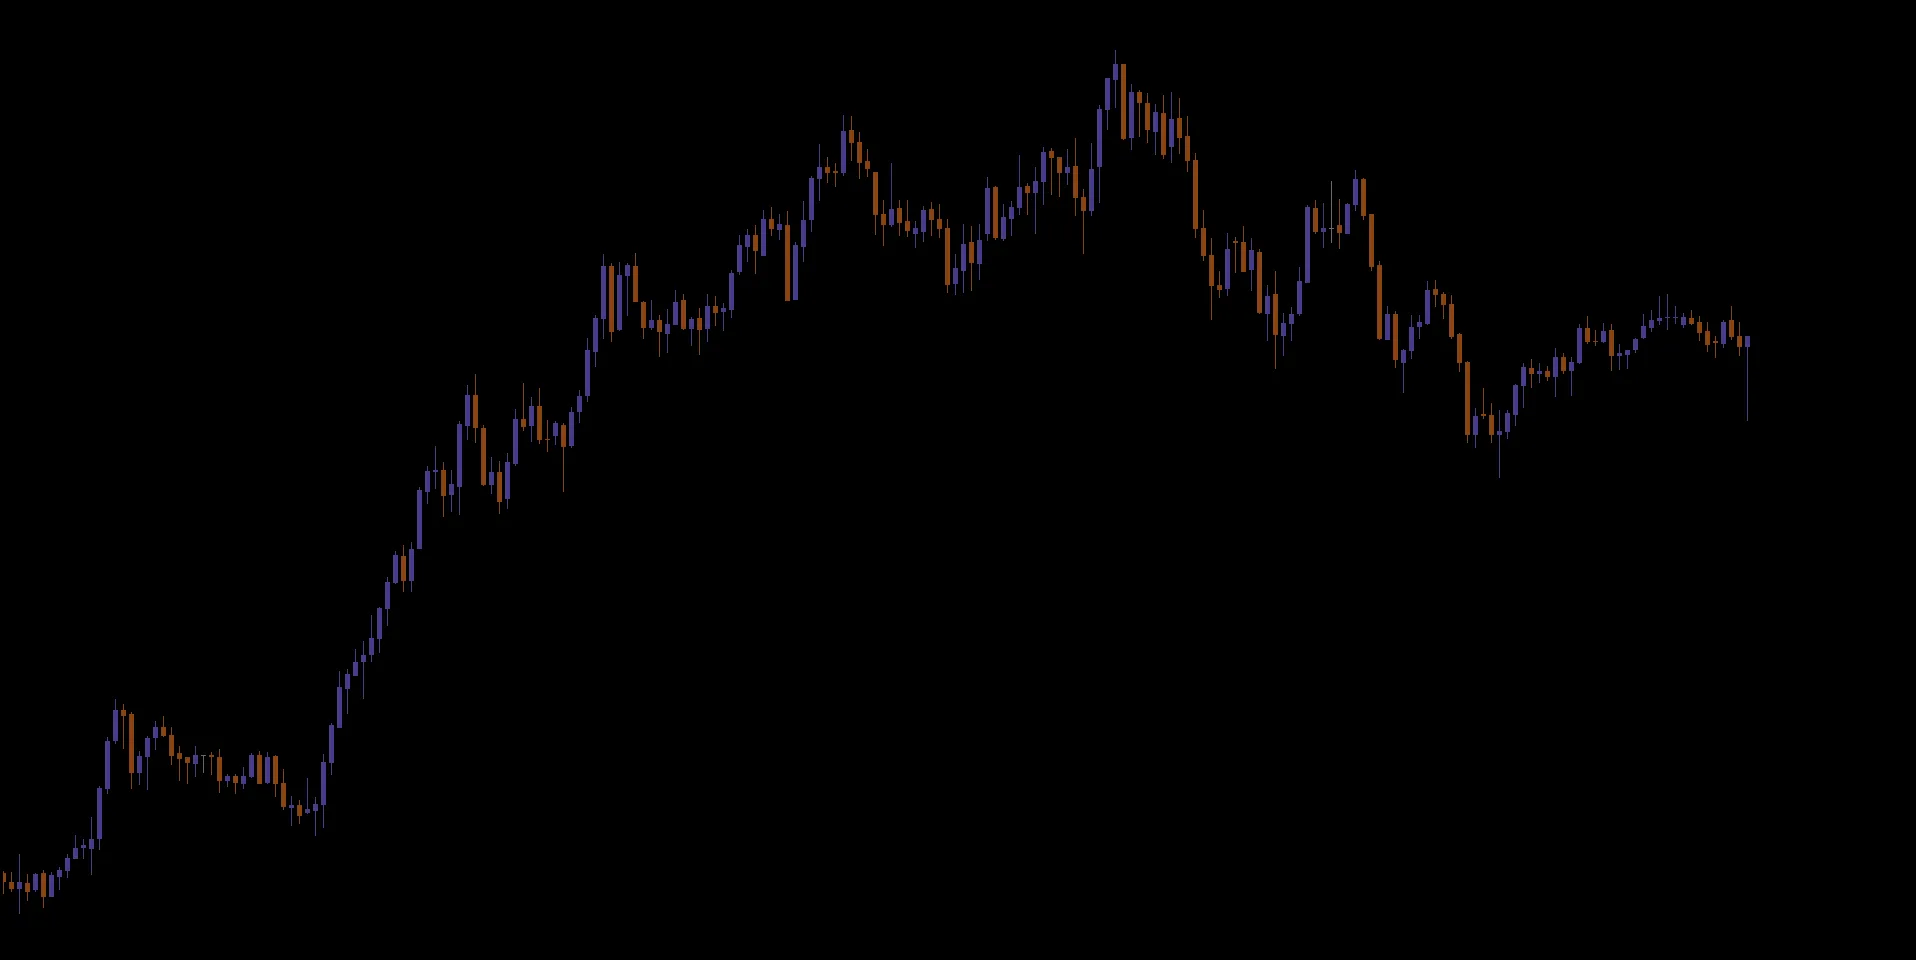
Candlesticks alone show that after an up move, highs are formed and then the price turns to move down.
However, looking only at that movement, you cannotdefinitely say a downtrend is confirmed.
BOS▲・BOS▼ and two Watching states
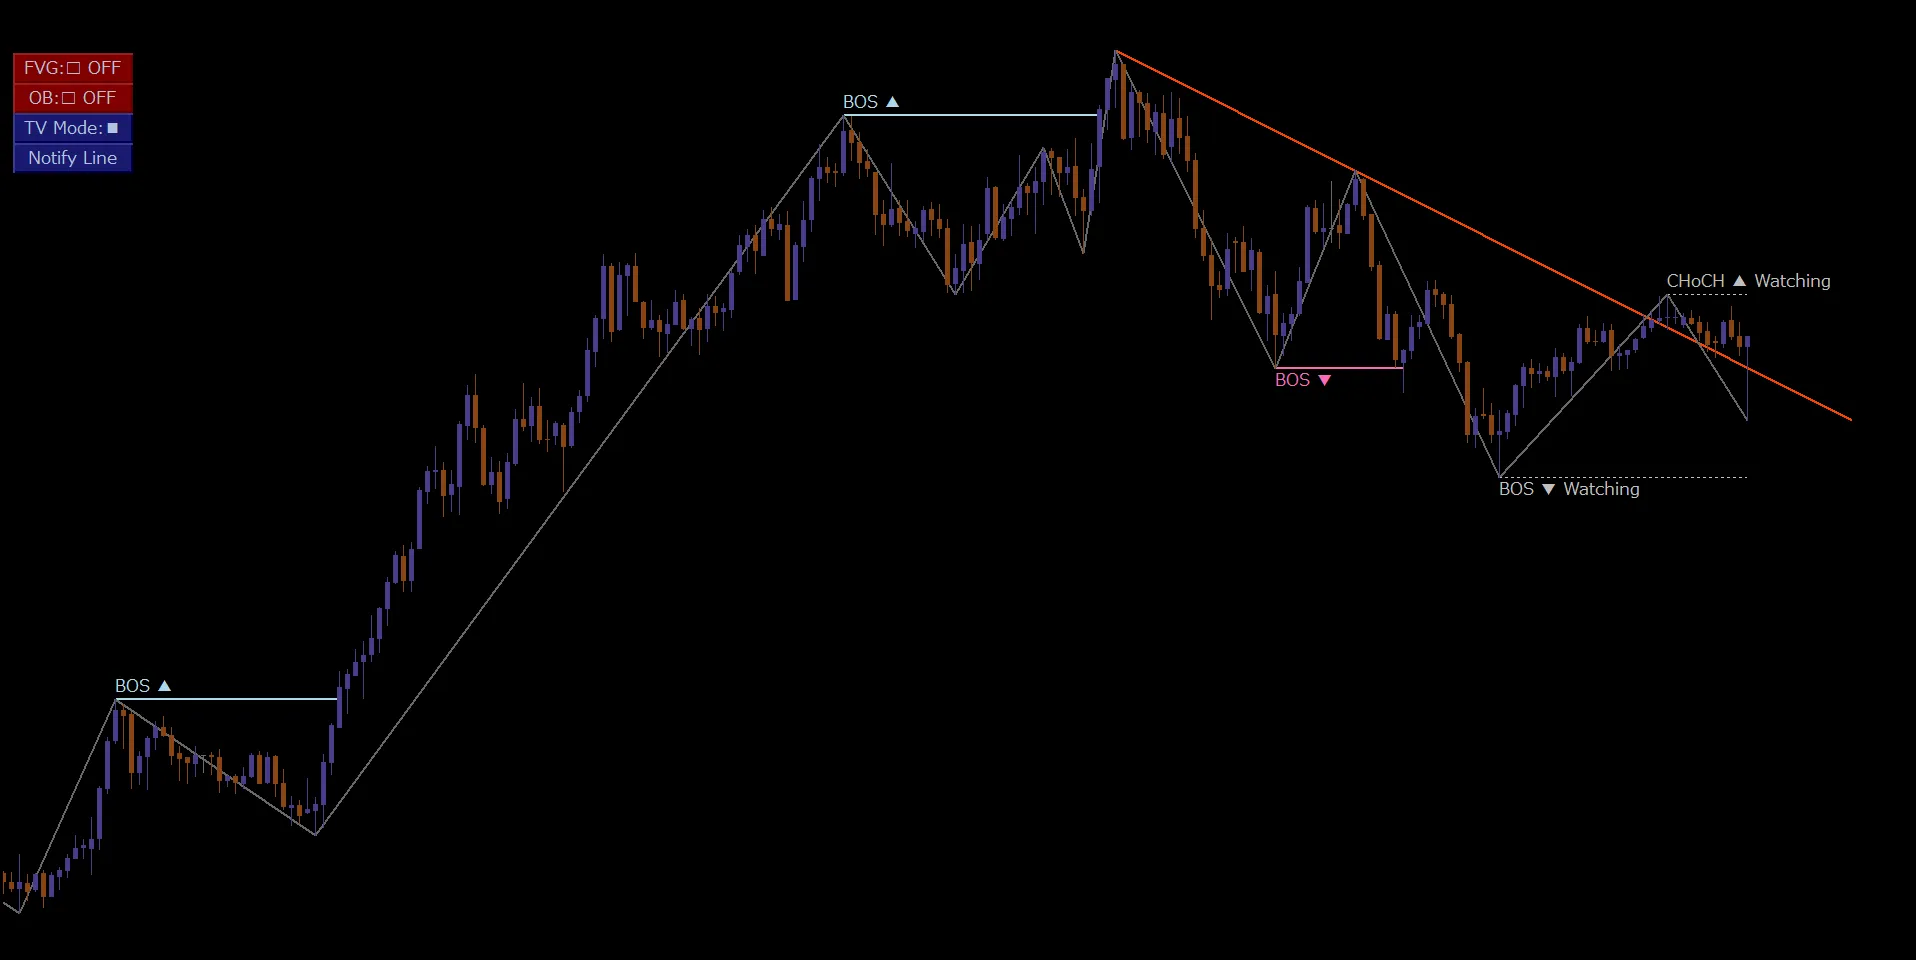
DWMdisplays BOS▲ and BOS▼ as confirmed, along with CHoCH▲ Watching and BOS▼ Watching.
Even with watching targets displayed, it does not mean a confirmed turn or continuation in that direction.
Cases where BOS appears without CHoCH
DWMCHoCH/BOS judgment logic includescases where BOS appears without a confirmed CHoCH.
GBPJPY/M5 chart is an actual display example of this.
Therefore, as a general rule,“CHoCH appears before BOS”is not the only prerequisite for accurate reading of the structure shown by DWM.
It is necessary to distinguish the displayed wave structure from the information that has been confirmed at that time.
Even if BOS▼ is confirmed on GBPJPY/M5, that alone does not prove an upward trend has turned into a downtrend. What matters is the overall structure of highs and lows, not a single label.
05 / PRACTICAL VIEW
How to use CHoCH, BOS, and Watching
From the two charts, the actual environment recognition can be organized as follows:
DWMis not something that automatically gives a buy/sell conclusion.
Use it as a tool to visually organize structure and reduce the number of confirmations required for discretionary judgment.
06 / EXPANDED VIEW
Center Dow Theory and layer additional analysis information
This video focused on CHoCH, BOS, and Watching, butDWMis not the end of the tool.
Moving averages (MA), Fair Value Gap (FVG), Order Block (OB), and other displays can be combined to consider environment recognition and key price ranges.
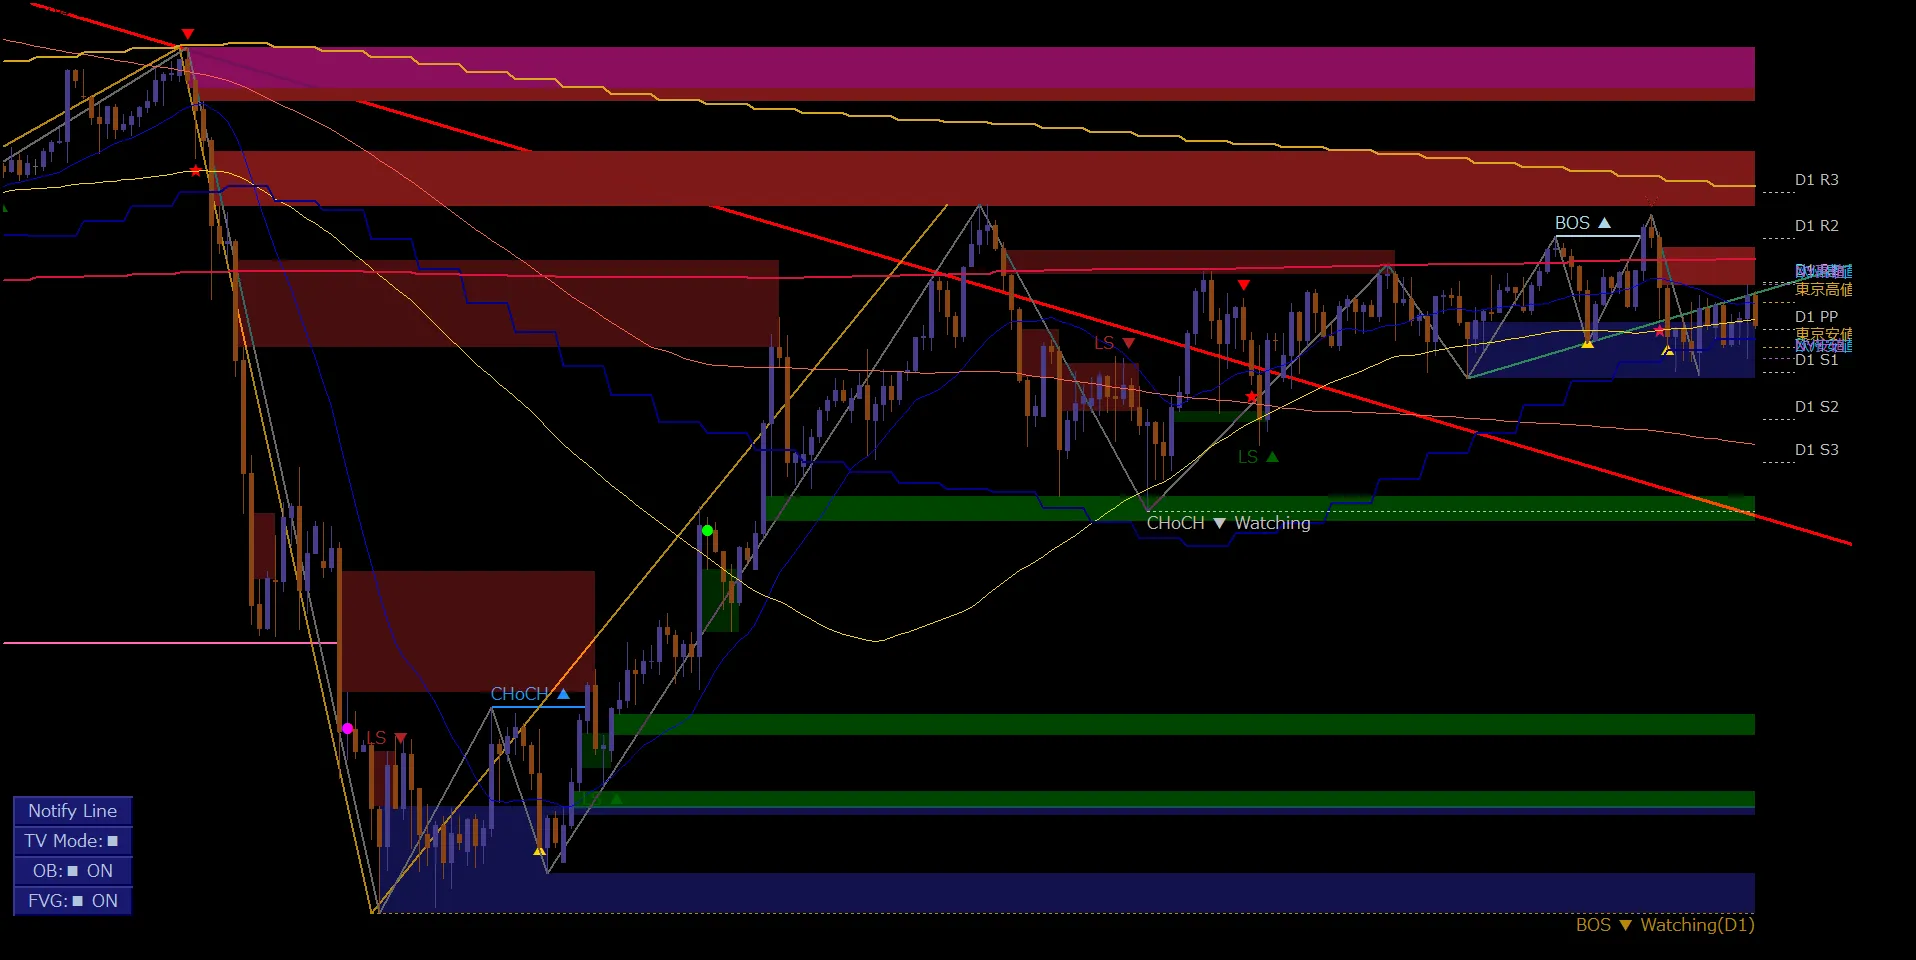
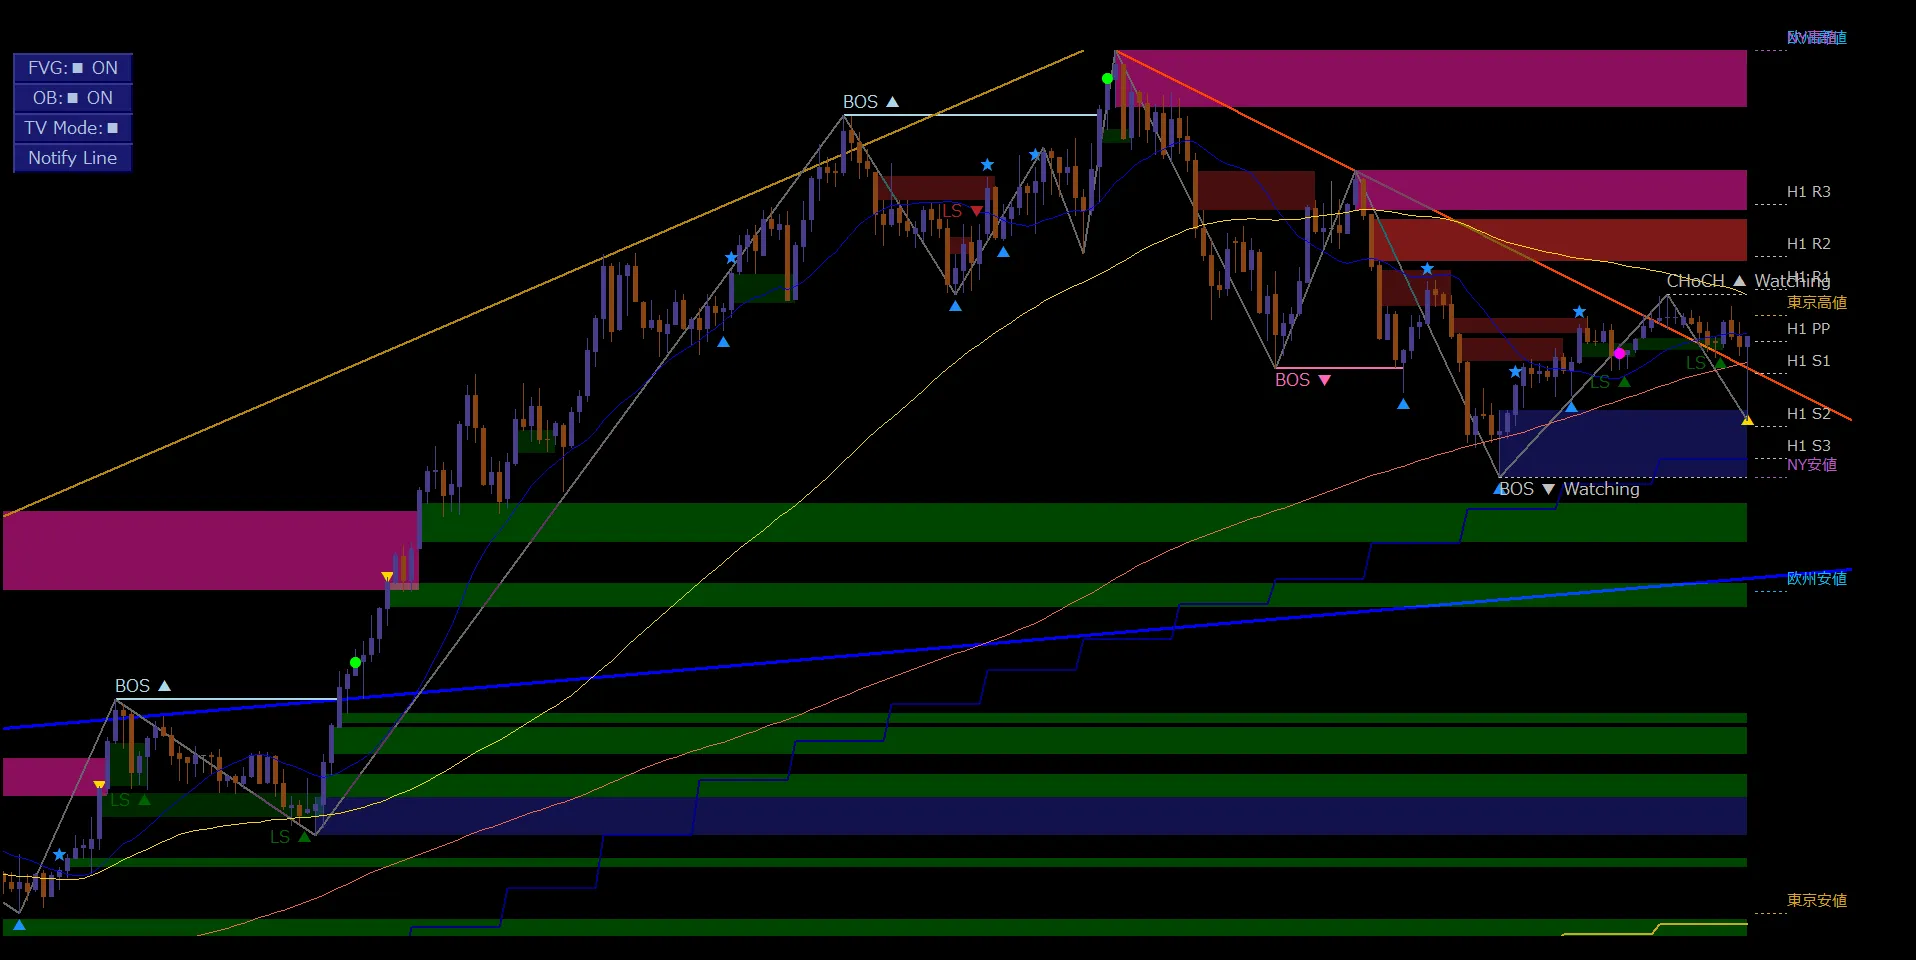
Even on the same chart, you can keep it simple to focus only on Dow waves, or add necessary displays to examine surrounding moving averages (MA) and target zones.
What matters is not showing all features, butselecting the information necessary for the current analysis objective.
Practical uses of SMC-related features will be covered in future series.
07 / FREE TRIAL
14-day free trial to display on your own charts
Wonder how CHoCH, BOS, and Watching shown in this article would appear on the markets and timeframes you usually monitor? It is recommended to verify on actual charts.
MT4 / MT5 compatible and all features of the SMC integrated model on DowWave Marker 14-day free trial
View the free trial on GogoJungleNo feature restrictions / No automatic charges after the trial ends
If you continue after the trial, you can choose the Standard version focusing on CHoCH/BOS or the SMC integrated model that also offers FVG, Order Block, and CRT, according to your needs.
08 / SUMMARY
Summary: Read the structure changes, updates, and monitoring separately
In USDJPY/H4, the flow from CHoCH▲ to BOS▲ was observed, and in GBPJPY/M5, confirmed BOS and Watching coexist.
The key point this time is not to treat CHoCH and BOS as mechanical buy/sell signals, but to read the Dow wave structure.
Furthermore, distinguish Watching from confirmed displays and identify the next level being watched.
See the Structure. Follow the Trend. — Read market structure, wait for pullbacks, and capture the resumption of the trend.