
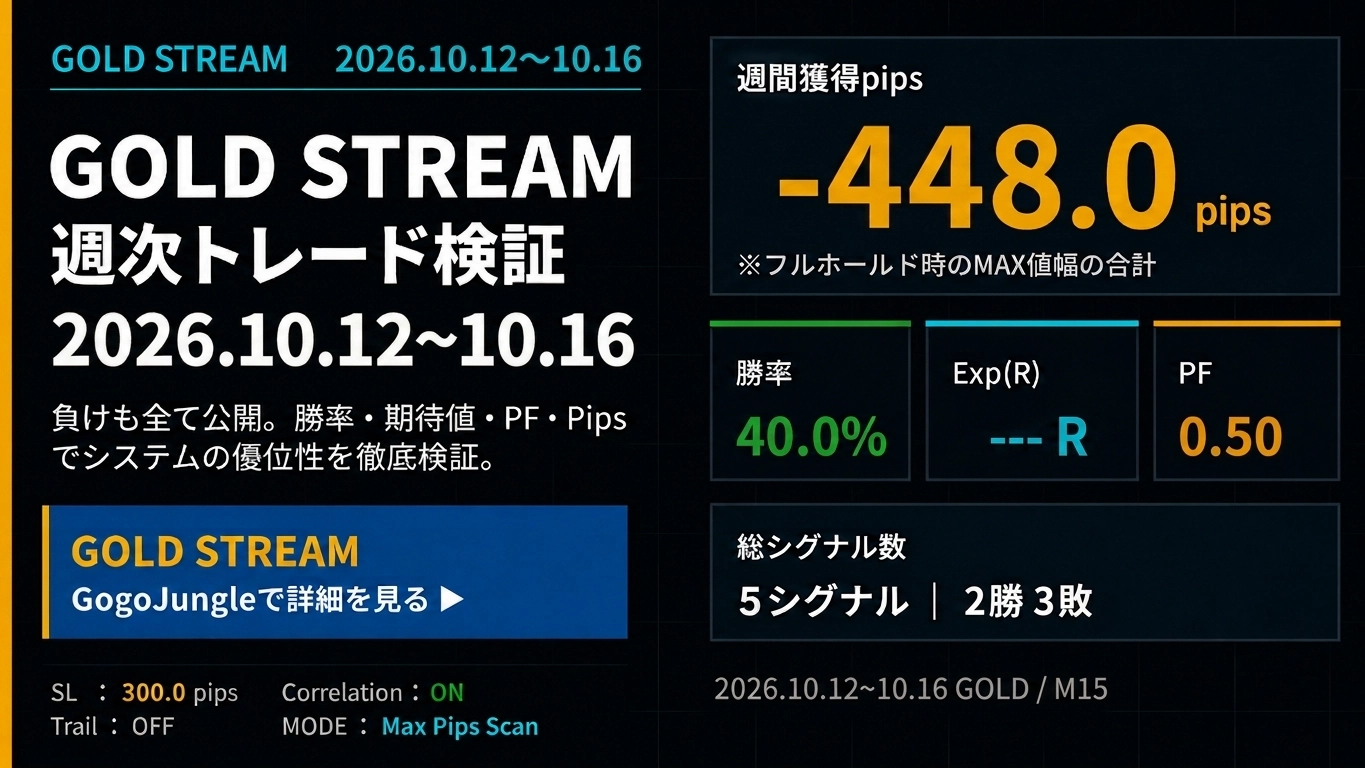
-448pips【Weekly Trade Review & Distribution History】GOLD Day Trader Specialization "GOLD STREAMv2" 2026.10.12~10.16
-448pips【Weekly Trade Verification & Broadcast History】
GOLD Day Trading Focused “GOLD STREAM v2” 2026.10.12–10.16
Check GOLD's price movement, strength, and correlations, and verify signal accuracy, price range, and expected value weekly. Not only win rate, but also compare PF, Exp(R), and 5-day ADR to evaluate this trading environment.
① GOLD Market Analysis
1. Price Volatility
The GOLD (XAU/USD) market for the week of October 12–16, 2026 showed a rapid decline near the highs in the early part of the week, but from midweek recovered quickly, resulting in a volatile back-and-forth market where a clear directional trend did not sustain.
- Early-week decline wave:Momentum to sell intensified due to resistance near the highs, temporarily probing lower prices significantly.
- Midweek V-shaped rebound:After reaching near the lower support line, strong short-covering inflows caused a sharp rebound, pushing prices back up to the previous high.
- Weekend range movement:After the initial rally, buying and selling in the high price zone became balanced, ending the week with volatile, directionless price action.
5-day ADR was735pipsrecorded, making it a highly challenging environment for short-term traders, easily prone to rapid reversals after entry.
2. Supply/Demand & Investment Factors
From macro financial conditions and physical supply-demand, U.S. inflation vigilance, interest rate expectations, and safe-haven demand were balancing against each other.
- U.S. long-term yields and the dollar index:Short-term moves in rates and the dollar, driven by U.S. economic data, directly affected gold price formation.
- Central banks & physical demand durability:Physical demand (jewelry, etc.) was restrained due to high price vigilance, but central bank gold holdings increases provided solid support at the lower end.
- Geopolitical risk and safe-haven buying:Hedge demand tied to geopolitical risks intensified at pullbacks, supporting V-shaped recoveries from sharp declines.
Strengths and weaknesses shifted on a second-by-second basis, making short-term directional forecasting difficult.
3. Investment Trend
In terms of investor capital flows, there was a notable frequency of positions being flipped in the short term.
- Futures market positions becoming short-lived:Trend-following capital held for shorter periods, causing profit-taking selling and stop-loss cascades that led to abrupt changes.
- ETF capital inflows/outflows:Medium-to-long-term funds remained stable, but short-term ETF flows surged and ebbed with price changes.
- Day-trading capital cross-currents:With a wide 735pips range in play, breakout chasing and pullback buying mixed, leading to frequent false breakouts at key levels.
For trend followers, capital flow required caution for sudden reversals after signals activated.
4. Overall Evaluation
This week's GOLD market was“a high-volatility, but non-sustaining, choppy market that lacks a clear ongoing trend”.
Despite a 5-day ADR of 735 pips providing ample movement, follow-through after breakouts was short-lived and frequent reversals occurred. Even following technical indicators could lead to sharp reversals, making it a very tough trading environment overall.
⑤ SILVER / COPPER Market
SILVER
SILVER market: silver followed GOLD's extreme volatility with sharp rebounds after declines. Industrial demand remained firm, but dollar moves driven by interest-rate trends created a wide-range up and down for both high and low prices.
COPPER
COPPER market: copper was influenced by global economic indicators and Chinese demand, with back-and-forth battles. Supply constraints supported the downside, while high dollar and unclear demand recovery capped gains, resulting in a range-bound unclear direction.
② GOLD STREAM v2 Weekly Trade Verification
Weekly Verification Results
③ GOLD STREAM v2 Delivery History
Weekly Signal Delivery History

④ Weekly Verification AI Evaluation
This time5-day ADR 735pips offered a wide enough range, yet frequent sudden reversals and traps dominated the environment. We will thoroughly verify and evaluate based on signal results, correlation filter performance, and risk management data.
■ Signal Judgment and Entry Precision
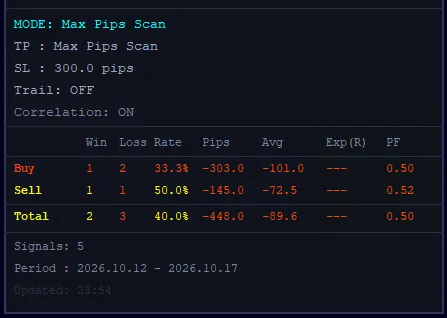
According to the verification panel (2026.10.12 - 2026.10.17), the number of active signals that fired was5 signals, with results2 wins, 3 losses; win rate 40.0% [cite: 28, 29]. Breakdown: Buy signals 1 win 2 losses (33.3%), Sell signals 1 win 1 loss (50.0%).
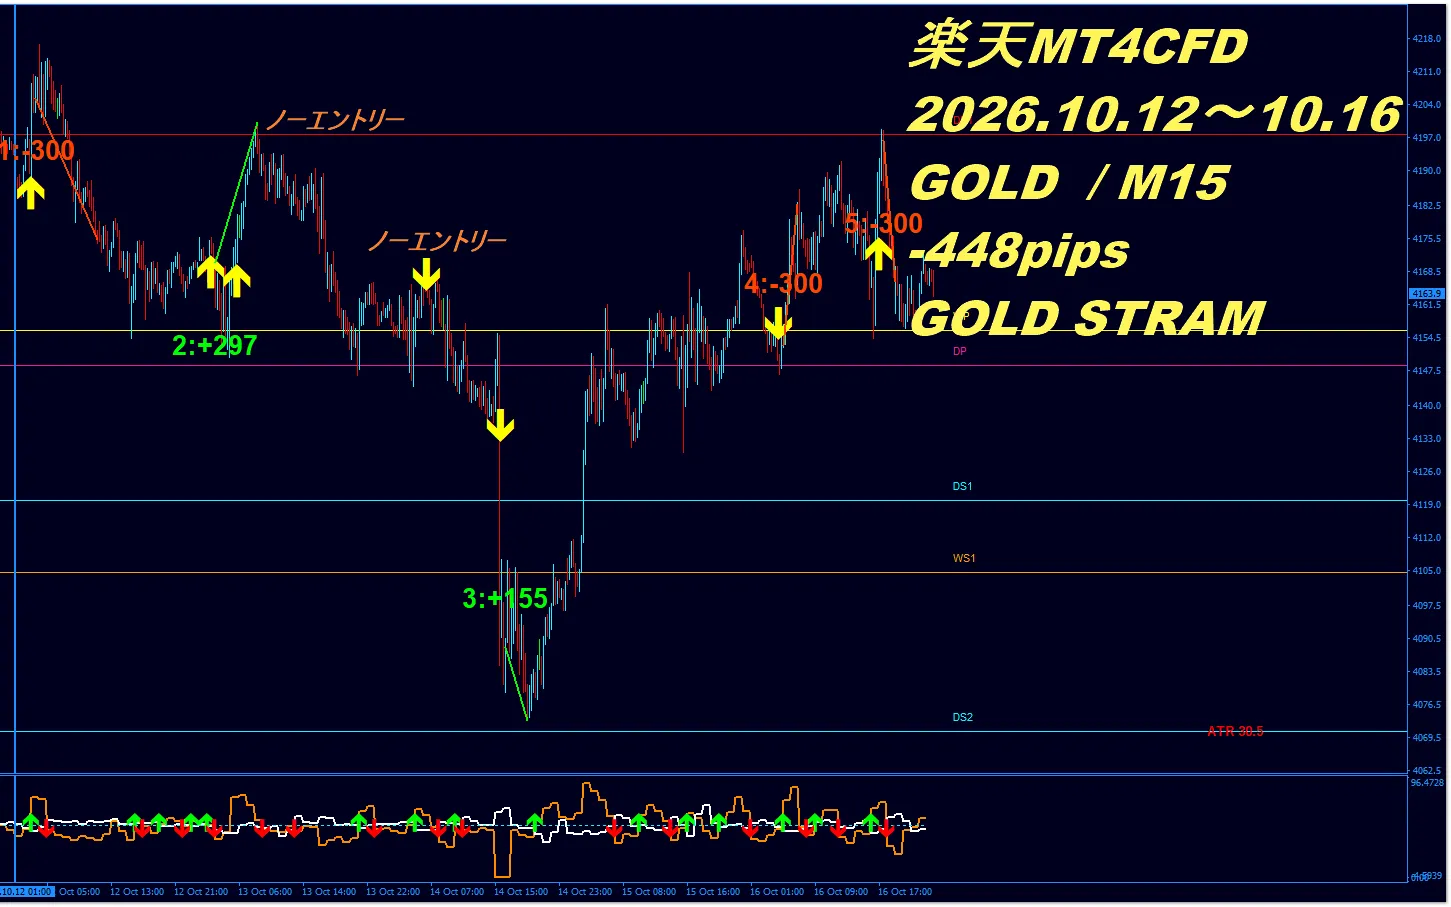
Looking at individual results, the first Buy (-300pips), the fourth Sell (-300pips), and the fifth Buy (-300pips) were hard losses hitting SL, while the second Buy yielded +297pips and the third Sell yielded +155pips. Total drawdown was-448.0pips (average -89.6pips).
On the other hand, the correlation mismatch (Correlation: ON) produced non-entry signals mid-way, preventing some reversing entries; this is a positive aspect to avoid unnecessary entries.
■ Verification Results from Win Rate, PF, Exp(R)
This week's metrics areWin rate 40.0%・PF 0.50・Exp(R) --- (negative territory)indicating a challenging week.
Profit Factor (PF)0.50means losses exceeded gains. With a fixed SL (300.0pips), loss per defeat is tightly controlled, but the V-shaped reversals after trends prevented profits from expanding sufficiently, leading to an overall loss.
■ Evaluation of Strength/Correlation Analysis
In markets where correlations and waveforms distort rapidly, the correlation mismatch no-entry filter becomes more important.
Without the filter, range-bound reckless entries could have widened losses. The filter minimizes waste trades and, by enforcing entries per the rules with SL risk control, provides a protective mechanism for long-term operation.
■ MAX Pips Scan & SL
This chart usesMODE: Max Pips Scan / Correlation: ON.
The displayed pips are the MAX value reached if the price action after signal generation is fully held.These numbers do not represent actual realized profits.Therefore, the values represent the maximum potential, not actual filled profits.
Moreover, stop loss decisions are based onthe 4-hour chart and are not determined solely by the short-term moves on the M15 chart.
■ GOLD Market Difficulty
★★★★★ 5 / 5
Despite a wide range of 5-day ADR at 735pips, many traps and frequent rapid reversals in a structure that makes discretionary or systematic trading very high risk, making it an extremely challenging market.
■ Evaluation of GOLD STREAM Weekly Trade Verification
★★☆☆☆ 2 / 5
Although the correlation mismatch filter reduced unnecessary losses and fixed SL constrained risk, the market's sudden shifts kept win rate at 40.0% and total -448pips. The defensive strength of the system is evident, but due to negative profitability, star rating is set to 2.
This confirms defensive robustness, but it remains financially negative, hence the two-star rating.
■ AI Overall Commentary
No matter how excellent a logic is, one cannot avoid temporary drawdowns in certain market environments. The important point is that this week’s volatile market was managed to avoid fatal damage through fixed SL and correlation filters, preserving account capital.
As proven by past tests, when GOLD returns to a normal trend, this tool can unleash explosive gains well over 1,000 pips. A design that keeps risk constant even in tough weeks allows a rapid upswing in the next favorable period.
Experience true professional trading with GOLD STREAM v2 that combines robust risk management to protect capital with an edge in big moves, and grow total capital through repeated wins and losses!
Verification numeric evidence
Are you hesitating on GOLD entry?
“Prices are rising, but I don’t know if I should enter now.”
“I can’t judge where to enter.”
“Prices move too much; entering feels scary.”
In markets like GOLD with wide price swings, it is important not to chase by feel alone, but to have criteria for entering or staying out byconfirming win rate, PF, expected value, strength, and correlation.
GOLD STREAM v2 specializes in GOLD day trading, and supports entry decisions by confirming market strength and correlation.
View GOLD STREAM v2 product page Ask a questionRelated Articles
If you want to know more about trading concepts and GOLD trading, see here.
- 【Video】“GOLD STREAM Signal Movement After Signal | TRADE REVIEW (2026.8.10–9.04)”
- The only reason results don’t come
- Why trades end up with “slow and steady gains”
- 【To reveal the tool’s full capability】GOLD STREAM Exclusive Win/Loss Analysis Tool Verification
- Conclusion: GOLD (XAU/USD) can be traded in Domestic FX accounts.
The verification results and figures published here are参考情報 based on historical market data and do not guarantee future profits or identical results.
The pips and P/L data shown are based on the maximum range reached after entry signals (MAX value) and are calculated using fixed stop loss (SL). These do not indicate actual realized profits or trade outcomes.
Actual profit and loss depend on entry/exit timing, spreads, slippage, trading fees, execution environment, position size, take-profit/stop-loss decisions, and market conditions. SL decisions are based on the 4-hour chart, and results may vary under actual trading conditions.
Furthermore, due to differences in trading conditions and price feeds, brokers/financial institutions/platforms may display different actual prices, pips, P/L, and fill results. Therefore, there may be discrepancies between published data and actual performance.
This data is reference material to verify the superiority of GOLD STREAM v2 signals and market analysis accuracy. Final investment/trading decisions should be based on your own financial situation, risk tolerance, and trading environment, and undertaken at your own risk.