
What to look at after breaking above GOLD, and how to follow the expanding pair and the "basis for buying"
I bought after waiting for the price to break above the high, but it was pushed back immediately.
What causes hesitation is whether to continue to hold, expecting it to rise again, or to reexamine the reason I bought. If you set the entry conditions so you can also track them while holding, you can organize your judgments.
This time we examine GOLD on October 16, 2026: the moment of considering a buy by combining the breakout of the recent high with the expansion of the BB on the 1-hour and 15-minute timeframes, and then the moment of rechecking the reason for the buy afterward.
Did it just clear the high with a wick, or did the close stay higher as well
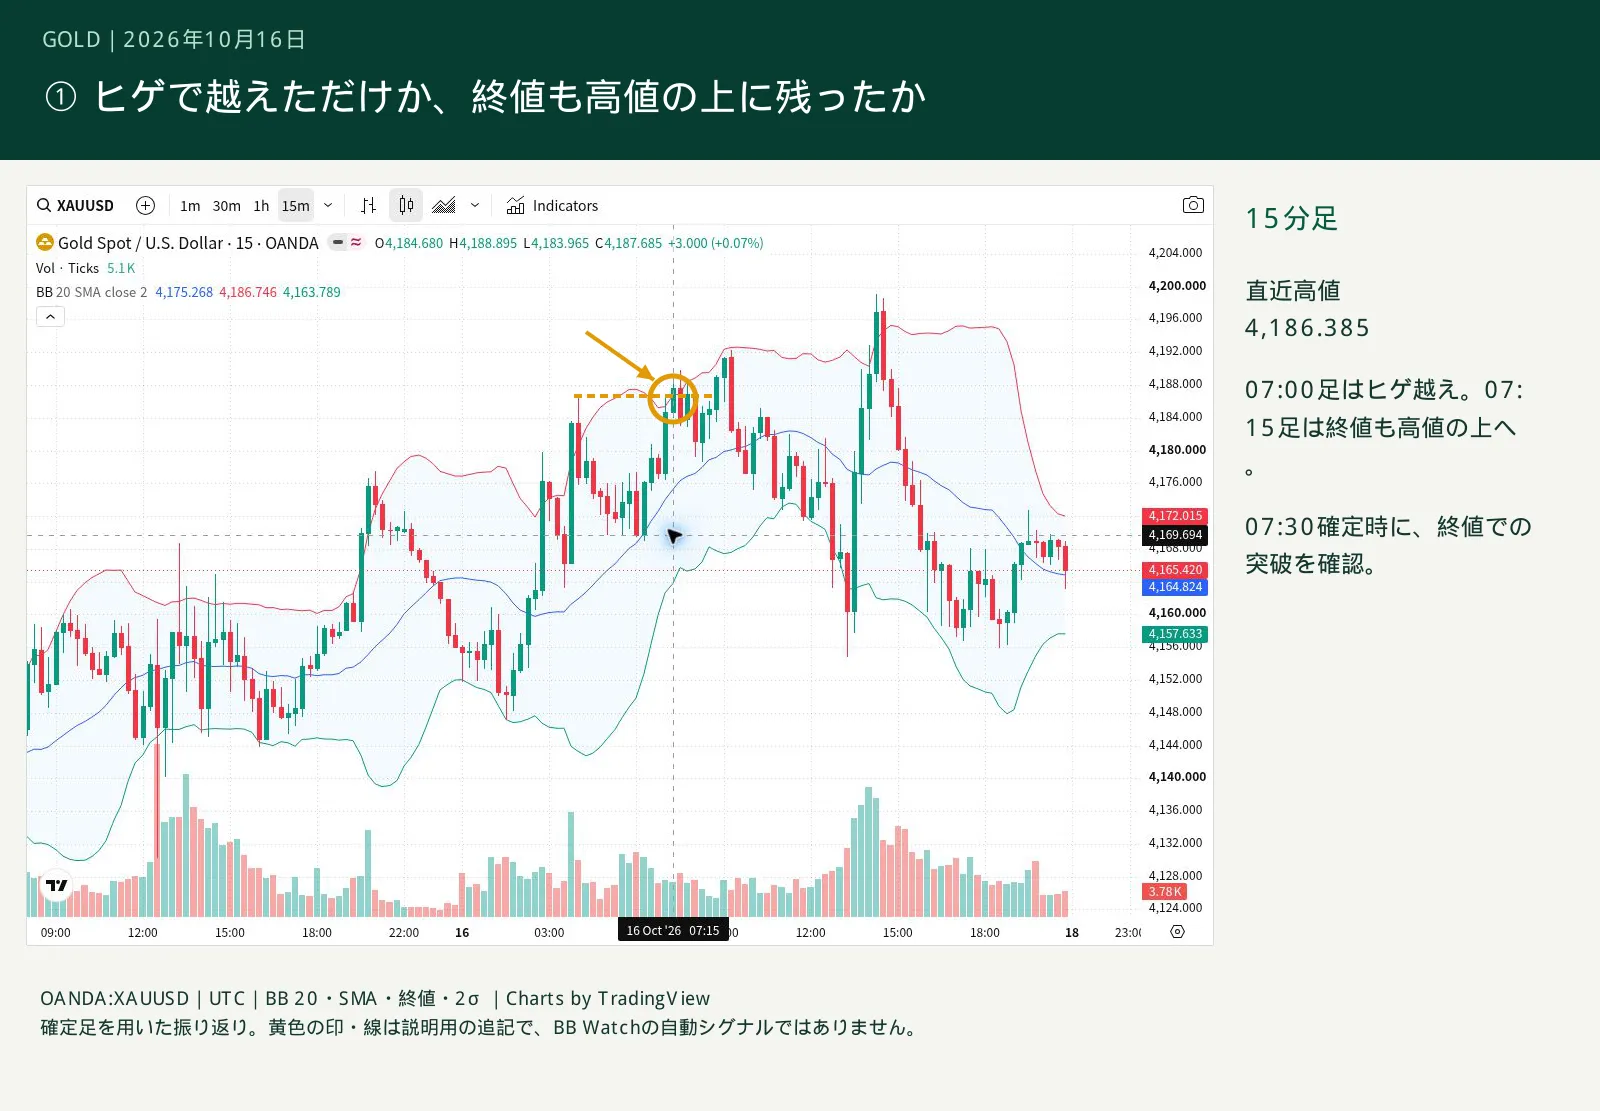
First, the milestone to watch is the high of 4,186.385 dollars set by the 04:00 15-minute bar. It was then pulled back, and by 07:00 it was confirmed as the near-term high price.
From 07:00 to 07:15, the 15-minute bar rose once to 4,186.625 dollars. However, the close was 4,184.685 dollars. Even if the wick surpassed the high, when the bar closed it retraced lower. If you require a breakout on the close, this bar still does not meet the condition.
The following 07:15–07:30 bar closed at 4,187.685 dollars and also surpassed the high on the close. This becomes a reason to consider a buy, saying, “the resistance I was watching was broken by the body.”
However, the next bar again closed below the previous high. This is not a situation where one expects it to move straight up after a break. Decide which price you want to see held, then cross-check with the pair’s BB as well.
When the pair’s expansion aligns, what can be added as a basis
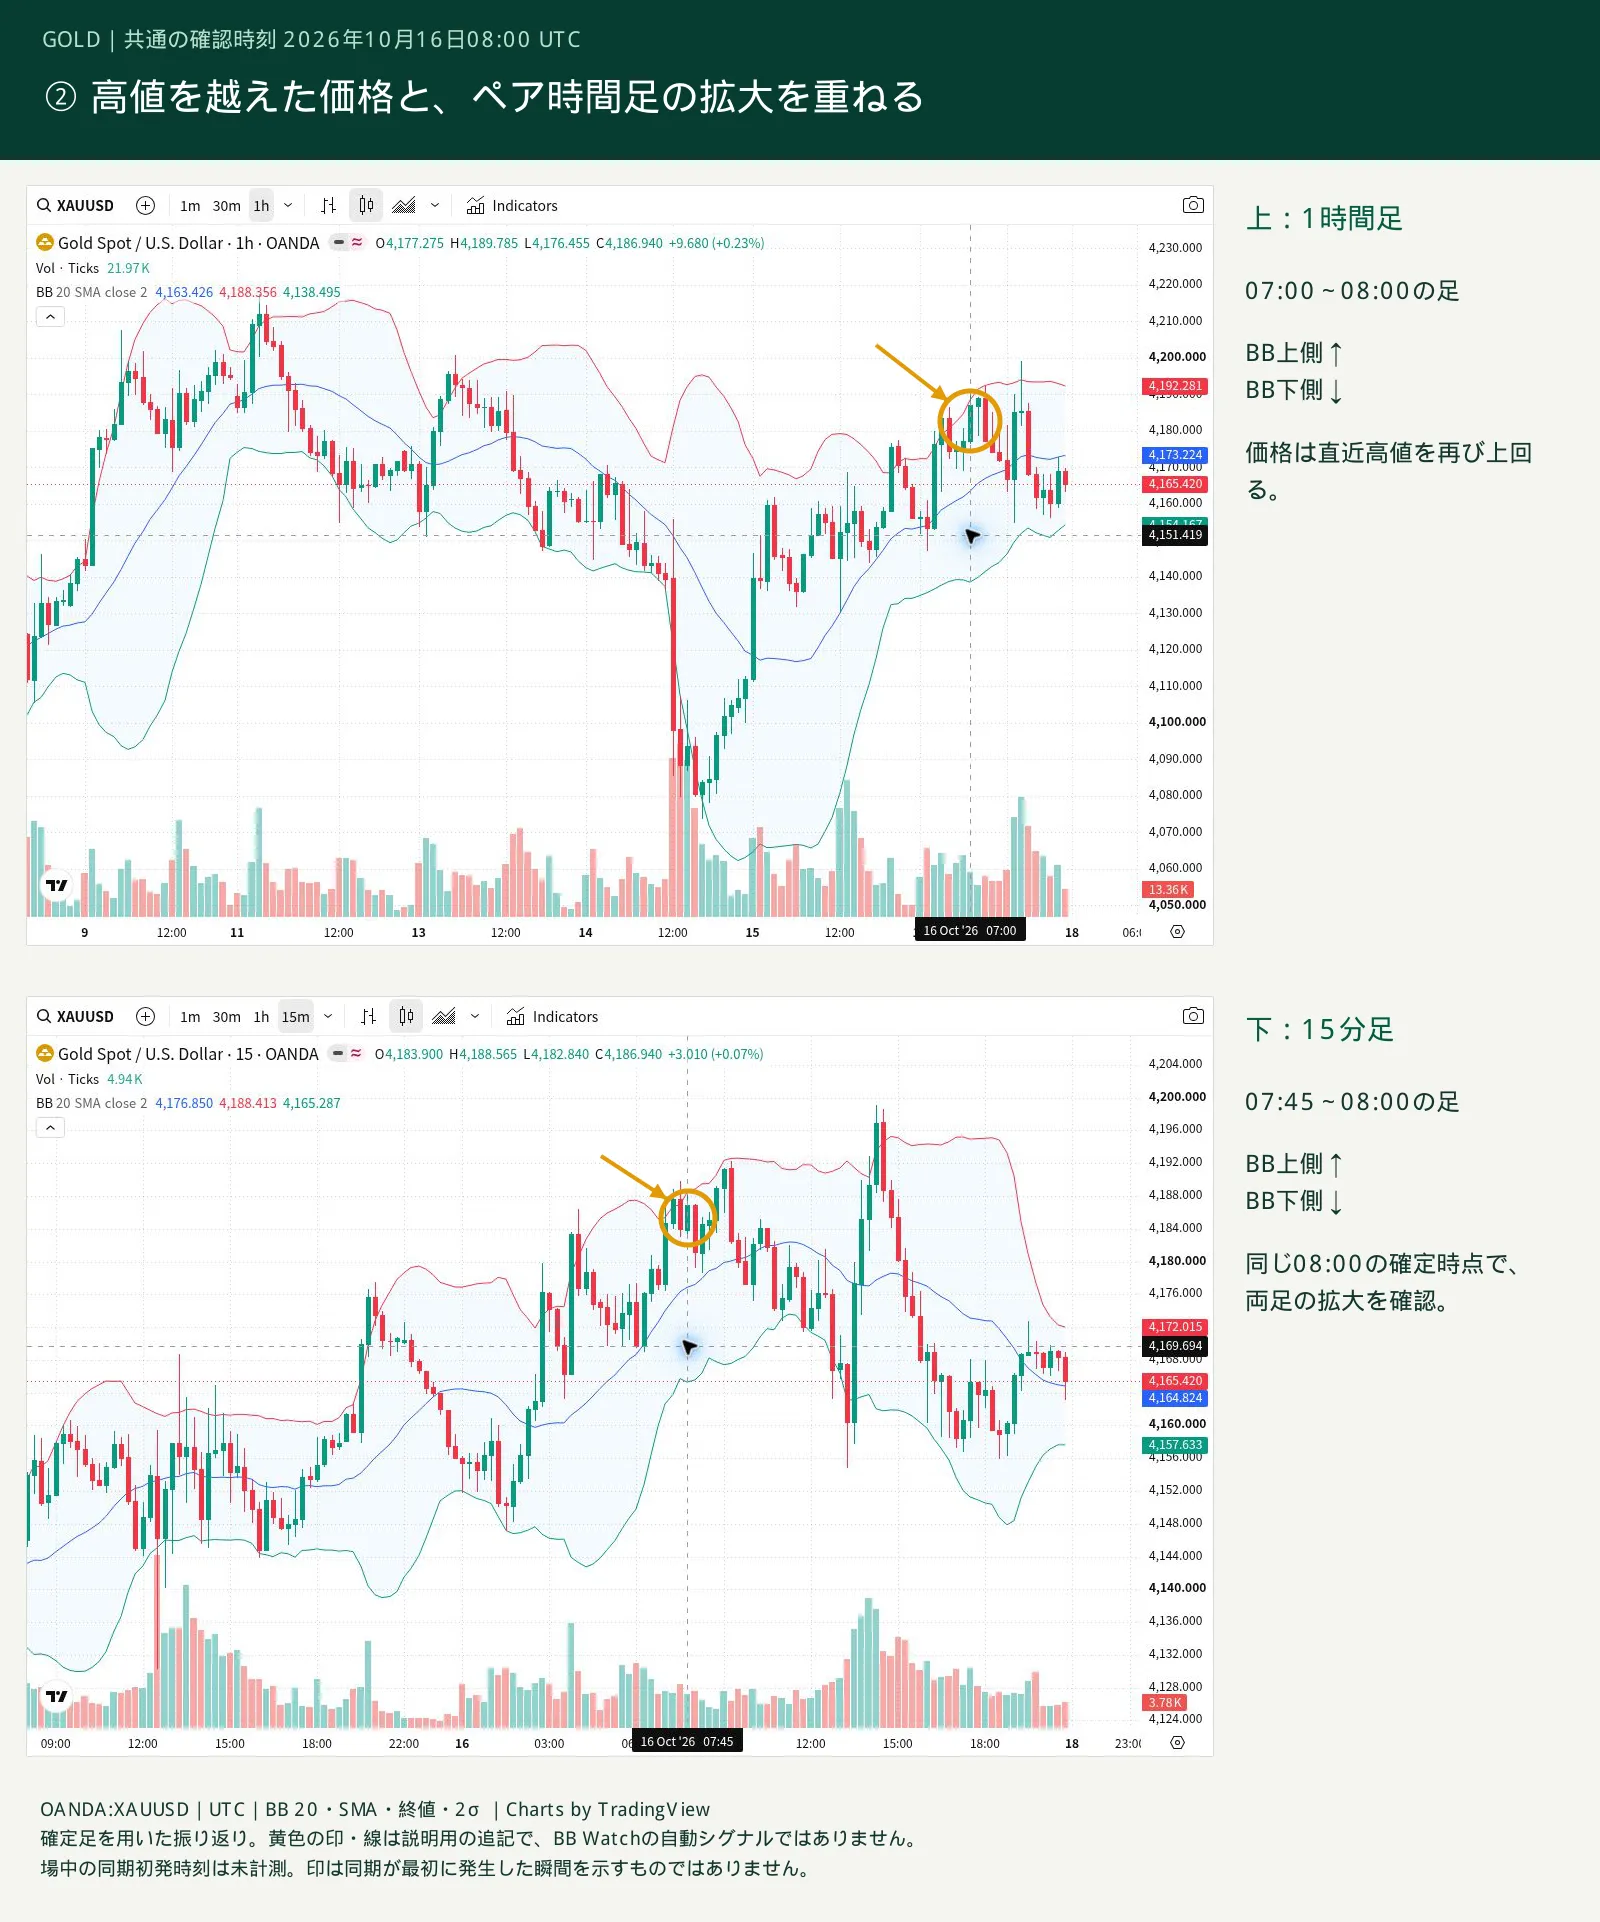
At 08:00, the 07:00 1-hour bar and the 07:45 15-minute bar were confirmed. In both, the upper BB moved up and the lower BB moved down compared to the previous bar. The close was 4,186.940 dollars, again exceeding the previous high.
Here, the breakout of the recent high coincides with the pair’s time-frame expansion. The price surpassed the target level, and the expansion aligned on two timeframes. This combination becomes the basis for considering a setup.
If you’re considering buying, compare the distance from the current price to the breakout high, the room up to the next resistance above, and the price at which you would deem the rationale invalid. Do not determine your profit target solely by BB expansion rate; consider it together with the price position.
In BB Watch, you can confirm changes in the chosen timeframe in the same window as your method. When approaching the resistance you aimed for, compare whether it is merely short-term momentum or whether both the price and the pair are expanding. Creating a sequence to verify when you are wary of false signals helps in avoiding them.
Note that the 07:15 bar shows both the upper and lower BB rising. The bar that broke through on the close is not the same as the one with the confirmed bilateral expansion here. Do not assume that the pair was already open the moment you break through; instead, verify the changes visible at that moment.
If the basis for buying changes, also review the holding
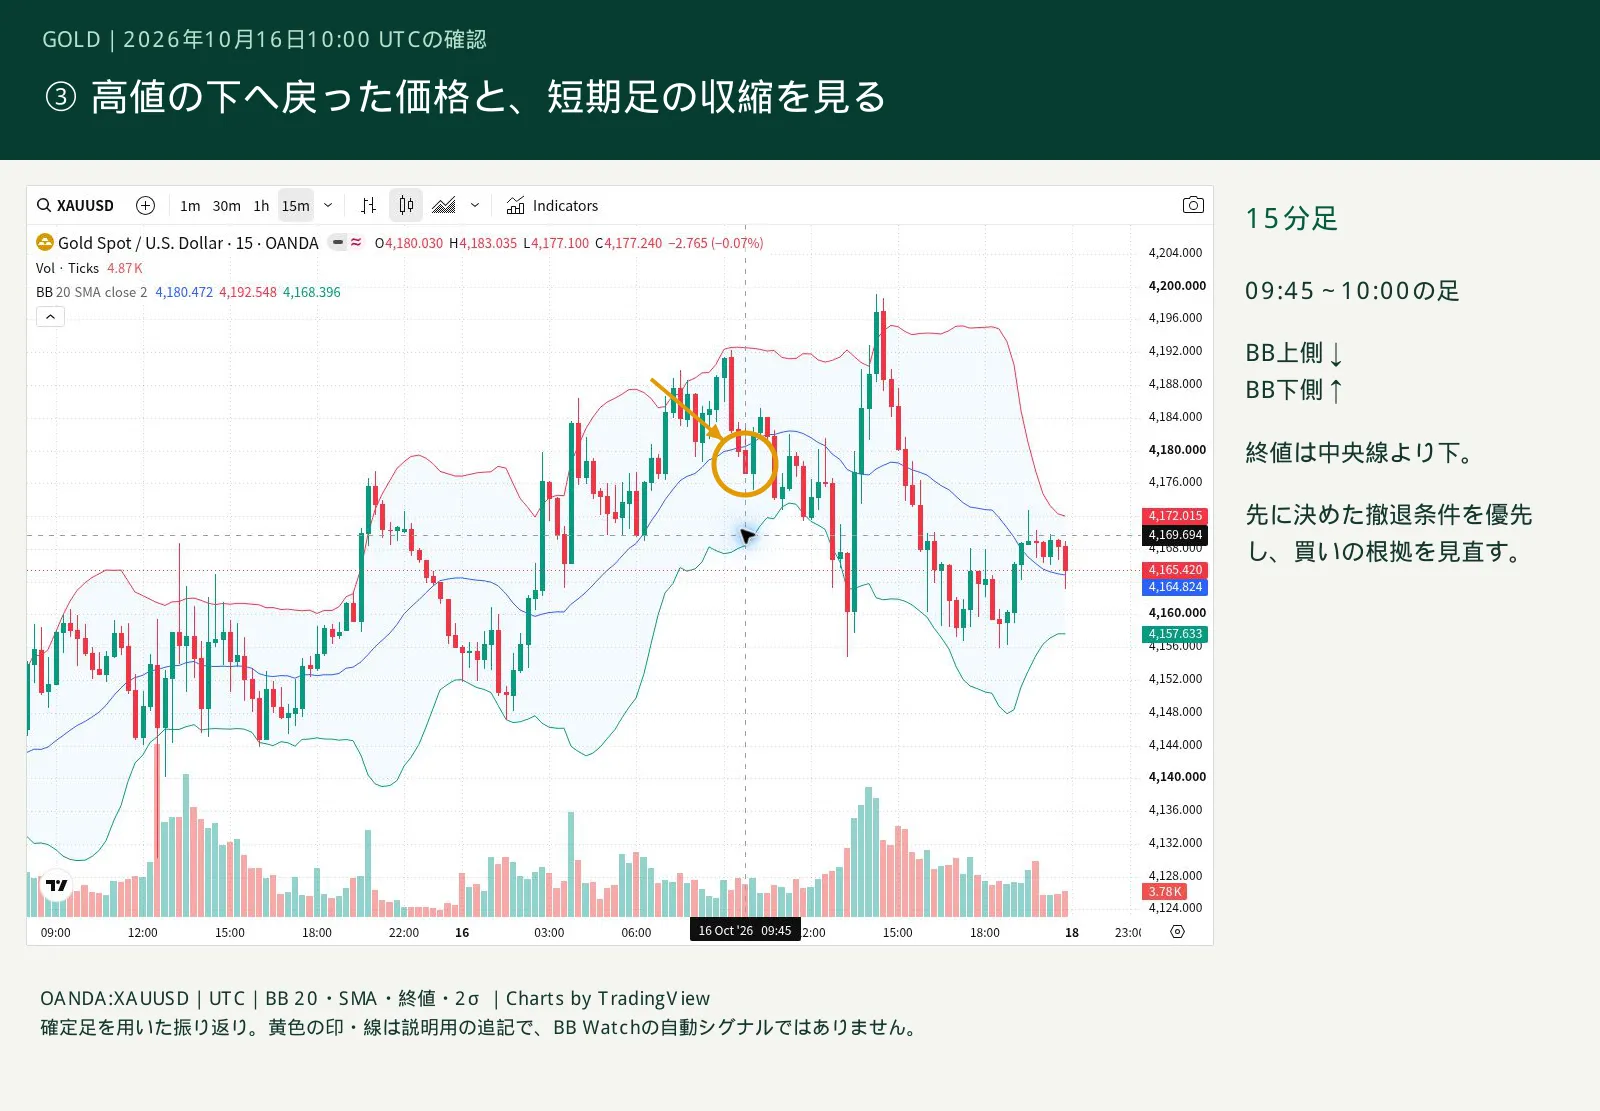
Afterward, the 09:15 bar rose to 4,192.285 dollars. However, its close was 4,182.515 dollars, returning below the breakout high.
If you bought expecting “the breakout high should hold above,” this retracement is material to review. You do not need to continue holding merely because the pair expanded at entry.
In the 09:30–09:45 bar, the close fell below the BB’s middle line and the band width contracted. Furthermore, in the 09:45–10:00 bar, the upper band moved down and the lower band moved up. The price returning below the marked level coincided with the short-term contraction.
In this scenario, by 10:00, when contraction was confirmed, the price was below the 08:00 buy-entry level. Therefore, instead of waiting for contraction, prioritize the exit condition you decided earlier. Use retracements to the breakout high or other conditions to re-evaluate your holding when your criteria are invalidated.
Turn the fear of false signals into a matter of places and procedures
Before entering, first check whether the price is in the zone you’re targeting. Next, confirm the pair’s expansion in line with that wave. If only one side aligns, determine whether your prepared conditions are met.
After entering, keep tracking whether the price remains on the broken-side or whether the short-term bar expansion continues. Linking “why enter” with “where to review” helps in pre-entry filtering and post-entry judgment.
This time it’s a 1-hour × 15-minute combination, but the pairing is not fixed. Some people view the 4-hour wave with this pair, others use 15-minute waves with 5-minute × 1-minute. Choose a pair that fits your own market analysis and entry conditions.
Follow the basis for the setup in the same window afterward. You can check how BB Watch displays and how to use it on the product page.
View BB Watch’s display and how to use it
Observational conditions
OANDA:XAUUSD, price in USD per troy ounce. Times are in UTC; Japan time is plus 9 hours. BB is 20-period, SMA, close, and standard deviation 2. The bar times are the start times; H1 closes one hour later, M15 closes 15 minutes later. Figure 2 is the common confirmation point at 08:00; Figure 3 is the bar confirmed at 10:00. The moment of initial synchronization during the session is not measured. Confirmation of bars depends on the method.
Chart: TradingView. Explanations are added to a real chart with the logo left intact.
View the chart source (TradingView)
Examples from past charts for buy/sell judgments are not actual trading results. There is a risk of loss in trading.