

Use SILVER's small breakout as a candidate for a setup. Confirm the buying rationale using the 1-hour and 15-minute charts
“I broke through the high price. But it might be pulled back again.”
While hesitating like that, you drift away from the price you wanted to buy at. When aiming for a breakout, in addition to the breakout level, you should also observe changes in the time frame that match the wave you’re targeting.
This time we’ll use SILVER on October 9, 2026. The 15-minute chart that surpassed the most recent high and the 1-hour chart that includes that movement. By comparing two BBs, we follow from the point of considering a buy to the point of protecting profits.
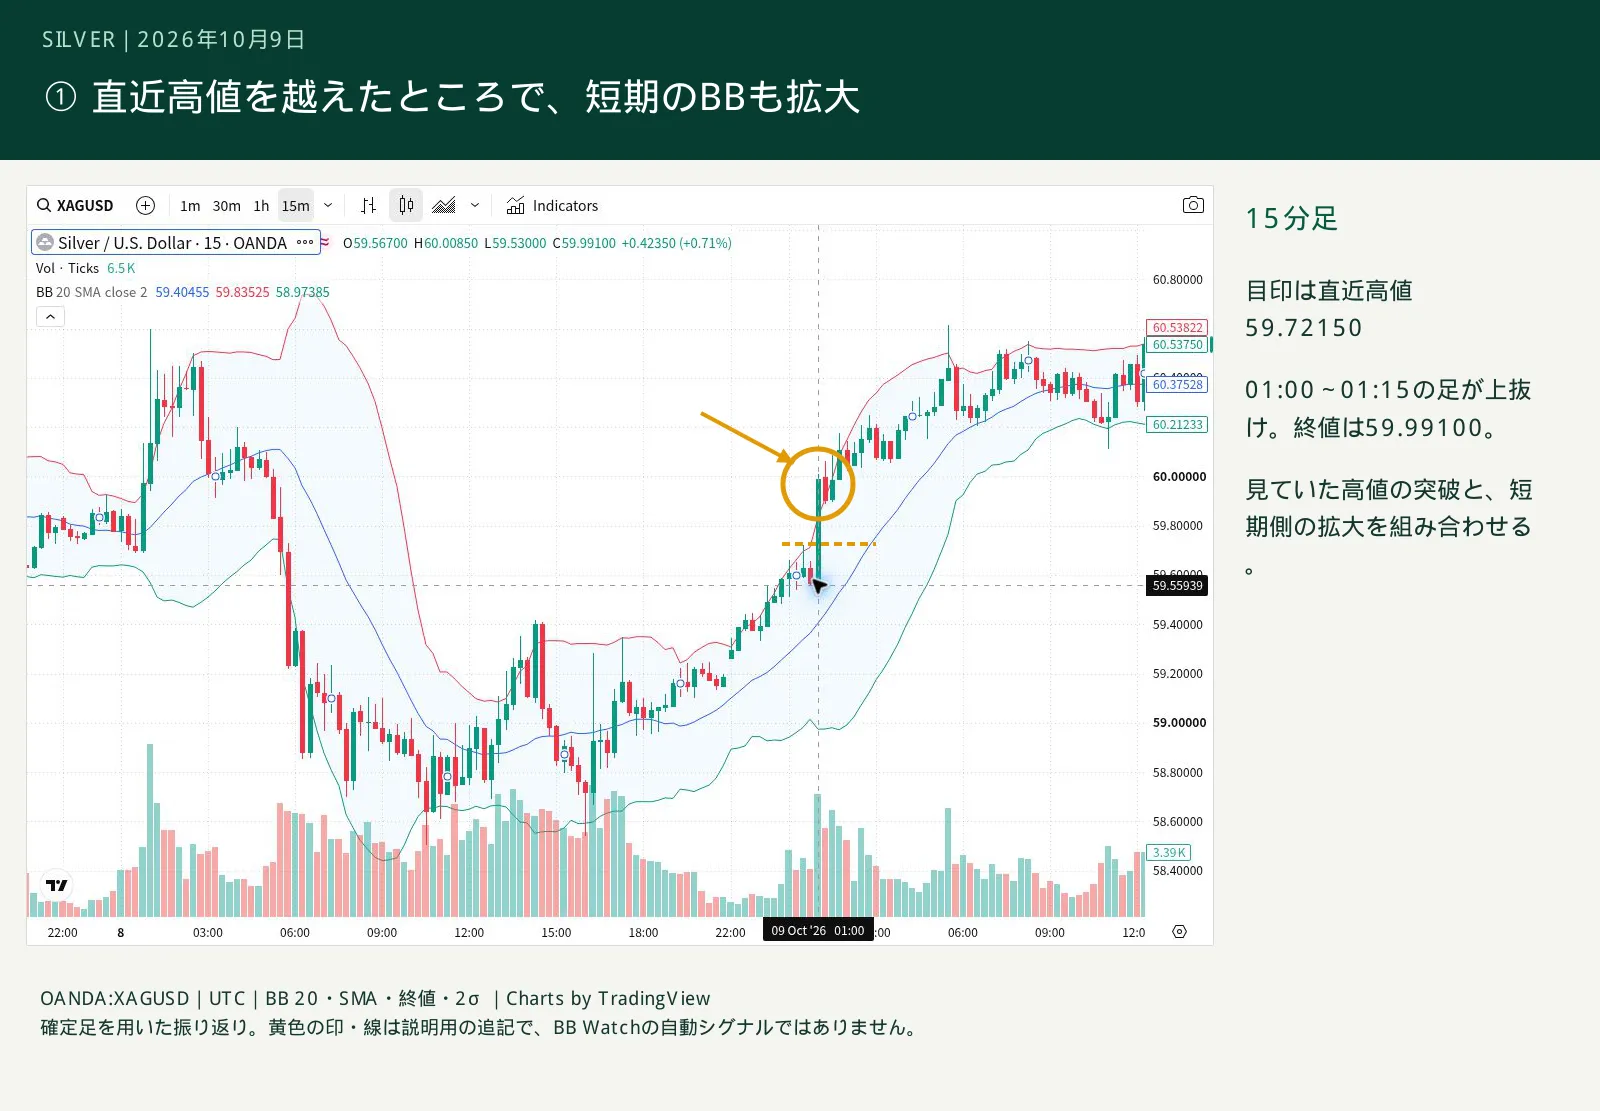
First, which high should be surpassed to consider buying
The high on the 15-minute chart at 00:30 was $59.72150. The next candle did not exceed this high and closed at $59.56750. By 01:00, a marker indicating the near-term resistance had formed.
If this level is broken upward, consider buying from a brief consolidation. This is the moment to prepare and look at the chart. Since the price had traded above $60 the previous day, you don’t need to assume all major resistances were broken. First target the immediate pullback wave.
From 01:00 to 01:15, the 15-minute chart surpassed $59.72150 and closed at $59.99100. At the same time, the BB on this candle moved higher on the upper band and lower on the lower band compared to the previous candle. This is the point where the breakout of the recent high and the short-term expansion coincide.
Rather than rushing to buy because the price moved, you should buy after the price breaks the high you’re watching and the short-term BB also opens. Combining price and BBs makes your reasons for entering concrete.
Is there expansion in the 1-hour chart as well?
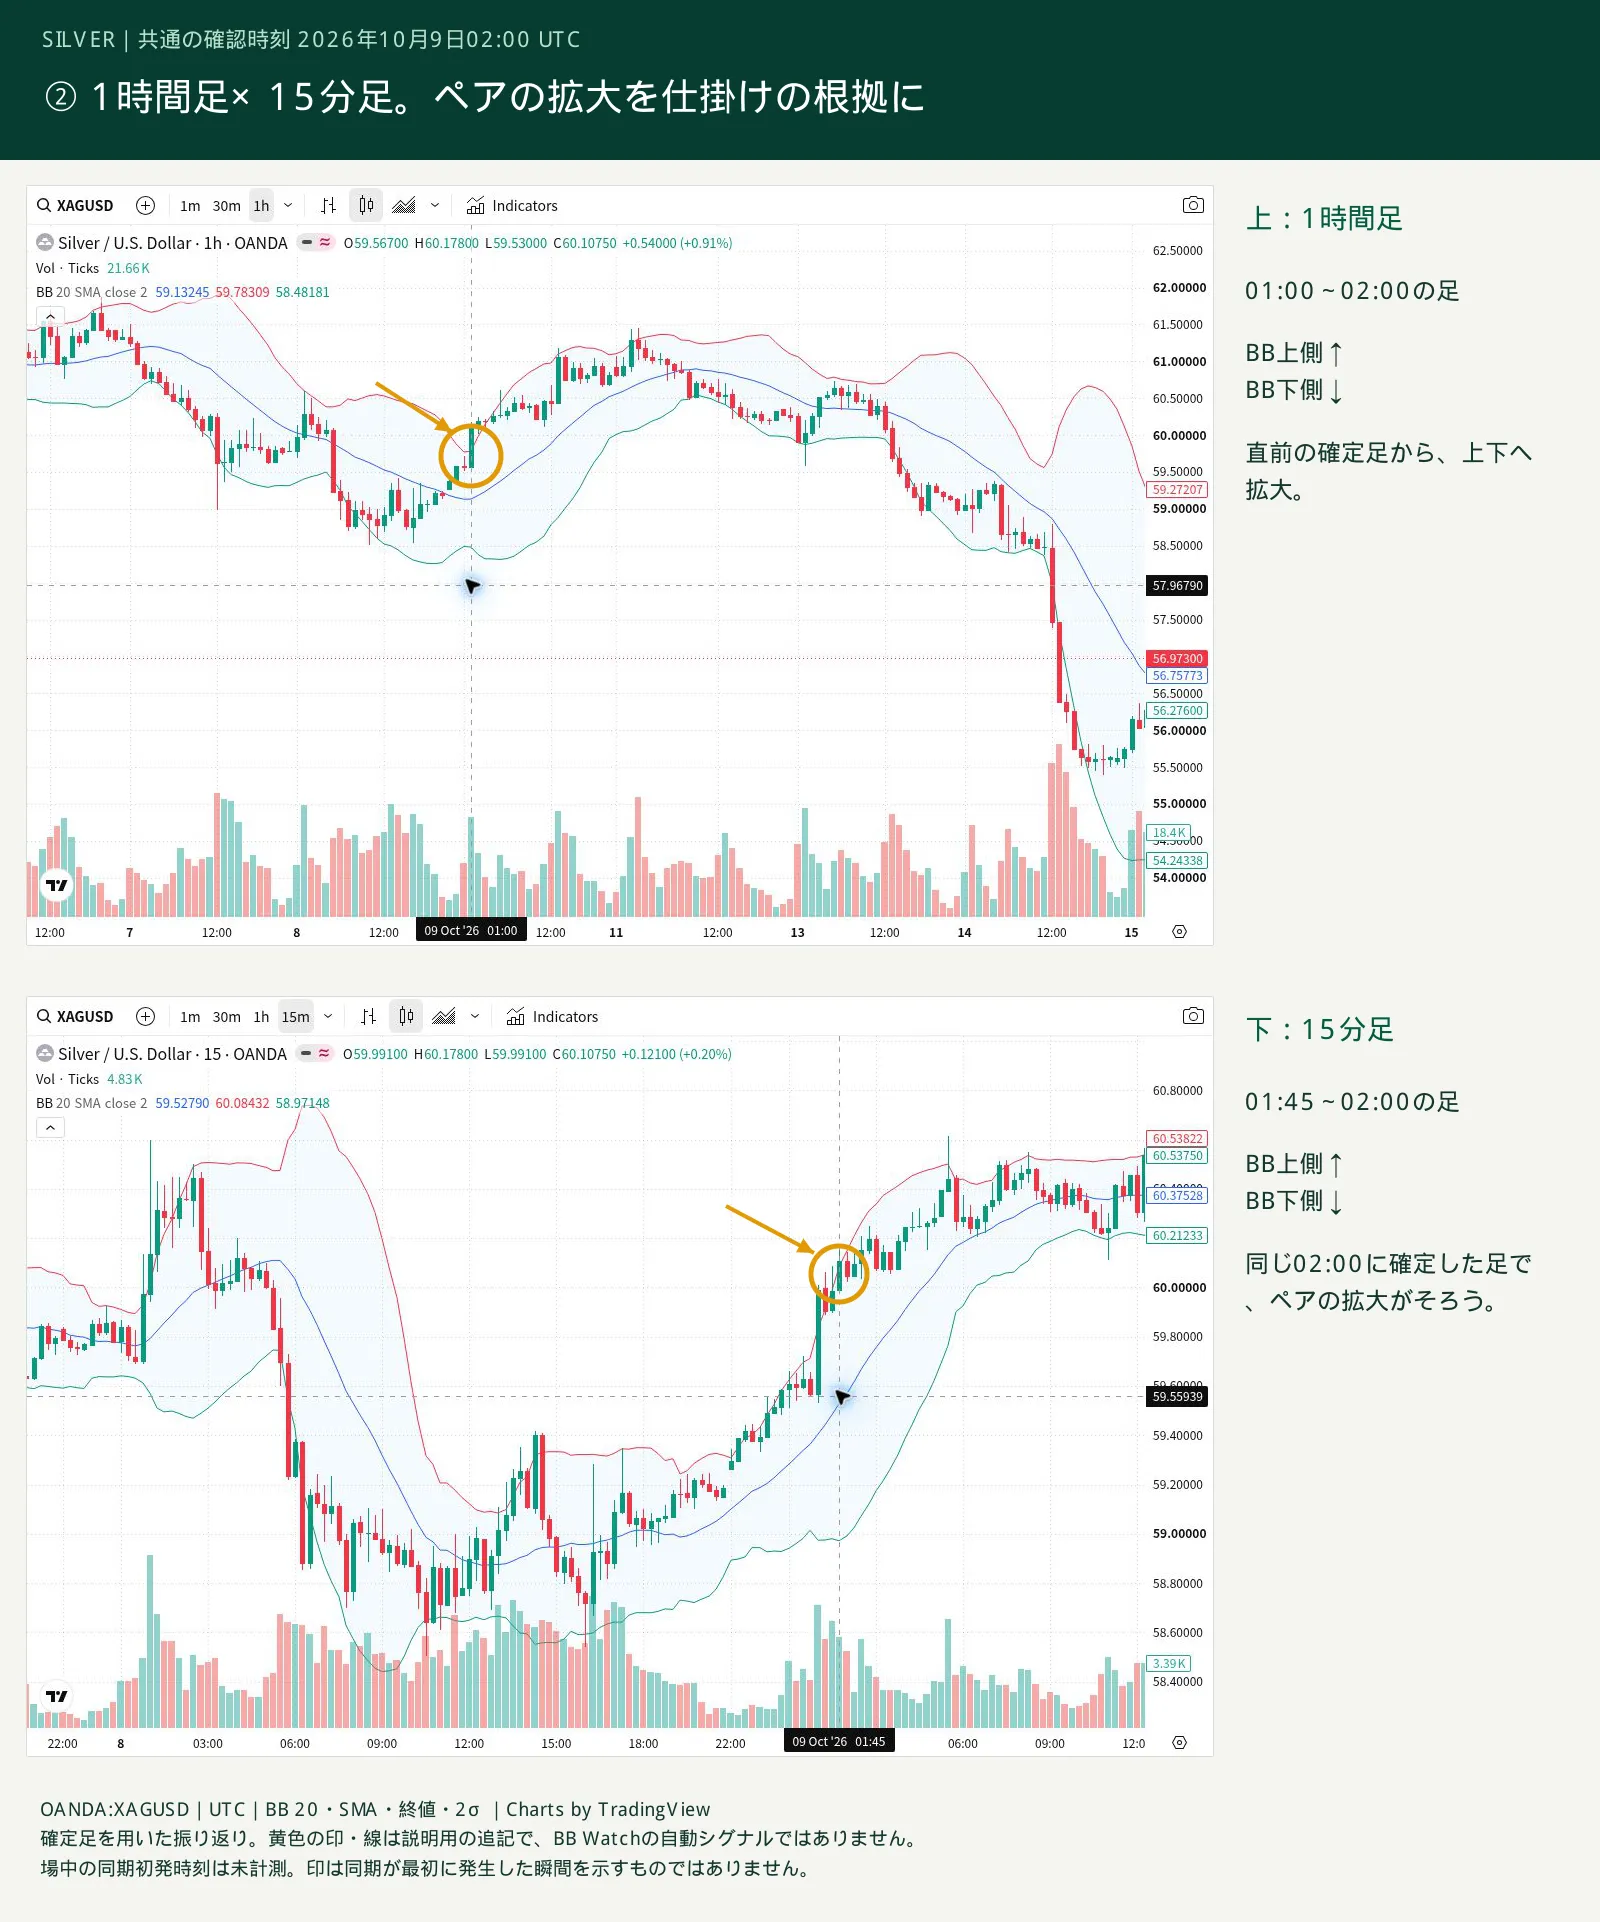
Next, line up the 1-hour chart and the 15-minute chart. The 01:00 candle on the confirmed 1-hour chart at 02:00 and the 01:45 candle on the 15-minute chart both show the upper and lower BBs expanding outward compared to the previous candle. The closing price is $60.10750. At this point, you compare the distance from the breakout high to the next resistance and decide whether to follow with a buy.
What you want to confirm here is the synchronized expansion across paired timeframes. If the price surpasses the target high and expansion occurs not only on the short-term side but also on the other timeframe, you add that combination as a justification for entering.
With BB Watch, you can compare changes across selected timeframes in the same window. By reducing the need to keep watching candles around resistance and repeatedly switching charts, you can clearly identify the items to check when the moment to enter arrives by preparing the pair according to your strategy.
If only the short-term side is expanding
As a use, don’t jump in just because the 15-minute momentum is strong; also confirm the change on the 1-hour chart. If the pair hasn’t aligned yet, your planned buying condition is not complete. You can decide whether to follow through after watching or to pass through the breakout.
This is a way to convert anxiety that it might be a false breakout into a checklist. BB Watch’s advantage is “assisting to avoid false breakouts.” In addition to the expanding pair, check if price remains above the breakout high. If the price returns to the original range despite the breakout being targeted, you should reassess your buying justification.
After confirming the expansion, also track changes to protect profits
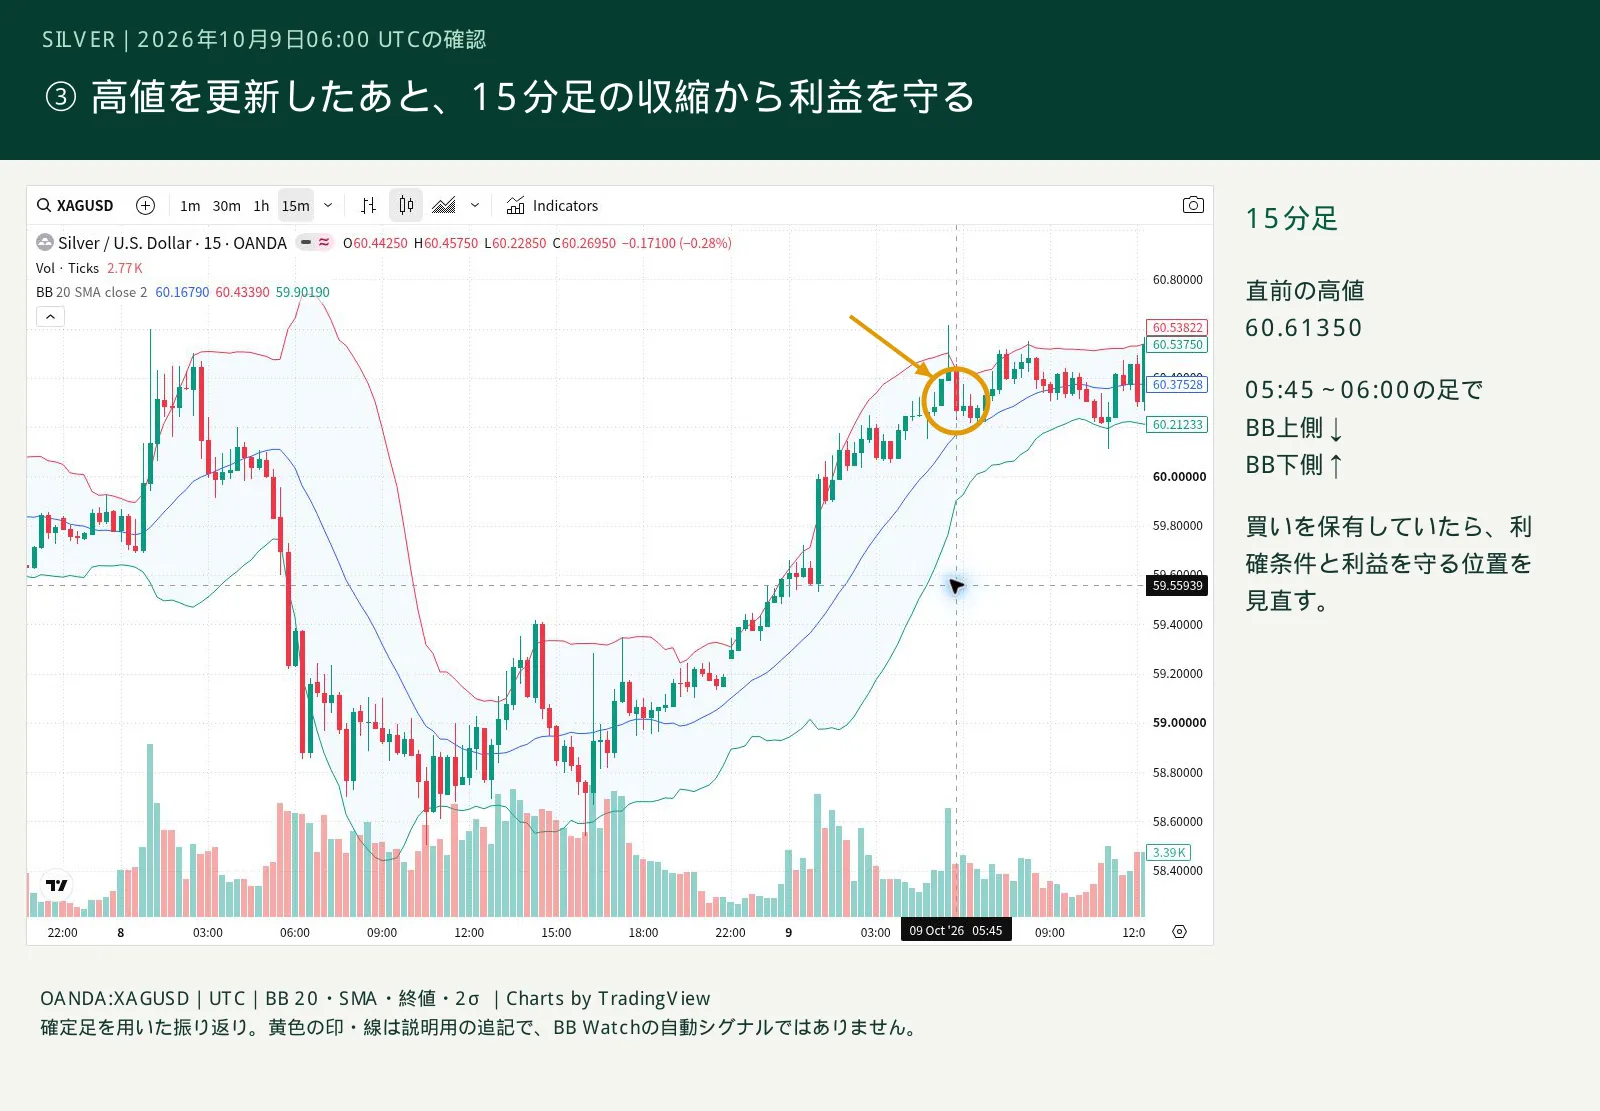
Thereafter, the 15-minute chart from 05:30 to 05:45 rose to $60.61350. In the subsequent 05:45 candle, the upper BB fell and the lower BB rose. At the 06:00 confirmation point, you can see the 15-minute band moving back inward.
If you were holding a buy position at this point, you should not only chase new highs but also review recent lows and your profit-taking criteria. Consider taking partial profits and protecting the remaining gains.
The close of this candle was still above the BB’s middle line. Do not decide the move is finished just because of a contraction; also consider where the price is. BBs do not determine the price range to reach. Check the space to the next resistance on the chart, and use BB Watch to track pair expansion and short-term changes. Using this role division makes it easier to organize entry and ongoing holding decisions.
Use it in line with the wave you’re aiming for
This time we covered the 1-hour × 15-minute pair. The combination changes depending on the wave being targeted and the method. For example, for a short-term trade aiming at the 15-minute wave, you can also look at a 5-minute × 1-minute pair.
Predefine the resistance you’re aiming for and the time-frame pair, and observe whether expansion aligns when you break through. Please use BB Watch as a tool to confirm the justification at the moment of entry.
BB Watch product page
View BB Watch’s display and usage
Observation conditions
OANDA:XAGUSD, price in USD per troy ounce. Times are UTC; Japan time is UTC+9. BB period 20, SMA, close price, standard deviation 2. Candle times are the start times; H1 is confirmed after 1 hour, M15 after 15 minutes. Figure 2 is the comparison of the candle confirmed at 02:00, Figure 3 is the consolidation confirmed at 06:00. The figures are comparisons based on fixed candles; during trading, you will verify breakouts and pair changes in real-time, and you can adjust your waiting for confirmation according to your conditions.
Chart: TradingView. Explanations are added to the actual chart with the logo preserved.
View chart source (TradingView)
Examples of trading decisions using past charts are not actual trading performance. Trading carries the risk of loss.