

[GOLD Strategy] Why does your trading waver? Two answers to overcome "Piziposi disease" and "unfounded settlements" and to accumulate expectancy
"Even when trying methods said to have high win rates, for some reason the funds are decreasing by the end of the month..."
"Right at entry, I feel it might move against me and I can't settle..."
Are you trading GOLD (gold) and have you experienced such painful moments?
I will state categorically that the reason you are losing is not because you lack talent nor because you haven't studied the market enough.
The reason is extremely simple: there is no objective basis for both the entry and the exit (settlement).there is no objective basis for both the entry and the exit (settlement).

1. The fundamental cause of trading collapse: absence of evidence-based rationale due to emotion
Many losing traders unconsciously insert “emotions” when facing the market.
Entries without basis (P oscillation syndrome)
When the chart suddenly moves, they jump in because they don’t want to miss out (FOMO)
They hold positions at mid-range levels for no real reason
Exit without basis (chicken take profit and all-back)
When some profit appears, they close at a few pips because they fear losing it (chicken take profit)
If price moves against them, they pray it will come back and delay the stop loss, ultimately forcing a margin call
They chase an overly distant dream target for profit, causing unrealized gains to go to zero or negative (all-back)
Because there is no objective basis for entry, after entering they endlessly worry, and exits are governed by fear and greed.
This becomes gambling, and the results will inevitably be volatile.
2. The only way to survive in the market: pursue “expectation value” rather than one single win or loss
Top professionals who keep winning do not swing at every moment they might win the next time.
What they pursue is the formula that leaves funds on hand when repeating the same rules 100 times, 500 times (expectation value).

There are various conditions to stabilize the “expectation value” in trading, but I mainly use only three.
Wait thoroughly to the place where large orders exist (eliminate wasteful losses completely)
Set the “appropriate risk-reward” aligned with GOLD’s volatility (RR around 1.5) (reliable exit)
A physical brake suited to the market environment (self-destruction prevention in low volatility/high spreads)
Even if you understand in your head that patience is important and to follow the rules, it is extremely difficult for a living person to implement it by themselves.
That’s why you need armor that forcibly makes you wait for the right moment and visualizes the calculated exit on the chart.
Here, I present two objective answers tailored to GOLD’s characteristics: short-term and mid-term.
3. [Answer ①] 1-minute chart scalping: pull back to the large order’s pending zone and strike

The iron rule to maximize expectancy in short-term scalping is: “do not touch outside the large orders’ residual supply-demand zones (unsettled zones: FVG/OB).”
Completely block entries at midpoints with a system, then once the price reaches the large-order zone, strike only when price action (pin bars, engulfing, price reversal) is confirmed.
The result of systematizing “waiting” is the following practical verification data.
'Rebalance Sniper' practical verification data
Subject of verification:GOLD 1-minute chart (fully confirmed candles, no repaint)
Verification sample size:about 1 month (50,000 bars / 619 trades)
Risk-reward:RR 1.5 fixed
Subject of verification:GOLD 1-minute chart (fully confirmed candles, no repaint)
Verification sample size:about 1 month (50,000 bars / 619 trades)
Risk-reward:RR 1.5 fixed
| Item | Record and win rate | Profit factor (PF) | Gained pips |
| Overall performance | 367 wins 252 losses (win rate 59.3%) | PF 1.93 | +8,651.8 p |
| ★ OB hot sign | 105 wins 60 losses (win rate 63.6%) | PF 2.15 | +2,899.6 p |
| PA reversal trigger | 223 wins 157 losses (win rate 58.7%) | PF 1.97 | +5,043.4 p |
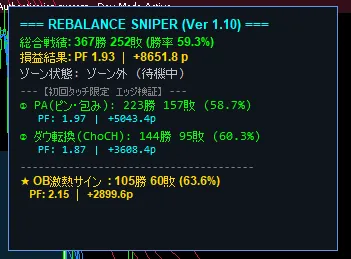
【Lot-based theoretical earning estimates】 (1 pip = $0.1 / 1 USD = 150 JPY)
Small test operation (0.01 lot): about+12,900 JPY
Standard side-by-side trading size (0.10 lot): about+129,700 JPY
Full-time professional size (1.00 lot): about+1,297,000 JPY
Q. Won’t 1-minute charts have frequent spread losses and whipsaws?
A.That’s correct. That is why this tool continuously monitors spread limits and automatically stops signals when the spread exceeds an acceptable level (initial value 45 pips). It also prohibits blindly entering in non-existent zones and focuses only on “large-zone rebounds,” which maintains an amazing expectancy value PF above 1.9 even on the 1-minute chart.
4. 【Answer②】15-minute and 30-minute intraday trading: eliminate noise and secure a reliable RR1.5

For part-time traders who have daytime jobs and cannot monitor the 1-minute chart, mid-term chart breakouts offer an answer.
Many people give up on GOLD’s mid-term timeframe because they either chase too big profit targets and get all-back, or get caught in a non-moving range and incur repeated stop-outs.
“Break Trigger” turns on and off signals in unsafe markets using %ATR volatility and ADX bottom-cut to stop glow signals when momentum is absent.
Furthermore, by strictly applying the most profitable “reliable RR1.5” for GOLD’s cruising speed, noise is completely eliminated.
The upper timeframe has too few samples in the past weeks to be reliable, so we validated with a very long-term dataset of 【past 30,000 bars (years’ worth)】.
'Break Trigger' long-term verification data
Subject of verification:GOLD (fully confirmed candles, no repaint・RR1.5 fixed)
Verification sample size:past 30,000 bars (each timeframe about 500–600 trades)
| Timeframe | Record and win rate | Profit factor (PF) | Gained pips |
| 15-minute (M15) | 315 wins 171 losses (win rate 64.8%) | PF 1.41 | +15,933.4 p |
| 30-minute (M30) | 394 wins 214 losses (win rate 64.8%) | PF 1.64 | +28,138.1 p |
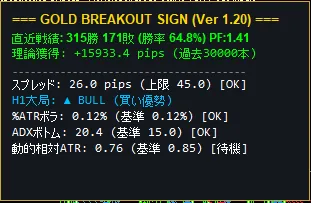
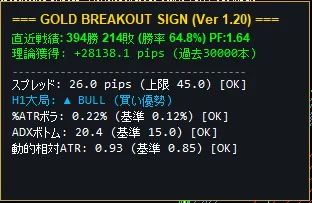
【Lot-based theoretical earning estimates (30-minute trading)】 (1 USD = 150 JPY)
0.01 lot (small, relaxed): about+42,200 JPY
0.10 lot (steady part-time day trading): about+422,000 JPY
1.00 lot (wealth-building lot): about+4,220,000 JPY
Q. Past 30,000 tests—doesn’t that amount to overfitting to historical data?
A.On the contrary. Overfitting refers to tactics that pretend 100% win rate over a narrow window of the last 10–20 trades. This verification uses a vast number of trials (30,000 bars, about 500–600 trades) across rising trends, crashes, and ranges, maintaining PF 1.64. Because there are no complex parameter adjustments and RR1.5 is fixed, the edge remains highly reproducible in future markets.
5. Summary: discard emotions, choose a “weapon” that fits your lifestyle

Signal tools are not a magic wand that makes anyone a billionaire simply by buying.
Their essence is to physically eliminate the gambler’s mindset and baseless exits, and to force you to “wait” until large-order points appear as a protective measure.
Which weapon is superior is not the point; choose one that fits your life rhythm.
For those who want to focus on a few evening hours and precisely cut only the large-order rebounds
? Large-order supply-demand zone-focused scalping: 'Rebalance Sniper'
For those who have daytime work and want to set passive orders when signals appear
? Noise-cutting mid-term trend-following:'Break Trigger'
Let’s end days of being tossed by short-term price moves and reducing funds with baseless entries.
Acquire objective data and expectancy as your allies, and achieve consistent, disciplined trading.