
AI Analysis Visualizer for MT5 AI Assistant Support Page
Thank you for using our product.
For those who are considering a purchase, you can buy from the following site
https://www.gogojungle.co.jp/tools/indicators/88372
Latest version:1.18.20261030
The upgrade is free ⇒Download Center
※By downloading or starting this product,Terms of Use are deemed accepted.
You can also download from the following page.

Product Contents
AI_Objects_rcm is an indicator that links MT5 charts with an AI assistant, drawing analysis results on the chart.
By simply asking the AI Assistant to analyze the chart, it can draw trend lines, horizontal lines, Fibonacci retracements, and other elements according to the analysis results.
You do not need to specify each object individually. You can start with natural phrases like “Analyze this chart” or “Tell me the Fibonacci reversal points.”
Main Features
- AI-powered chart analysis and drawing: When you request analysis, the necessary lines and figures appear on the chart according to the content.
- Operate with natural language: You can request analysis and drawing in everyday words without memorizing special drawing commands.
- Supports diverse objects: You can display horizontal lines, trend lines, Fibonacci, rectangles, texts, etc.
- Visually confirm analysis results: AI-analyzed price levels and focal points can be viewed directly on the chart.
- Also supports additional instructions: After reviewing the drawing results, you can request further analysis or add/modify the display content.
Supported Environment and Assumptions
- Supported Platform: MetaTrader 5 (MT5) *MT4 is not supported.
- AI_Objects_rcm must be applied to the chart you want to draw on as an indicator.
- On the MT5 AI Assistant side, you must configure settings to use AI_Objects_rcm.
-
If MT5 AI Assistant is unavailable in your environment, you cannot use this tool’s features.
This tool itself does not perform market analysis. It instructs the MT5 AI Assistant to analyze or draw, and displays the results on the chart.
How to Install
1. Install the Indicator
- Start MT5.
- From the menu, select File → Open Data Folder.
MQL5\IndicatorsOpen the folder.- Place the AI_Objects_rcm files into the folder.
- Restart MT5 or right-click in Navigator and select "Refresh".
- Apply AI_Objects_rcm to the chart where you want analysis or drawing.
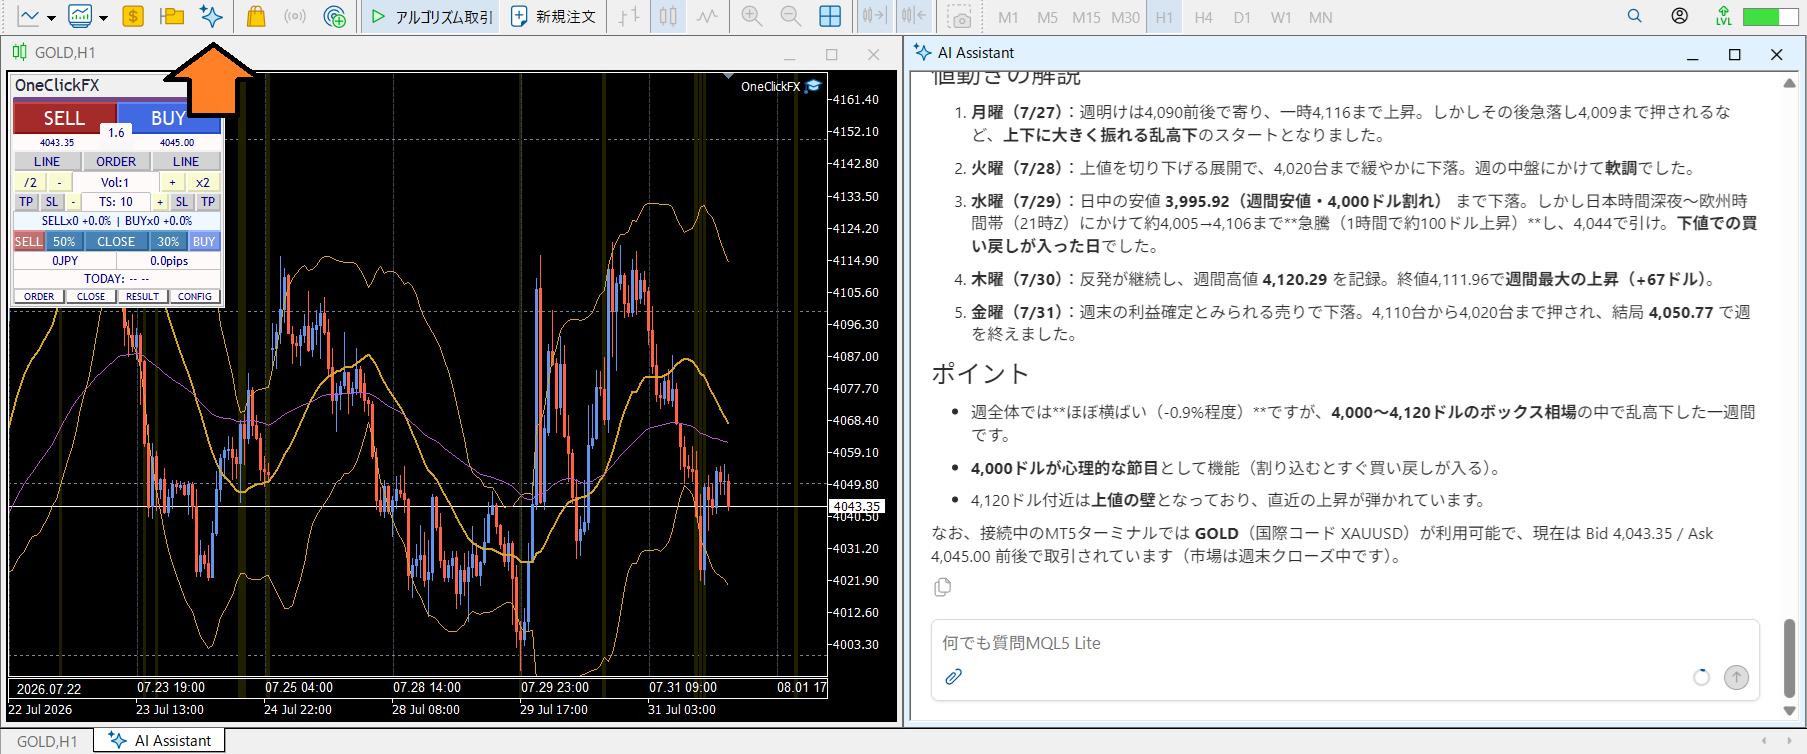
2. Configure the AI Assistant
Please perform one of the following according to how you intend to use the AI Assistant.There is no need to load both.

Method A: Use from the Analysis Menu
Instruct the AI Assistant as follows.
Apply https://license.ioiv.net/ai/menu.txt
menu.txtis a simple prompt to operate the AI Assistant via a menu format. It also includes product information for AI_Objects_rcm, so applying it enables features from the analysis menu.
This method is suitable for those who want to operate according to the menu.
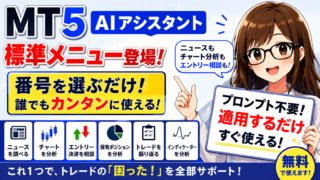
Method B: Use from Normal Conversation
If you are comfortable with AI Assistant operations, issue instructions as follows.
Refer https://license.ioiv.net/ai/kb/AI_Objects_rcm_AI_KB.md
This file is a knowledge file to help the AI Assistant understand the product information of AI_Objects_rcm.
After loading, you can request analysis or drawing directly in normal conversation, without going through the analysis menu.
Either method lets you use the AI_Objects_rcm features.If you want to operate via a menu, choose Method A; if you want to issue direct instructions in ordinary conversation, choose Method B.
Parameter Settings
AI_Objects_rcm has the following parameters.
InpPrefix: DefaultAIO_, Prefix for naming the drawn objects. Usually leave as default.InpCheckSeconds: Default3: Interval in seconds to check for drawing instructions from the AI assistant.
Unless there is a special reason, you can keep using the default settings.
Details of Features
AI_Objects_rcm is a tool to request analysis from the AI Assistant and visually confirm the results on the chart.
You do not need to specify lines or shapes in detail as you draw.Just ask the AI Assistant what you want to know, and it will draw according to the analysis results.
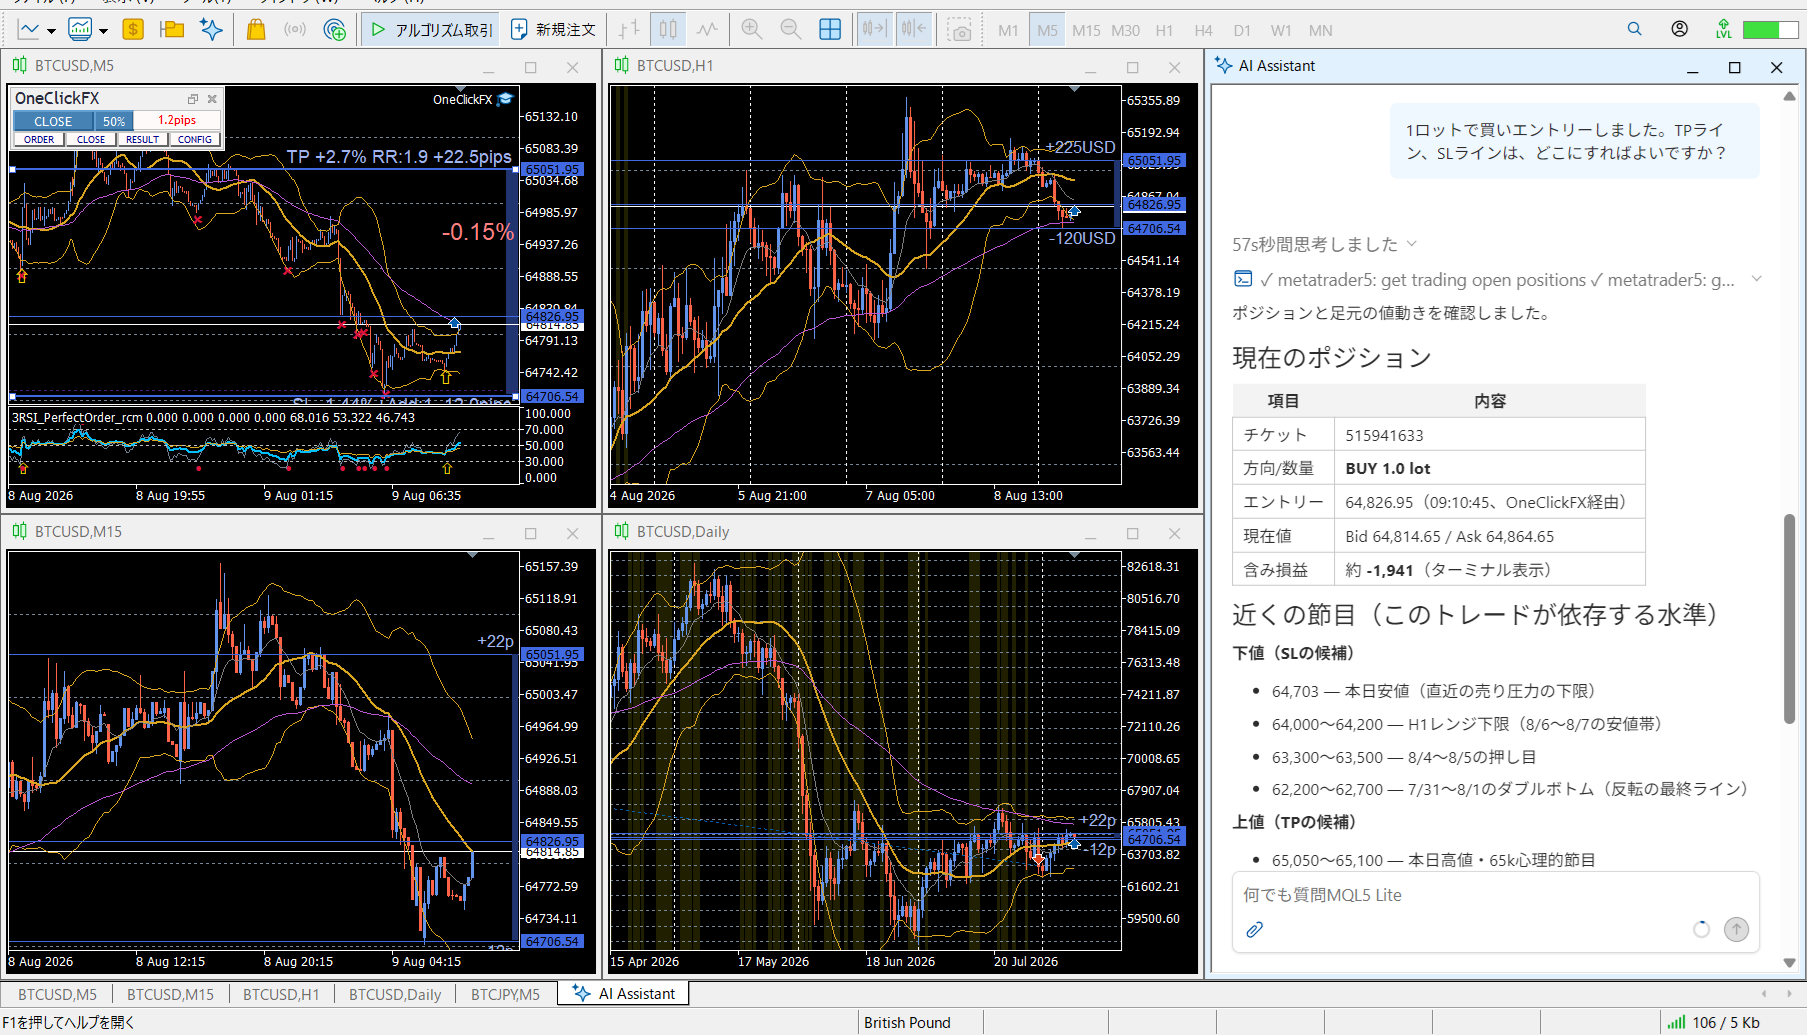
1. Have the Chart Analyzed
For example, instruct the AI Assistant as follows.
“Please analyze this chart.”
The AI Assistant analyzes the chart and draws trendlines and key price levels accordingly.
Instead of confirming the analysis results in prose alone, you can verify them as lines and shapes on the chart.
2. Check Fibonacci Reversal Points
For example, ask:
“Please tell me the Fibonacci reversal points.”
The AI Assistant performs Fibonacci-based analysis and draws reversal candidate price levels on the chart.
You do not need to specify the method of Fibonacci drawing in detail. Just convey the analysis you want.
3. Analyze Support and Resistance
For example, request:
“Analyze support and resistance.”
The AI Assistant analyzes potential support and resistance price levels and displays them with horizontal lines, etc.
You can compare the analysis with actual price movements on the chart.
4. Confirm Trend and Range
You can also request:
- “Analyze the current trend.”
- “Check the most recent high and low.”
- “Display the current range and plausible bounds.”
According to the analysis, trend lines, horizontal lines, rectangles, etc. will be drawn.
You can convey what you want analyzed rather than specifying each object one by one.
5. Ask Additional Questions While Viewing Drawings
You can further ask questions or give instructions about the drawn elements.
Examples of how you can use it:
- “What does this line indicate?”
- “Show other reversal candidates as well.”
- “Re-analyze based on the most recent high and low.”
- “Add explanations to important price levels.”
You can continue the conversation with the AI Assistant while reviewing the analysis and request additional drawings.
6. Menu Operations and Normal Conversation
There are two ways to use AI_Objects_rcm.
Using the Analysis Menu
menu.txtapplies a menu format to operate the AI Assistant. Suitable for those who want to proceed with analysis according to the menu.
Using Normal Conversation
AI_Objects_rcm_AI_KB.mdrefer to this to have the AI assistant understand product information. Those comfortable with operations can convey the analysis content freely.
In either case, basically you only need to convey what you want to analyze.
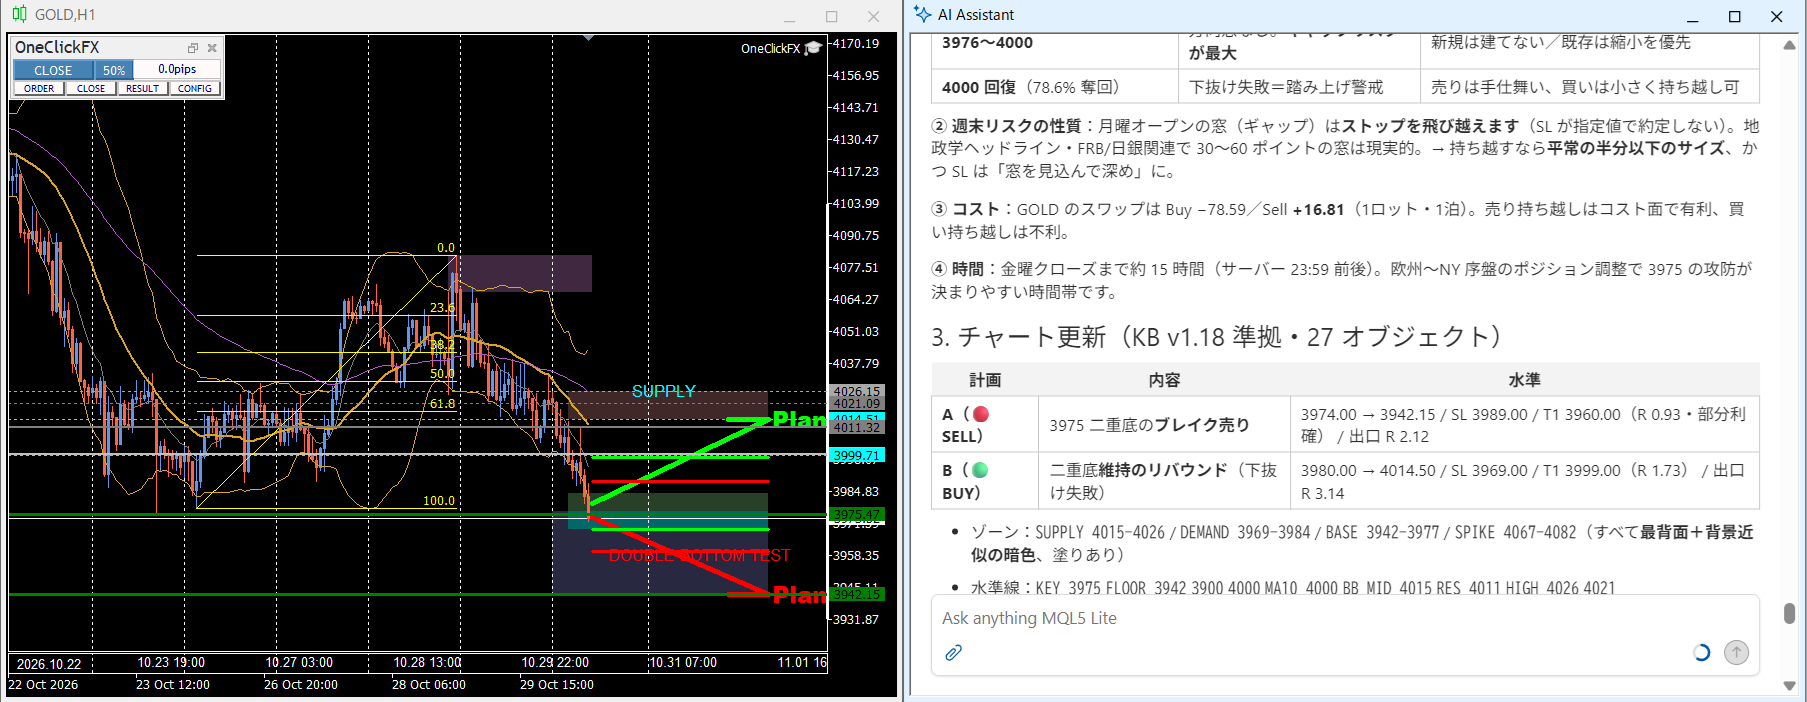
Display Trading Plans (Plan Arrows)
When you request analysis, trading scenarios (plans) are displayed as arrows. A single plan consists of the following elements:
- Main Line: The main body of the arrow from the entry point to the exit point.
- Exit Line: A short horizontal line at the exit point (arrow tip).
- Interim Settlement (T1, T2): Price levels where you may exit along the way, displayed as needed.
- Stop Line: The stop-loss level.
- Plan Name: A label displayed beside the exit point (e.g., Plan A).
Up to five plans (A–E) can be displayed simultaneously. The final exit target is at the same position as the exit line, so no extra horizontal line is shown for the target value. To keep a clean look, the main line, exit line, interim settlements (T1, T2), and stop line are grouped into five lines. Interims can be increased or decreased as needed.
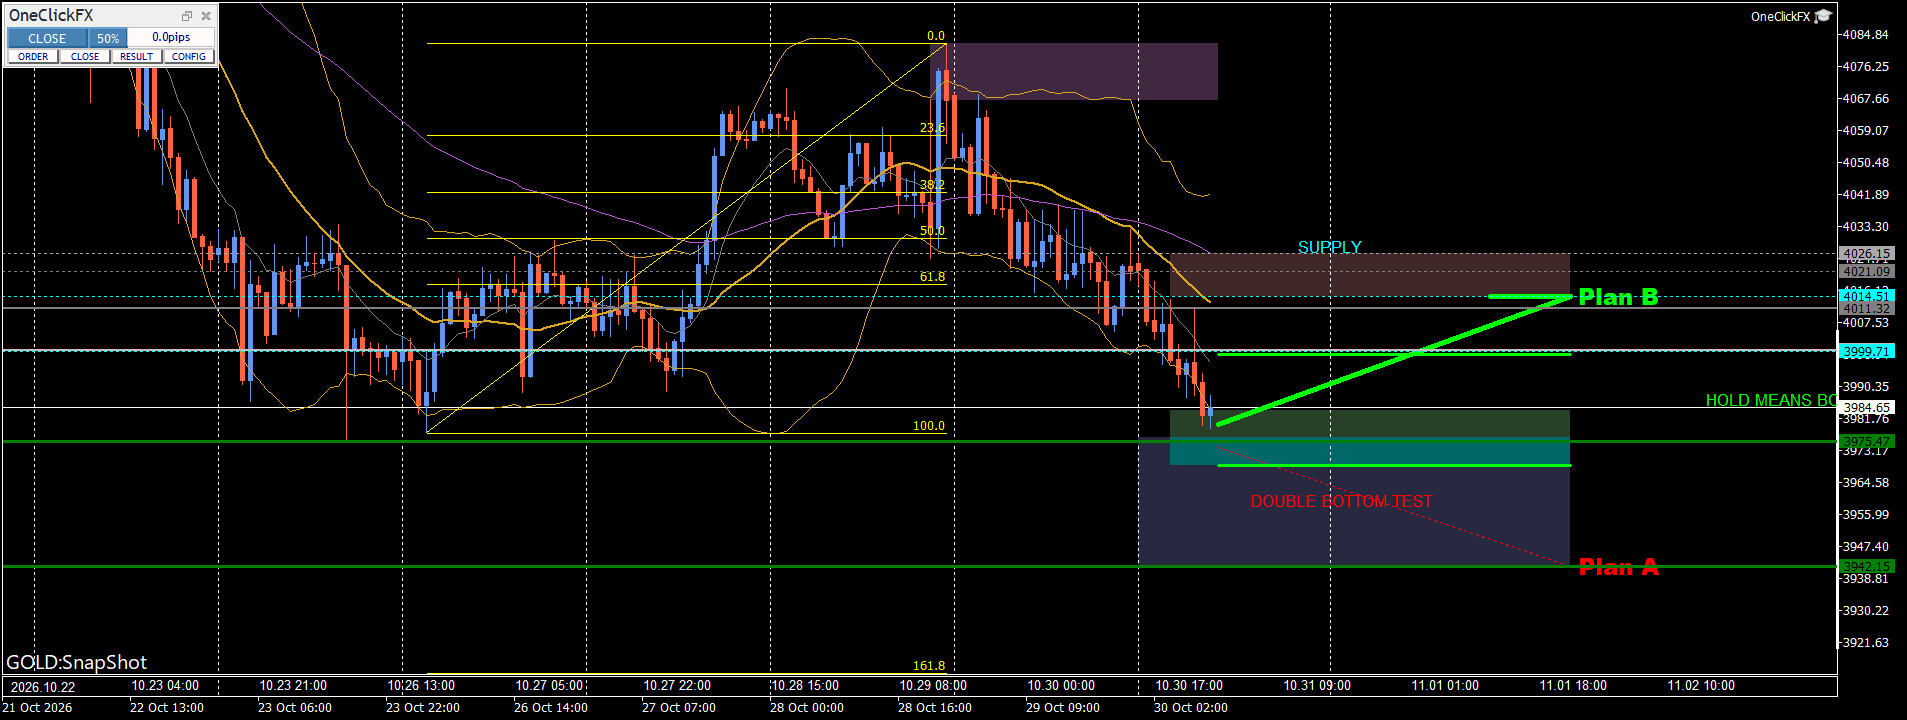
Open/Close Plans (Click Operation)
When multiple plans are displayed at once, lines can overlap, so plans toggle between two states for clarity.
- Inactive: The main line is a thin dotted line, showing only the exit line and plan name. Interim settlements and the stop line are hidden.
- Active: The main line and exit line are solid and prominent, and interim settlements (T1, T2) and the stop line are shown.
Clicking either the main line or the plan name toggles between active and inactive. Clicking again returns to the previous state.
The color, thickness, and style of the lines are rendered as specified by the AI Assistant. Thin dotted lines are used when inactive, so the main line may appear thinner when not active. Making only the plans you want active improves readability.
Objects That Can Be Displayed
AI_Objects_rcm supports the following objects.
- Horizontal lines: Display of support/resistance and key price levels
- Vertical lines: Markers for specific times or positions
- Trend lines: Tracking highs and lows and confirming trends
- Fibonacci Retracement: Confirming pullbacks and reversal candidate price levels
- Rectangles: Display of ranges or notable price bands. Supports filling
- Text: Display explanations of analysis content or price levels
The actual objects drawn depend on instructions to the AI Assistant and the analysis content.
Notes
- This tool is for MT5 only. It is not available on MT4.
- To draw, you must apply AI_Objects_rcm to the target chart.
- Settings on the AI Assistant side are also required. If using the menu format, use
menu.txt; if using normal conversation, useAI_Objects_rcm_AI_KB.md. - The drawn content is based on the AI Assistant’s analysis. Displayed lines and reversal points are analytical candidates and do not guarantee future price movements or profits.
- This tool is designed for chart drawing and does not automatically place orders or execute trades.
- Objects drawn on the chart may remain after closing the chart or removing the indicator. Delete unnecessary objects as needed.
Troubleshooting & Tips
If nothing is drawn
Please check the following items.
- Is AI_Objects_rcm applied to the target chart?
- Is the AI Assistant configured properly?
- Have you issued instructions to request analysis or drawing from the AI Assistant?
- Are MT5 charts and indicators functioning normally?
If the AI Assistant does not understand the function
Please check the settings according to how you intend to use it.
- If using from the menu:
Apply https://license.ioiv.net/ai/menu.txt - If using in normal conversation:
Refer https://license.ioiv.net/ai/kb/AI_Objects_rcm_AI_KB.md
If needed, re-run the applicable settings.
When in Trouble
If it is not functioning properly, behaving oddly, or stopping soon, please first check here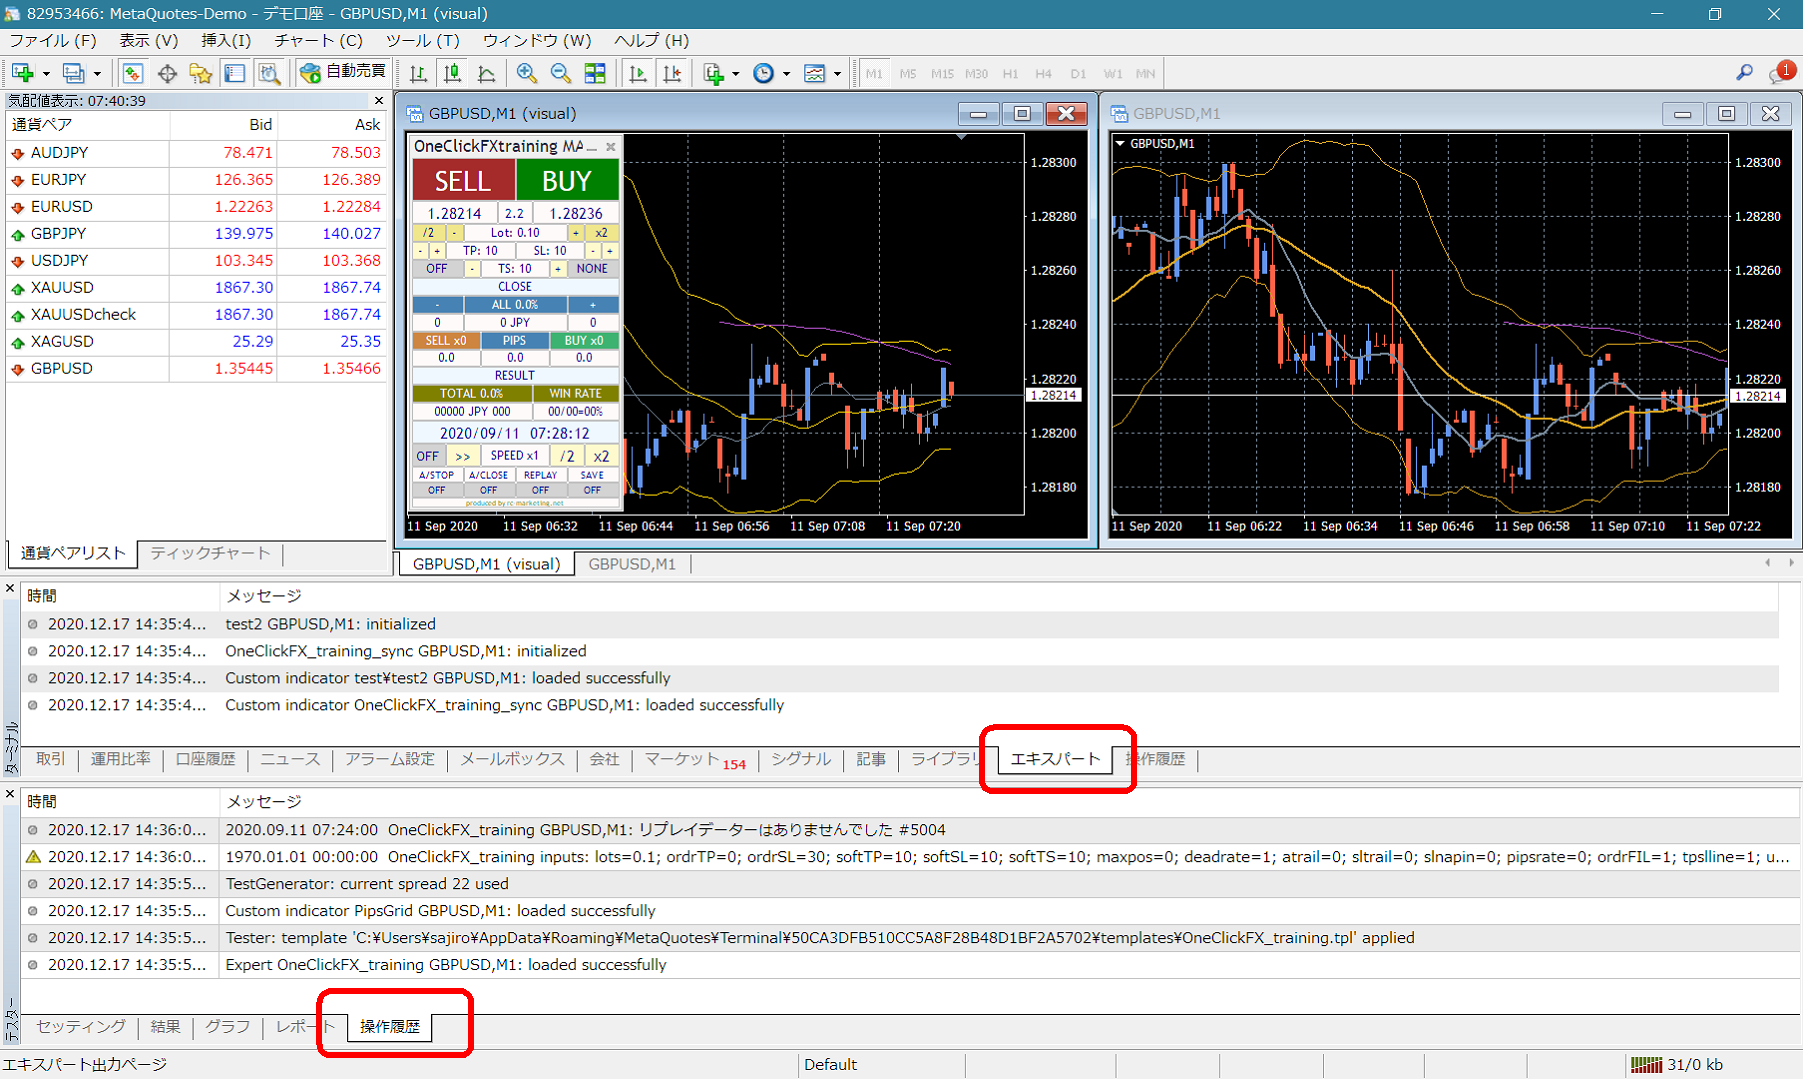 If you see error messages in the terminal’s operation history, please let us know, as that will help us respond more smoothly. Your cooperation is appreciated.
Support / Assistant
For some products, a convenient feature is included that automatically collects information with the press of a button during trouble. Press the “SA” button to collect information and open the folder. Also, you can double-click the Script’s “OneClickSA” to open the folder in the same way.
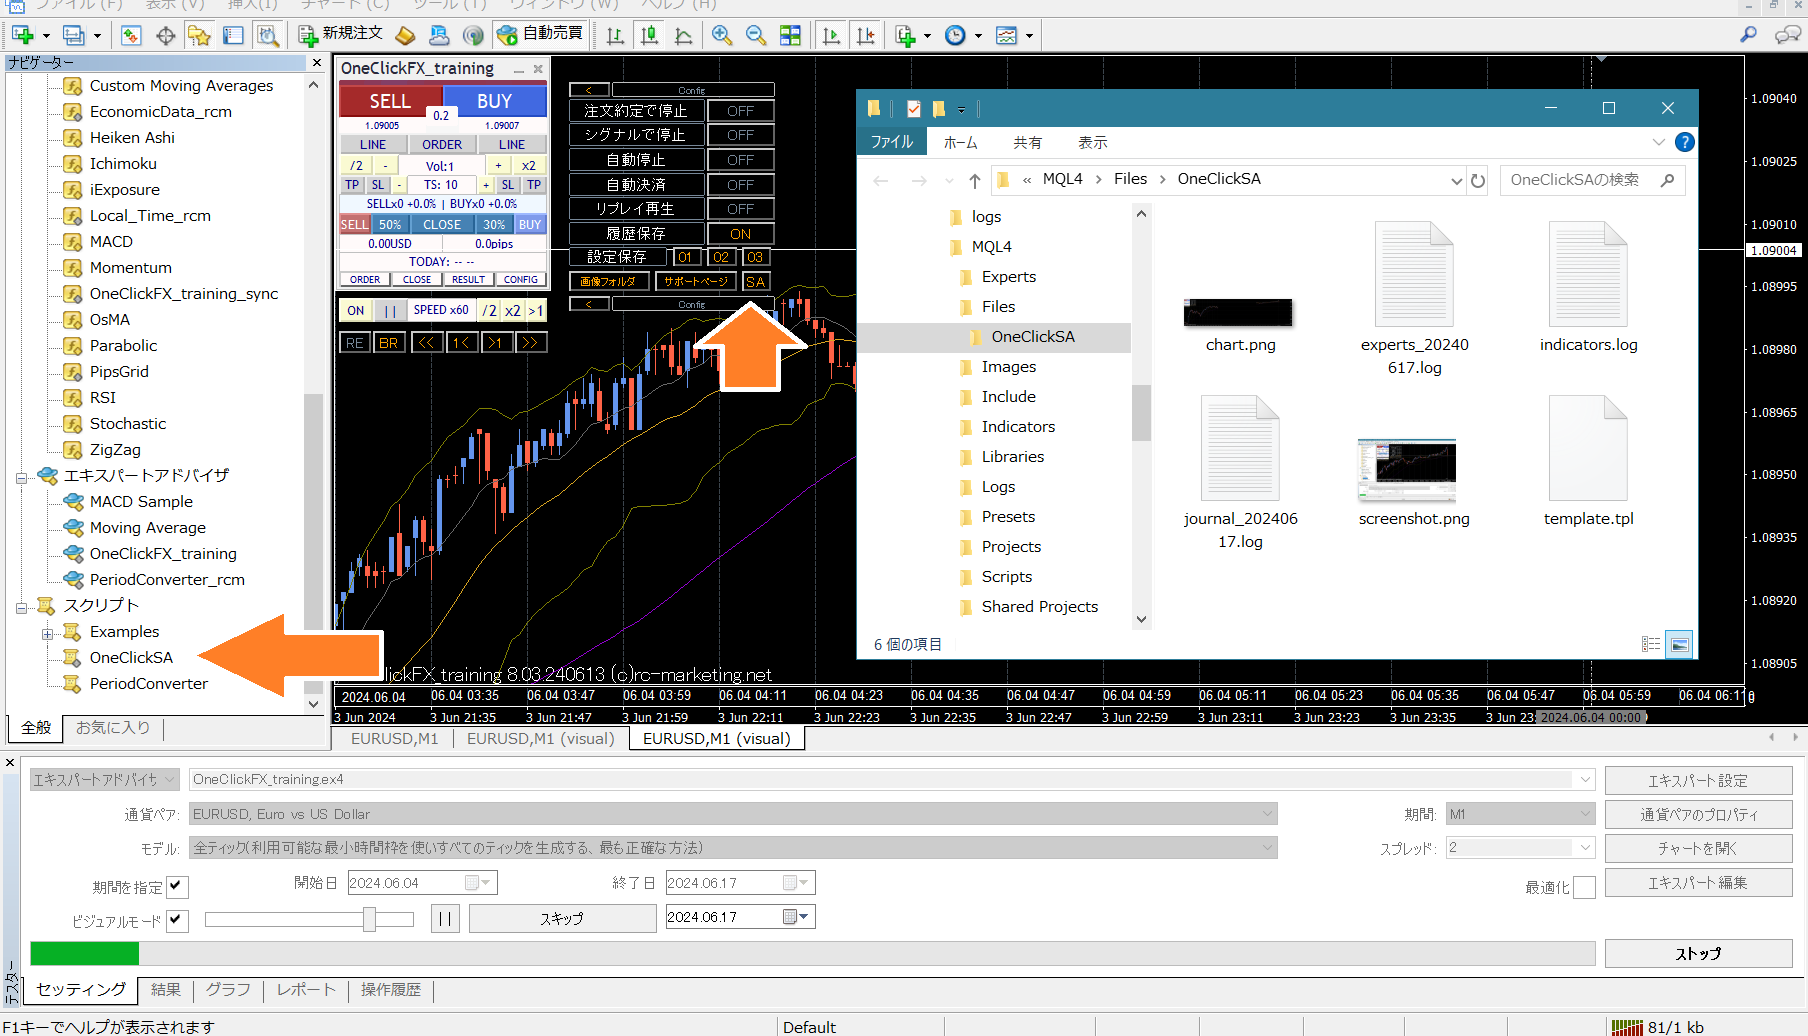 Please attach the generated files when sending.