
Tokyo Stock Exchange Prime Macro & Industry Weekly Week 3 of October
TSE Prime Macro & Sector Weekly
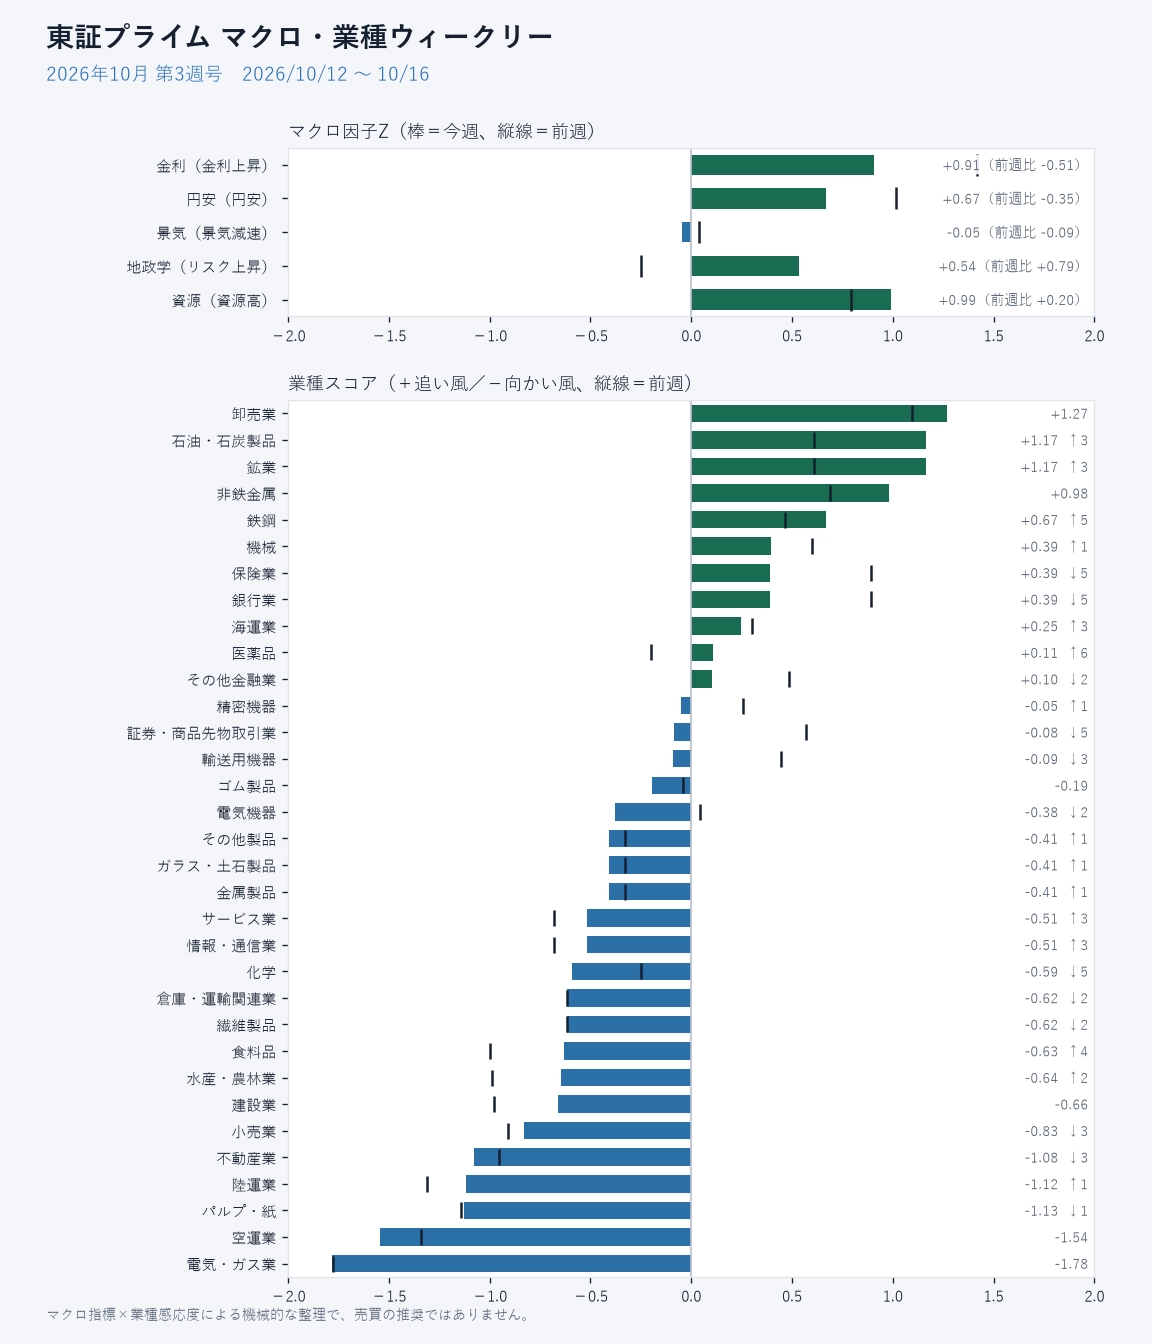
Macro Factors This WeekAs of October 16
+ Meaning: Interest rate up / Yen weakness / Economy expansion / Geopolitics risk up / Resources price up. 0 is the 1-year moving-average.
※ Some factors changed from the previous week (Interest rate +1.48 → +1.42, Economy -0.07 → +0.04, Resources +0.47 → +0.79). After preparing last week's issue, later-published indicators (monthly indicators or U.S. indicators released 1–2 business days late) were incorporated, and the previous week's values were recalculated. The week-over-week comparison and the “previous week” ranks in the sector rankings are also recalculated values.
This Week’s Summary
The most moved factor this week wasGeopoliticschanging from -0.25 to +0.54 (+0.79), indicating increasing risk.
The economy hasn’t changed much from last week (change less than 0.10).
Large movers include Interest Rate +0.91 (rate increase) and Resources +0.99 (resource price rise).
Leading sectors by scoreWholesale, Oil & Coal Products, Mining, and the lower ones are Electric & Gas, Air Transport, Pulp & Paper.
Sectors that moved three or more positions: Pharmaceuticals 16 → 10 (mainly geopolitics), Steel 10 → 5 (mainly geopolitics), Food 29 → 25 (mainly geopolitics), Insurance 2 → 7 (mainly rates), Banking 2 → 7 (mainly rates), Securities & Commodity Futures 8 → 13 (mainly geopolitics).
Outliers across a typical week (1σ or more) include VIX +34.70% (+2.0σ), U.S. 10-year real yield (TIPS) -0.13 pt (-1.7σ), U.S. yield curve (10y-2y) -0.09 pt (-1.6σ).
Industry Score Rankings33 Sectors
| Rank | Sector | Number of Stocks | Score | −2 0 +2 | Previous Week | Change | Main Driver |
|---|---|---|---|---|---|---|---|
| 1 | Wholesale Trade | 120 | +1.27 | 1st | → | Geopolitics↑ | |
| 2 | Oil & Coal Products | 5 | +1.17 | 5th | ↑3 | Geopolitics↑ | |
| 2 | Mining | 4 | +1.17 | 5th | ↑3 | Geopolitics↑ | |
| 4 | Nonferrous Metals | 20 | +0.98 | 4th | → | Geopolitics↑ | |
| 5 | Iron & Steel | 20 | +0.67 | 10th | ↑5 | Geopolitics↑ | |
| 6 | Machinery | 111 | +0.39 | 7th | ↑1 | Yen Weakness↓ | |
| 7 | Insurance | 11 | +0.39 | 2nd | ↓5 | Interest Rates↓ | |
| 7 | Banking | 69 | +0.39 | 2nd | ↓5 | Interest Rates↓ | |
| 9 | Shipping | 5 | +0.25 | 12th | ↑3 | Geopolitics↑ | |
| 10 | Pharmaceuticals | 31 | +0.11 | 16th | ↑6 | Geopolitics↑ | |
| 11 | Other Financials | 21 | +0.10 | 9th | ↓2 | Geopolitics↓ | |
| 12 | Precision Equipment | 27 | -0.05 | 13th | ↑1 | Geopolitics↓ | |
| 13 | Securities & Commodity Futures | 19 | -0.08 | 8th | ↓5 | Geopolitics↓ | |
| 14 | Transportation Equipment | 38 | -0.09 | 11th | ↓3 | Geopolitics↓ | |
| 15 | Rubber Products | 10 | -0.19 | 15th | → | Yen Weakness↓ | |
| 16 | Electrical Equipment | 123 | -0.38 | 14th | ↓2 | Geopolitics↓ | |
| 17 | Other Products | 37 | -0.41 | 18th | ↑1 | Interest Rates↑ | |
| 17 | Glass & Stone Products | 22 | -0.41 | 18th | ↑1 | Interest Rates↑ | |
| 17 | Metal Products | 26 | -0.41 | 18th | ↑1 | Interest Rates↑ | |
| 20 | Services | 143 | -0.51 | 23rd | ↑3 | Interest Rates↑ | |
| 20 | Information & Communications | 164 | -0.51 | 23rd | ↑3 | Interest Rates↑ | |
| 22 | Chemicals | 115 | -0.59 | 17th | ↓5 | Geopolitics↓ | |
| 23 | Warehousing & Transportation Related | 9 | -0.62 | 21st | ↓2 | Interest Rates↑ | |
| 23 | Textiles | 17 | -0.62 | 21st | ↓2 | Interest Rates↑ | |
| 25 | Food Products | 68 | -0.63 | 29th | ↑4 | Geopolitics↑ | |
| 26 | Fisheries & Agriculture | 6 | -0.64 | 28th | ↑2 | Geopolitics↑ | |
| 27 | Construction | 70 | -0.66 | 27th | → | Geopolitics↑ | |
| 28 | Retail | 129 | -0.83 | 25th | ↓3 | Interest Rates↑ | |
| 29 | Real Estate | 48 | -1.08 | 26th | ↓3 | Interest Rates↑ | |
| 30 | Transportation | 36 | -1.12 | 31st | ↑1 | Interest Rates↑ | |
| 31 | Pulp & Paper | 10 | -1.13 | 30th | ↓1 | Interest Rates↑ | |
| 32 | Airline | 2 | -1.54 | 32nd | → | Geopolitics↓ | |
| 33 | Electricity & Gas | 22 | -1.78 | 33rd | → | Interest Rates↑ |
Scores range from −2 to +2. A plus indicates a tailwind in the current market; minus indicates a headwind. The number of stocks is the Prime-stock count in that sector. The top 5 and bottom 5 are highlighted. Upward arrows in the main drivers indicate an increased tailwind; downward arrows indicate a decrease.
Industries Moving This WeekDaily series, in order of largest changes
| Series | Value | Weekly Change | Compared to Normal | Influential Factors | Date of Value |
|---|---|---|---|---|---|
| VIX | 19.99 | +34.70% | +2.0σ | Geopolitics + | 10/16 |
| U.S. 10-Year Real Yield (TIPS) | 2.78 | -0.13pt | -1.7σ | Interest Rates − | 10/15 |
| U.S. Yield Curve (10y-2y) | 0.35 | -0.09pt | -1.6σ | Interest Rates − | 10/16 |
| WTI Crude Oil | 99.04 | +7.83% | +1.1σ | Resources + | 10/16 |
| U.S. High-Yield Spread | 3.23 | +0.12pt | +1.1σ | Economy − | 10/15 |
| USD/JPY | 157.99 | -0.05% | Yen Weakness − | 10/16 |
Normal-week comparisons show how a week's change compares to the typical week over the last year. Values with a deviation of more than 1σ are bolded. For interest rates and spreads, changes are shown in points (pt = percentage points). U.S. series have dates noted because they are released 1–2 business days late.
Monthly SeriesMost Recent Published Values
| Series | Value | MoM Change | Influential Factor | Month |
|---|---|---|---|---|
| Japan Long-Term Rate (10-year) | 3.05 | +0.11 | Interest Rates + | September 2026 |
| Real Effective Exchange Rate (BIS) | 65.04 | -0.38 | July 2026 | |
| OECD Leading Economic Indicator, Japan | 100.35 | +0.02 | September 2026 | |
| OECD Leading Economic Indicator, U.S. | 101.00 | +0.05 | September 2026 | |
| OECD Leading Economic Indicator, China | 97.41 | -0.23 | September 2026 | |
| U.S. Industrial Production (YoY) | 2.25 | +0.63 | September 2026 | |
| Geopolitics Risk Index (GPR) | 146.21 | +20.59 | September 2026 | |
| Copper (LME) | 13,542.82 | -9.22 | July 2026 | |
| U.S. CPI (YoY) | 3.72 | +0.36 | September 2026 |
Monthly series take 1–3 months to publish. Weekly factor movements primarily come from daily series.
Factor TrendsLast 6 weeks, as of Friday each week
| Factor | 09/11 | 09/18 | 09/25 | 10/02 | 10/09 | 10/16 |
|---|---|---|---|---|---|---|
| Interest Rates | +0.63 | +0.57 | +1.09 | +1.46 | +1.42 | +0.91 |
| Yen Weakness | -0.07 | +0.24 | +0.64 | +0.76 | +1.01 | +0.67 |
| Economy | +0.54 | +0.52 | +0.19 | +0.05 | +0.04 | -0.05 |
| Geopolitics | -0.02 | -0.22 | -0.17 | -0.11 | -0.25 | +0.54 |
| Resources | +1.30 | +1.25 | +1.05 | +0.92 | +0.79 | +0.99 |