
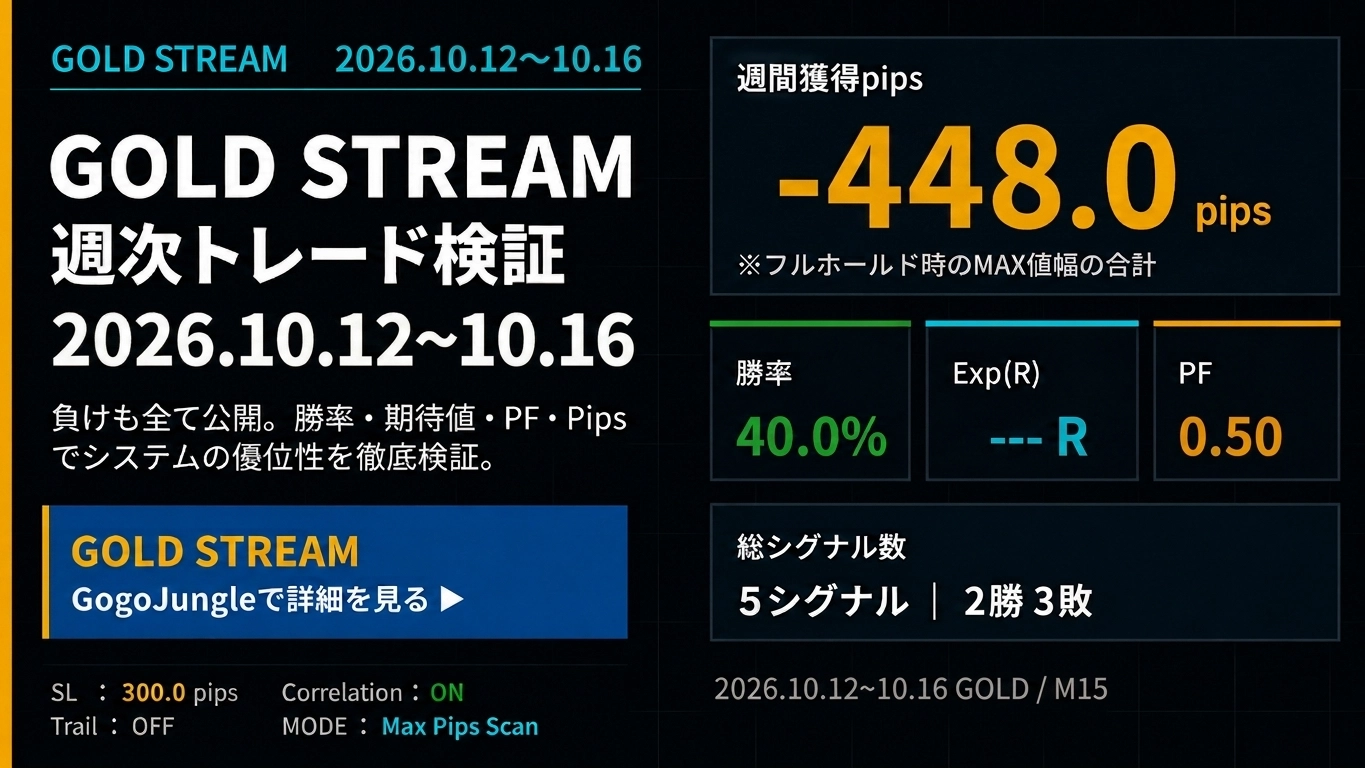
-448pips【Weekly Trade Verification & Distribution History】GOLD Day Trade Focused "GOLD STREAMv2" 2026.10.12~10.16
-448pips【Weekly Trade Verification & Delivery History】
GOLD Day Trading Specialty "GOLD STREAM v2" 2026.10.12~10.16
Review GOLD's price movement, strength, and correlations, and verify signal accuracy, range, and expectancy weekly. We evaluate not only win rate but also PF, Exp(R), and 5-day ADR to assess this trading environment.
① GOLD Market Analysis
1. Price Movement
The GOLD (XAU/USD) market for the week of October 12–16, 2026 showed a sharp decline in the early week within a high-price zone, but from midweek buyers quickly returned, resulting in a volatile up-and-down range without a sustained one-way trend.
- Early-week decline wave:As selling momentum grew due to resistance near the high, the price briefly tested lower levels.
- Midweek V-shaped rebound:After reaching near the lower boundary of support, strong buying flowed in and the price rapidly recovered to previous highs.
- End-of-week range trading:After the initial rally, buying and selling again battled in the high-price area, ending the week with choppy, directionless price action.
5-day ADR:735pipswas recorded, indicating a highly challenging environment where a trader could easily be caught in a rapid reversal after entry.
2. Supply-Demand & Investment Factors
In terms of macro financial conditions and physical supply-demand, U.S. inflation vigilance, interest rate expectations, and safe-haven demand offset each other.
- U.S. long-term rates and dollar index:Short-term moves in interest rates and the dollar, driven by U.S. economic data, directly added noise to price formation for gold.
- Central banks & physical demand:Physical demand (jewelry, etc.) was restrained due to elevated price caution, but central banks increasing gold reserves provided solid support at lower prices.
- Geopolitical risk & safe-haven buying:Hedge demand surged on pulls backs at each dip, supporting the V-shaped recoveries from sharp declines.
Strengths and weaknesses shifted in seconds, making short-term directional forecasting difficult.
3. Investment Trends
In terms of funds flow, short-term speculative funds frequently rotated positions.
- Futures positioning shortening:Funds chasing trends shortened their holding periods, causing profit-taking and stop-loss cascades to trigger rapid changes.
- ETF funds flow:Mid- to long-term funds remained stable, but short-term ETF inflows/outflows were volatile with price moves.
- Day-trading crowd collisions:With a wide 735pips range, breakout and pullback traders clashed, leading to frequent false breakpoints.
For trend followers, it was a capital flow environment where sudden reversals after signals required caution.
4. Overall Evaluation
This week's GOLD market was a tough environment described as“highly volatile yet lacking a persistent trend, a tricky up-and-down market.”Although the 5-day ADR of 735pips indicated ample movement, follow-through after breakouts was short-lived and reversals occurred frequently. Even following technical signals tended to suffer from rapid reversals, making it a very tough trading environment overall.
There was ample movement with a 5-day ADR of 735 pips, but post-breakout follow-through was short and reversals occurred frequently. It can be summarized as a very tough trading environment where prices could reverse abruptly even when signals were aligned with technical indicators.
⑤ SILVER / COPPER Market
SILVER
SILVER market: Silver tracked GOLD's intense volatility, dropping and then sharply rebounding, resulting in a highly volatile trajectory. Industrial demand remained solid, but gold-dollar moves driven by interest rates led to wide price ranges with no clear direction.
COPPER
COPPER market: Copper prices were influenced by global economic indicators and China's demand trends, with a back-and-forth battle. Supply constraints supported the bottom, but the dollar staying high and uncertain demand recovery kept upside limited, leading to a range-bound, directionless movement.
② GOLD STREAM v2 Weekly Trade Verification
Weekly verification results
③ GOLD STREAM v2 Delivery History
Weekly signal delivery history

④ Weekly Verification AI Evaluation
This time5-day ADR 735pips offered ample range, yet there were many abrupt reversals and false signals. We conduct a thorough verification and evaluation based on signal results, correlation filter effects, and loss management with objective data.
■ Signal Judgement and Entry Accuracy
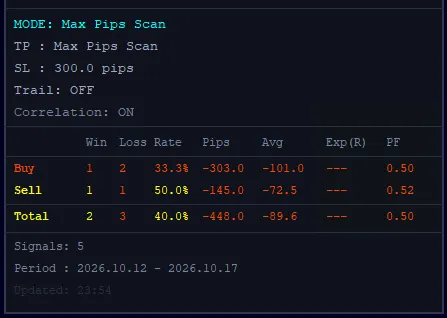
According to the verification panel (2026.10.12 - 2026.10.17), the number of active signals triggered was a total of5 signalsand the result was2 wins, 3 losses; win rate 40.0%[cite: 28, 29]. Breakdown: Buy signals 1 win, 2 losses (33.3%); Sell signals 1 win, 1 loss (50.0%).
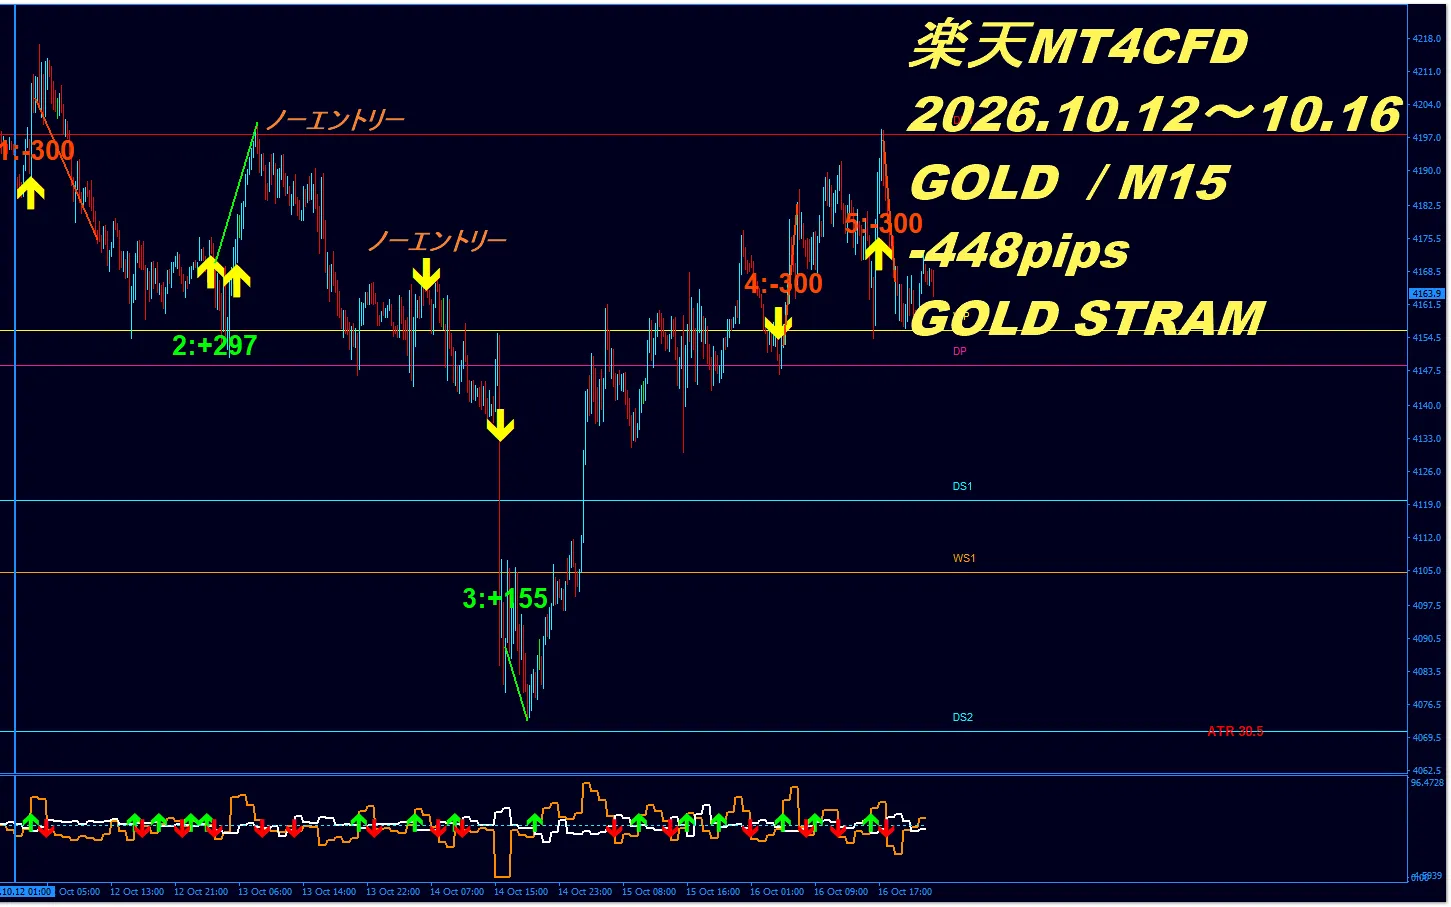
Looking at individual results: the first Buy (-300pips), the fourth Sell (-300pips), and the fifth Buy (-300pips) were hard losses hit by SL, while the second Buy yielded +297pips and the third Sell yielded +155pips. Total P/L range was-448.0pips(average -89.6pips).
■ Evaluation from Win Rate, PF, and Exp(R)
This week's metrics showWin rate 40.0% · PF 0.50 · Exp(R) --- (negative territory)indicating a challenging week.
Profit Factor (PF)0.50means losses outweighed gains in the winning trades [cite: 28, 29]. With a fixed SL (300.0pips), risk per loss is tightly controlled, but rapid V-shaped reversals after trends prevented profits from expanding, resulting in losses leading the performance.
■ Strength/Correlation Analysis Evaluation
In markets where correlations and waveforms distort in short timeframes, the correlation mismatch no-entry filter becomes more important.
Without this filter, reckless entries within a range could have widened losses. The filter helped minimize wasted trades and allowed risk to be bounded by rules, functioning as a protective measure for long-term operation.
■ MAX Pips Scan & SL
This chart isMODE: Max Pips Scan / Correlation: ON.
The displayed pips indicate the maximum value reached when the price action after signal generation is fully heldMAX value. Therefore, the numbers do not represent actual realized profits.
Also, the SL judgment is based on4-hour chart. It is not determined by short-term moves on the M15 chart.
■ GOLD Market Difficulty
★★★★★ 5 / 5
Despite ample movement with a 5-day ADR of 735pips, the structure had many deceiving moves with rapid reversals and V-shaped recoveries, making it extremely difficult and high-risk for both discretionary and systematic trading.
■ Evaluation of GOLD STREAM Weekly Trade Verification
★★☆☆☆ 2 / 5
Utilizing the correlation mismatch to suppress unnecessary losses and enforcing risk-limiting fixed SL, win rate remained 40.0% and total -448pips due to market abrupt changes. The system's defensive capability is evident, but since the overall P/L was negative, the rating is strictly 2 stars.
You can see defensive strength as a system, but since the money result was negative, we give a sober 2-star evaluation.
■ AI Overall Commentary
Even the best logic cannot avoid temporary drawdowns in volatile markets. The key is that in荒れ相場 like this, fixed SL and correlation filters prevented serious losses and protected the account equity.
As proven in past verifications, when GOLD returns to a normal trend, this tool can deliver explosive gains well over +1,000 pips. Because there is a reliable design to keep risk steady even in tough weeks, it enables a strong rebound in the next winning scenario.
Experience genuine professional trading by using "GOLD STREAM v2" with robust risk management to protect funds and win big in large trends.
Verification numerical evidence
Are you hesitating about GOLD entries?
“It’s rising, but I don’t know if I should enter now.”
“I can’t determine where to enter.”
“Price movement is too big; entry feels scary.”
In markets with large price swings like GOLD, it is important to have criteria to enter or skip, rather than chasing by feel alone, such aschecking win rate, PF, expectancy, strength, and correlationto make informed decisions.
GOLD STREAM v2 specializes in GOLD day trading and supports entry decisions by assessing market strength and correlation.
View GOLD STREAM v2 product page Ask a questionRelated Articles
If you want to learn more about trading mindset and GOLD trading, click here.
- 【Video】“GOLD STREAM Signal Post-Move Price Action | TRADE REVIEW (2026.8.10~9.04)”
- The One Reason Why Results Are Not Seen
- Why Trades End Up as “Chikachaka”
- 【Tool's True Performance Uncovered】GOLD STREAM Dedicated Win/Loss Analysis Tool Verification
- Conclusion: You can trade GOLD (XAU/USD) with domestic FX accounts.
The verification results and figures presented in this article are参考情報 based on historical market data and do not guarantee future profits or identical operating results.
The pips and profit/loss data shown are based on the maximum value range reached after entry signals (MAX value) and calculated using fixed stop-loss (SL). These are the MAX values for holding price action after signals and do not indicate actual realized profits or actual trading results.
Real profits and losses depend on entry/exit timing, spreads, slippage, trading fees, execution environment, position size, take-profit/stop-loss decisions, and market conditions. SL judgments are based on the 4-hour chart, and results may vary with actual trading conditions.
Additionally, due to differences in trading conditions and price feeds, actual prices, pips, profits/losses, and trade results may differ across brokers or trading platforms. Therefore, there may be discrepancies between published data and actual performance.
This data is a reference for evaluating the Signal advantage and market analysis accuracy of GOLD STREAM v2. Make final investment decisions based on your own financial situation, risk tolerance, and trading environment, and do so at your own risk.