

2026/10/10 Dollar-Yen, Gold, SP500, and Nikkei 225 environment

For behavioral verification, we prepare weekly videos of USDJPY price movements.
Note: The score signals and score lines shown in the video are only displayed on the future side (they are not displayed on the lower chart image).
USD/JPY
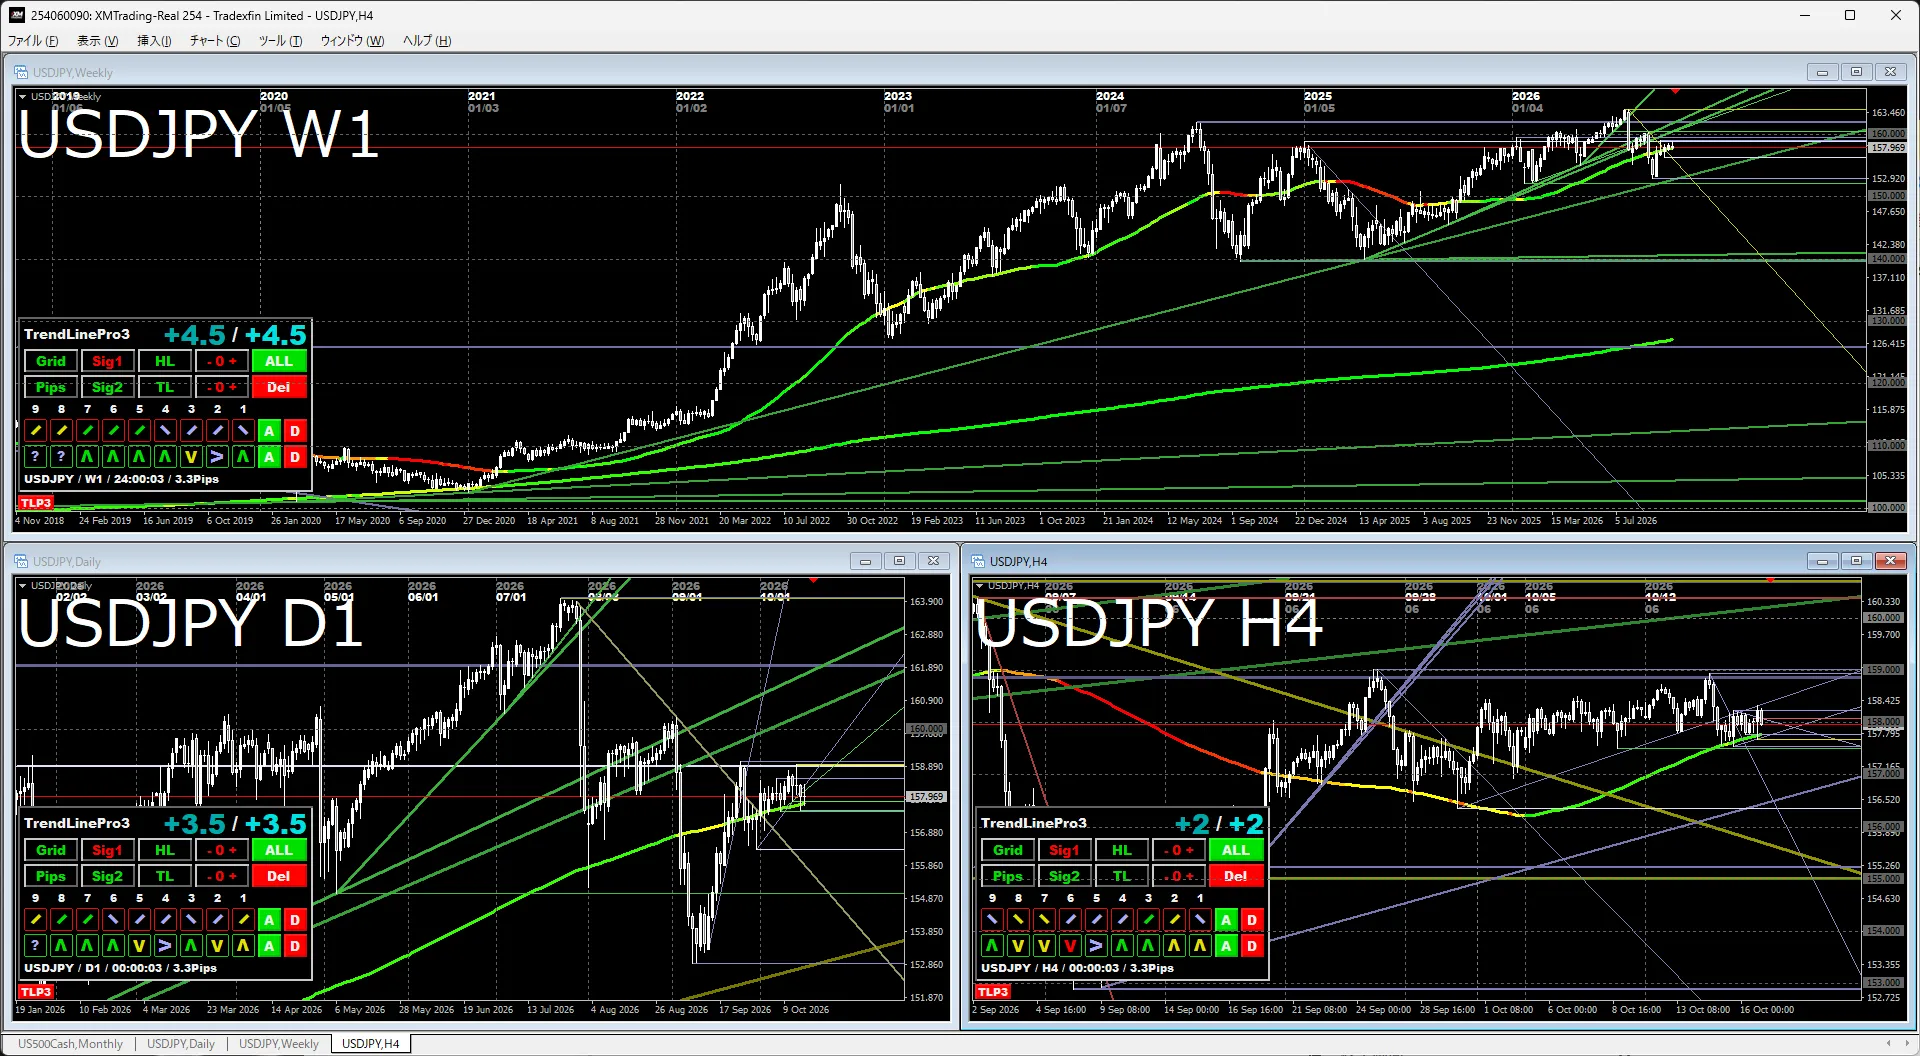
Daily / 4-hourThis week was an easy time to rise, but it failed to break 159 yen, sticking to the MA. If this continues, there will likely be a period of no clear direction until it breaks 159 or 156 in the near term.
Gold
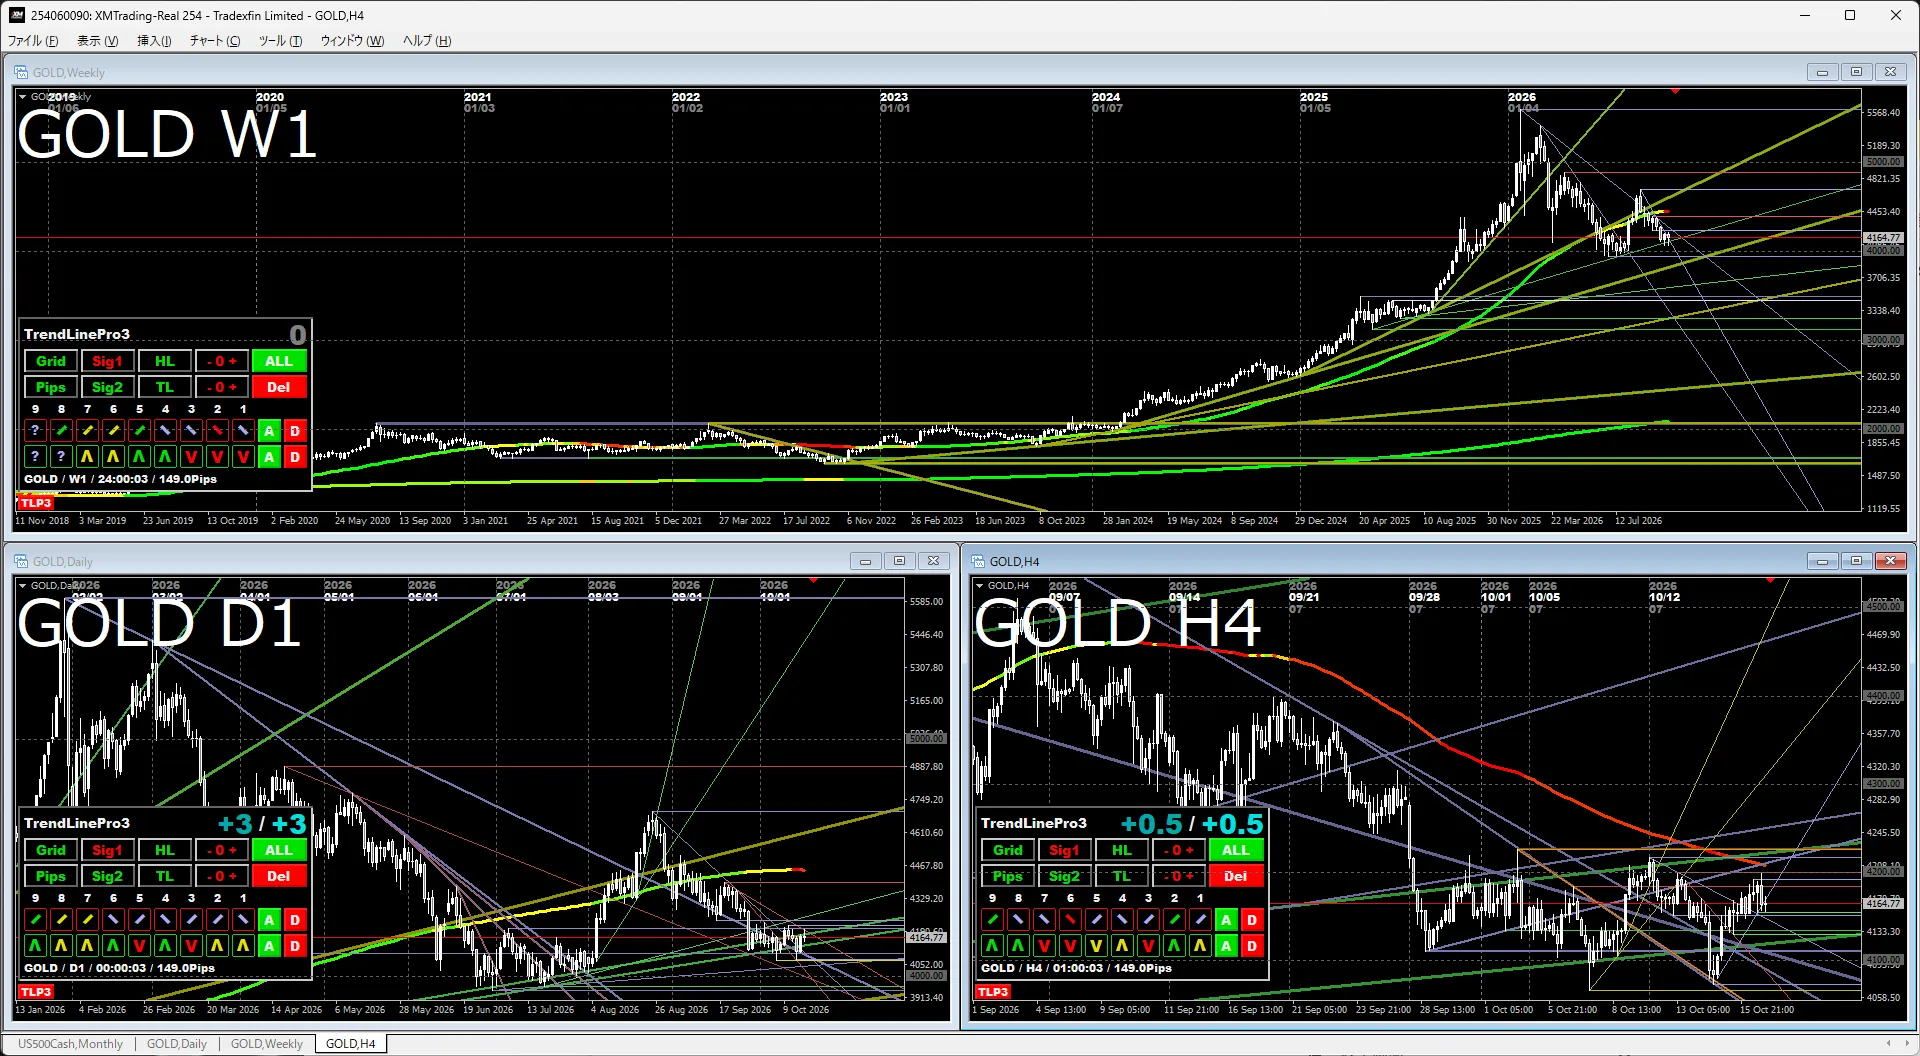
Daily / 4-hourIt seems unable to drop further and is somehow holding. The direction will likely settle depending on which way it breaks in the last two weeks of sideways movement. In a large uptrend with a small downtrend, most market participants are watching, so it tends to stay flat. It’s better to follow once the trend emerges.
S&P 500
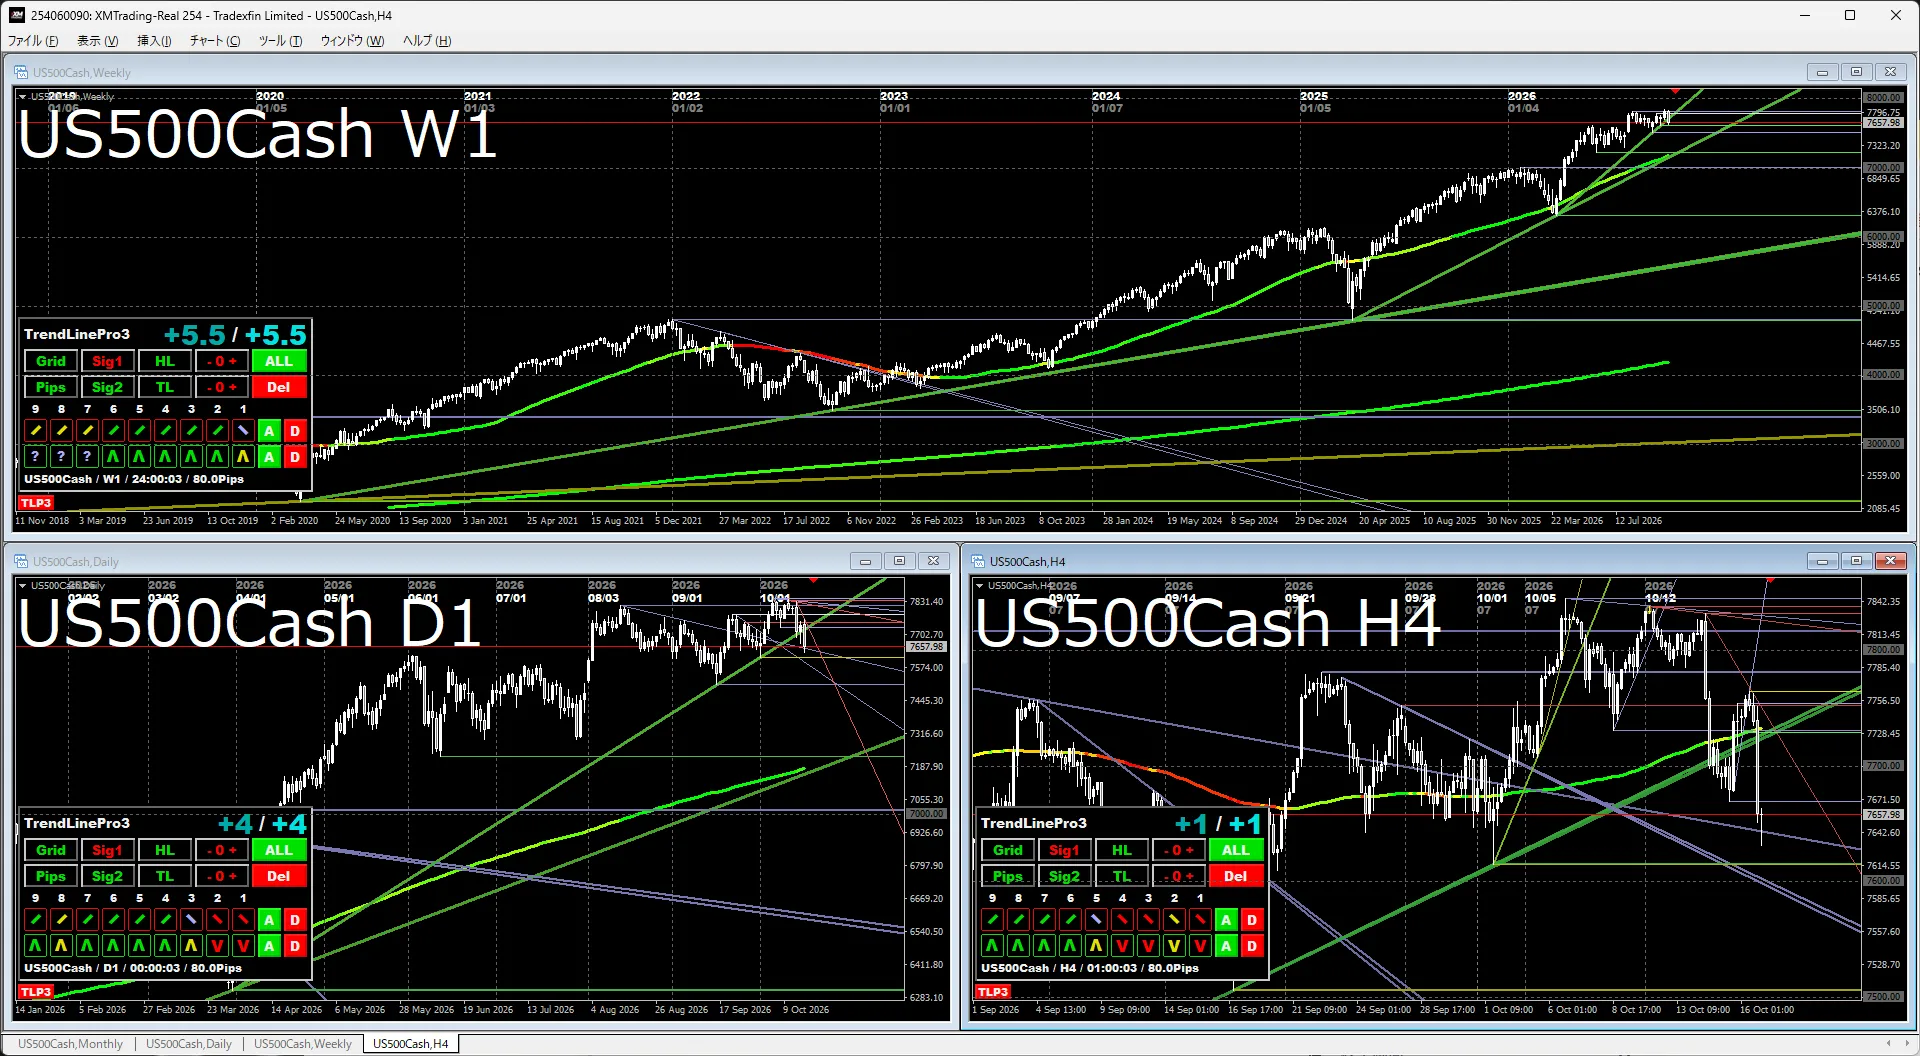
Daily / 4-hourFrom the recent high, a decline occurs; technically, breaking below 7600 would raise caution, but the verdict would be a reverse triangle, and unless a major news event causes a sharp drop, it is likely just a pullback and could end as a correction.
Nikkei 225
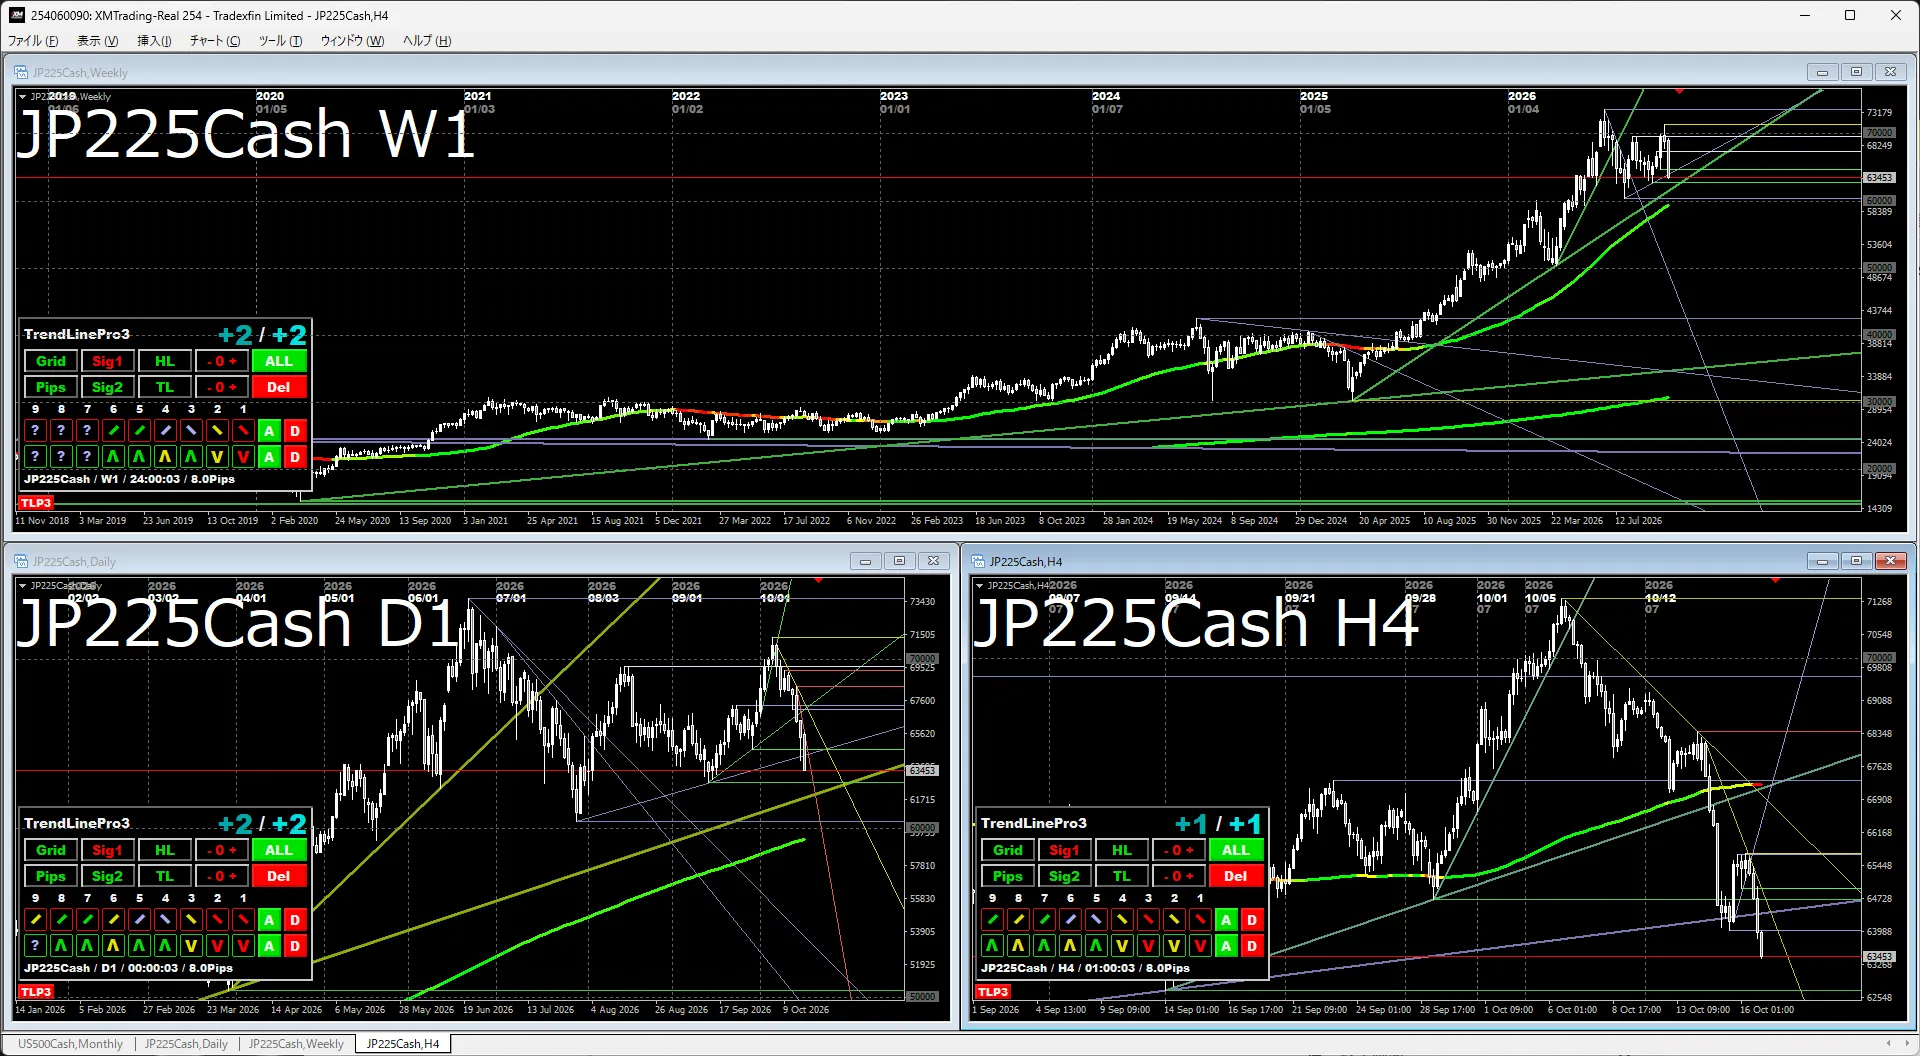
Daily / 4-hourBreaking above 70,000 raises the likelihood of new highs, but declines face resistance at the trendline, 60,000, and MA, making it easier for resistance to hold. Even if it breaks, the shape is likely a reverse triangle with a rebound expected. Unless major news arises soon, it is expected to end in a correction.
The indicators in the attached image use the indicators below.
If you are interested, please take a look.