

Turn GOLD's dropping price below the low into a selling opportunity. From the pair's BB expansion to protecting profits
“It seems like it might break below. But I don’t want to be knocked back right after I sell.”
While hesitating near the low, a large bearish candle runs. This time, to avoid being left behind, I want to use the expansion of the pair’s time frames that align with the target wave.
This time it’s GOLD on October 14, 2026. How to combine the break of the low with the expansion of the BB on the 1-hour x 15-minute pair to consider selling, and further, how to protect the extended profit.
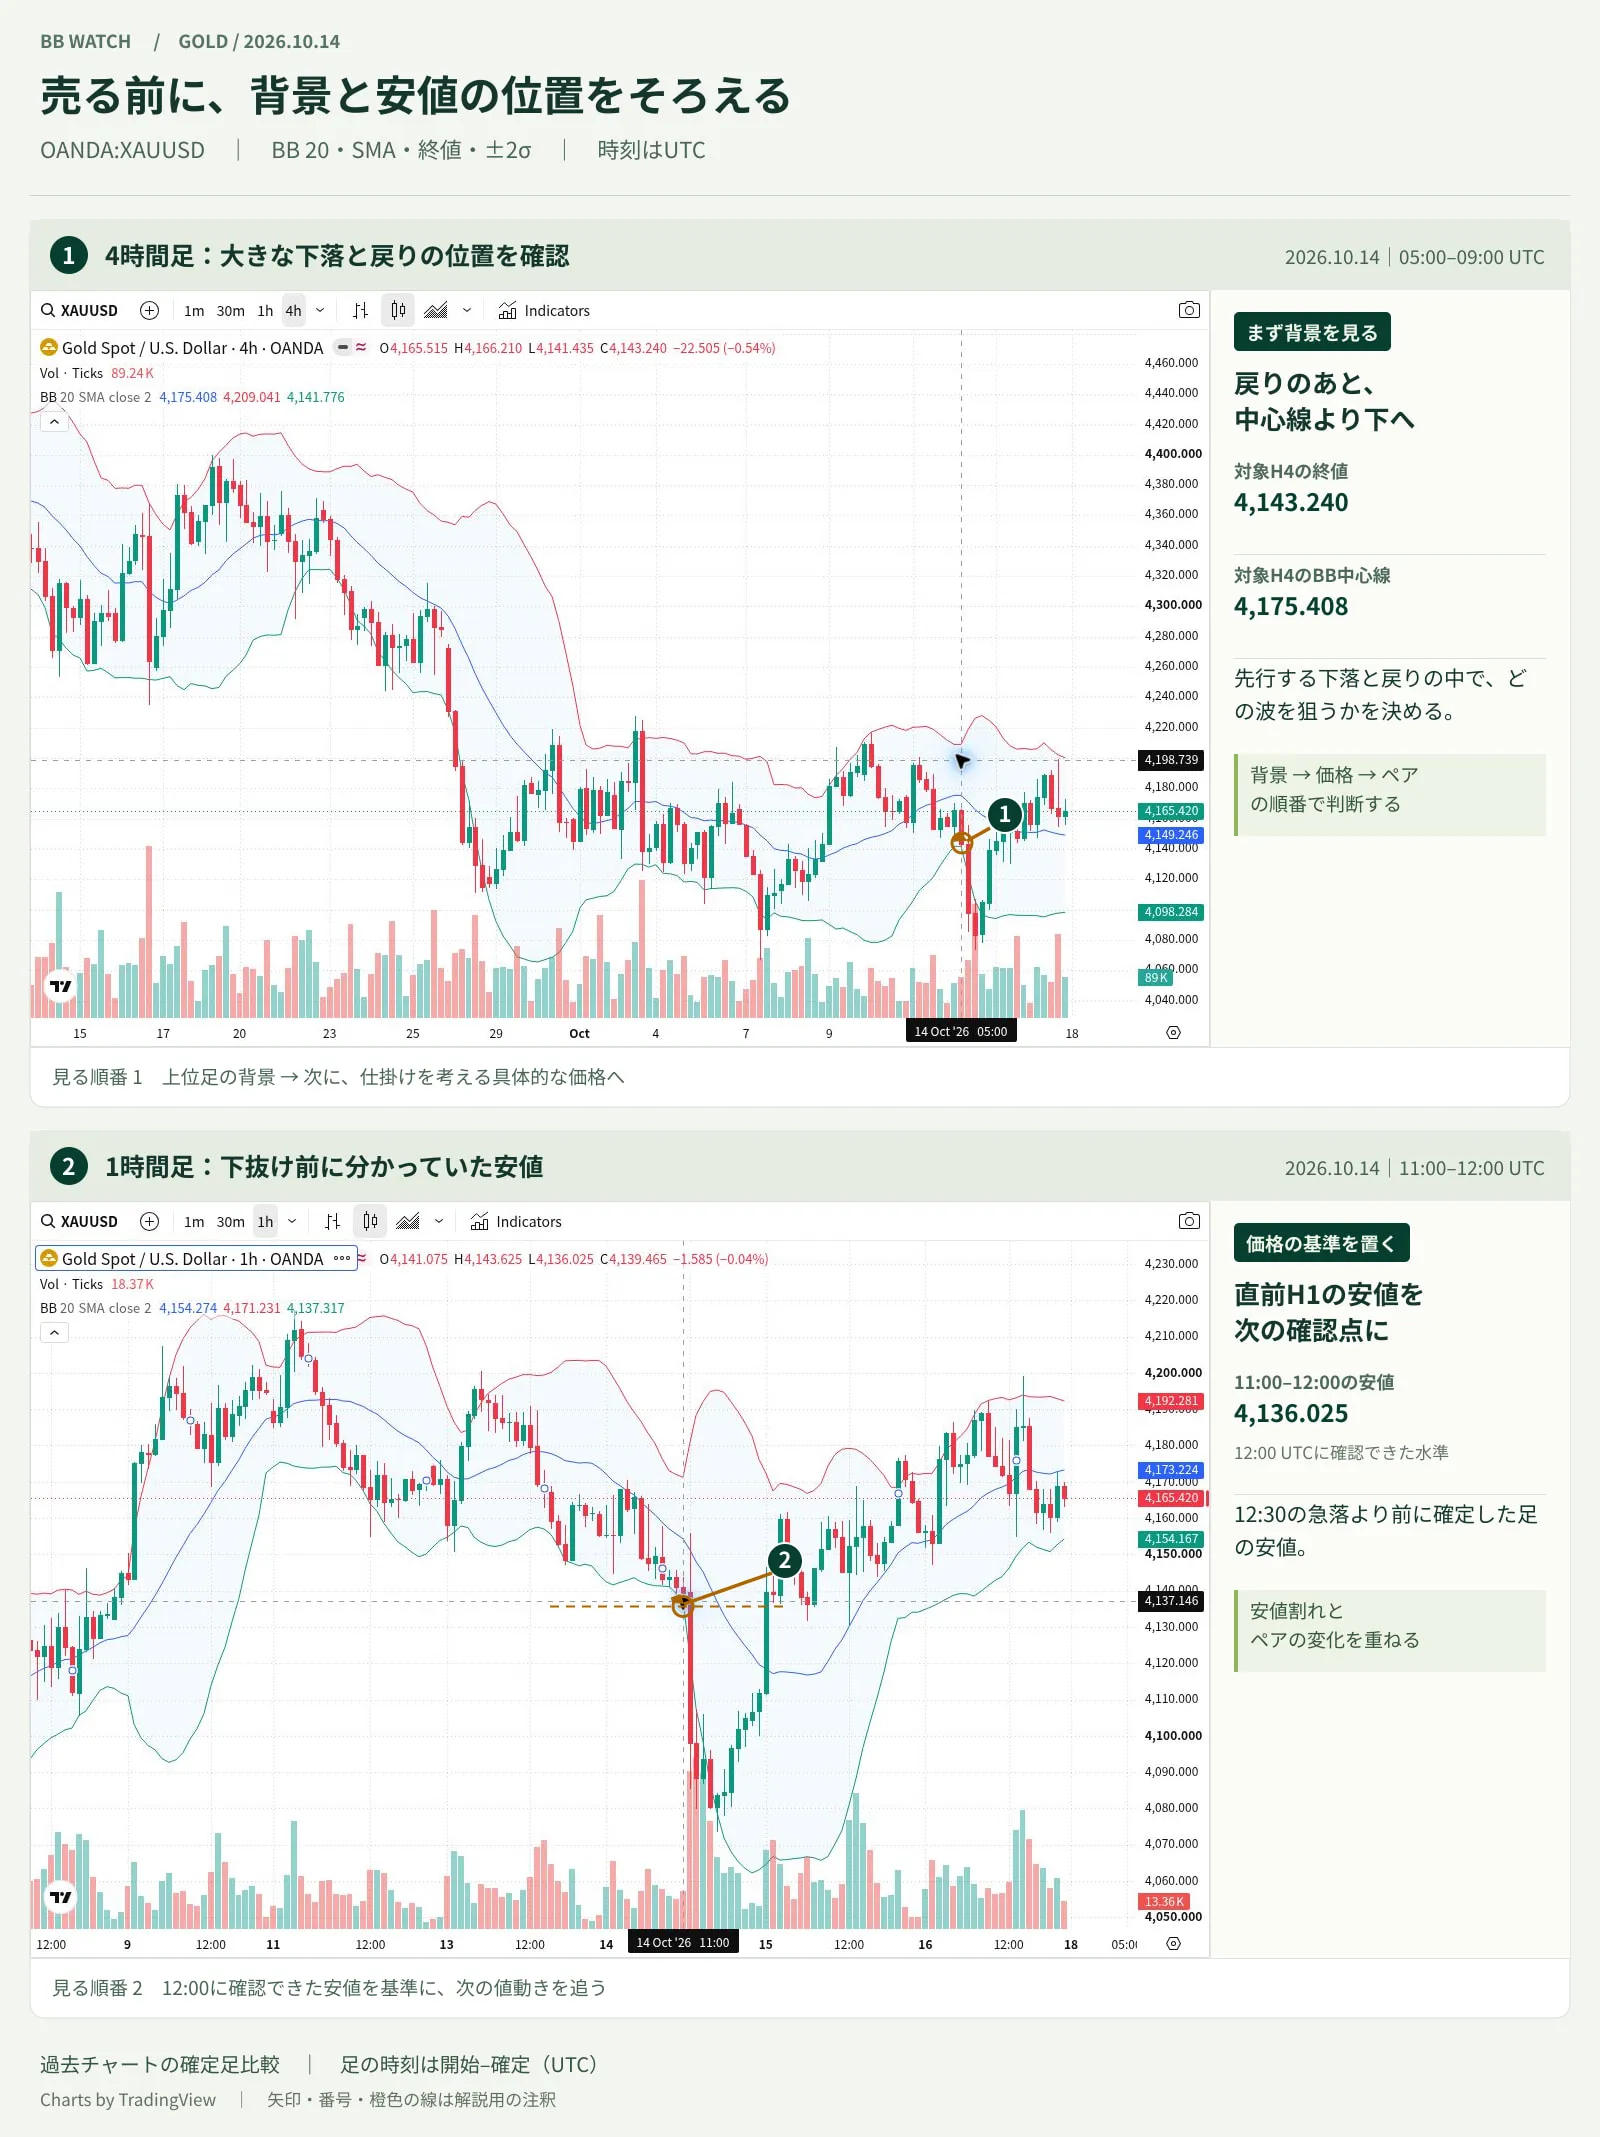
With the 4-hour decline and rebound as background, the 1-hour low of 4,136.025 dollars was confirmed by 12:00. Charts by TradingView
First decide where you want to sell
In the 4-hour chart, you can see the preceding decline and the subsequent rebound. The candles from 05:00 to 09:00 on October 14 ended at $4,143.240. It retraced below the centerline.
What I want to consider here is not selling anywhere, but constructing a plan to sell after the rebound and break the nearby low, then move further downward.
The low of 4,136.025 dollars on the 1-hour chart between 11:00 and 12:00 is confirmed as of 12:00. If you’re thinking of selling, you track this low break in price movement together with how the pair’sBB changes.
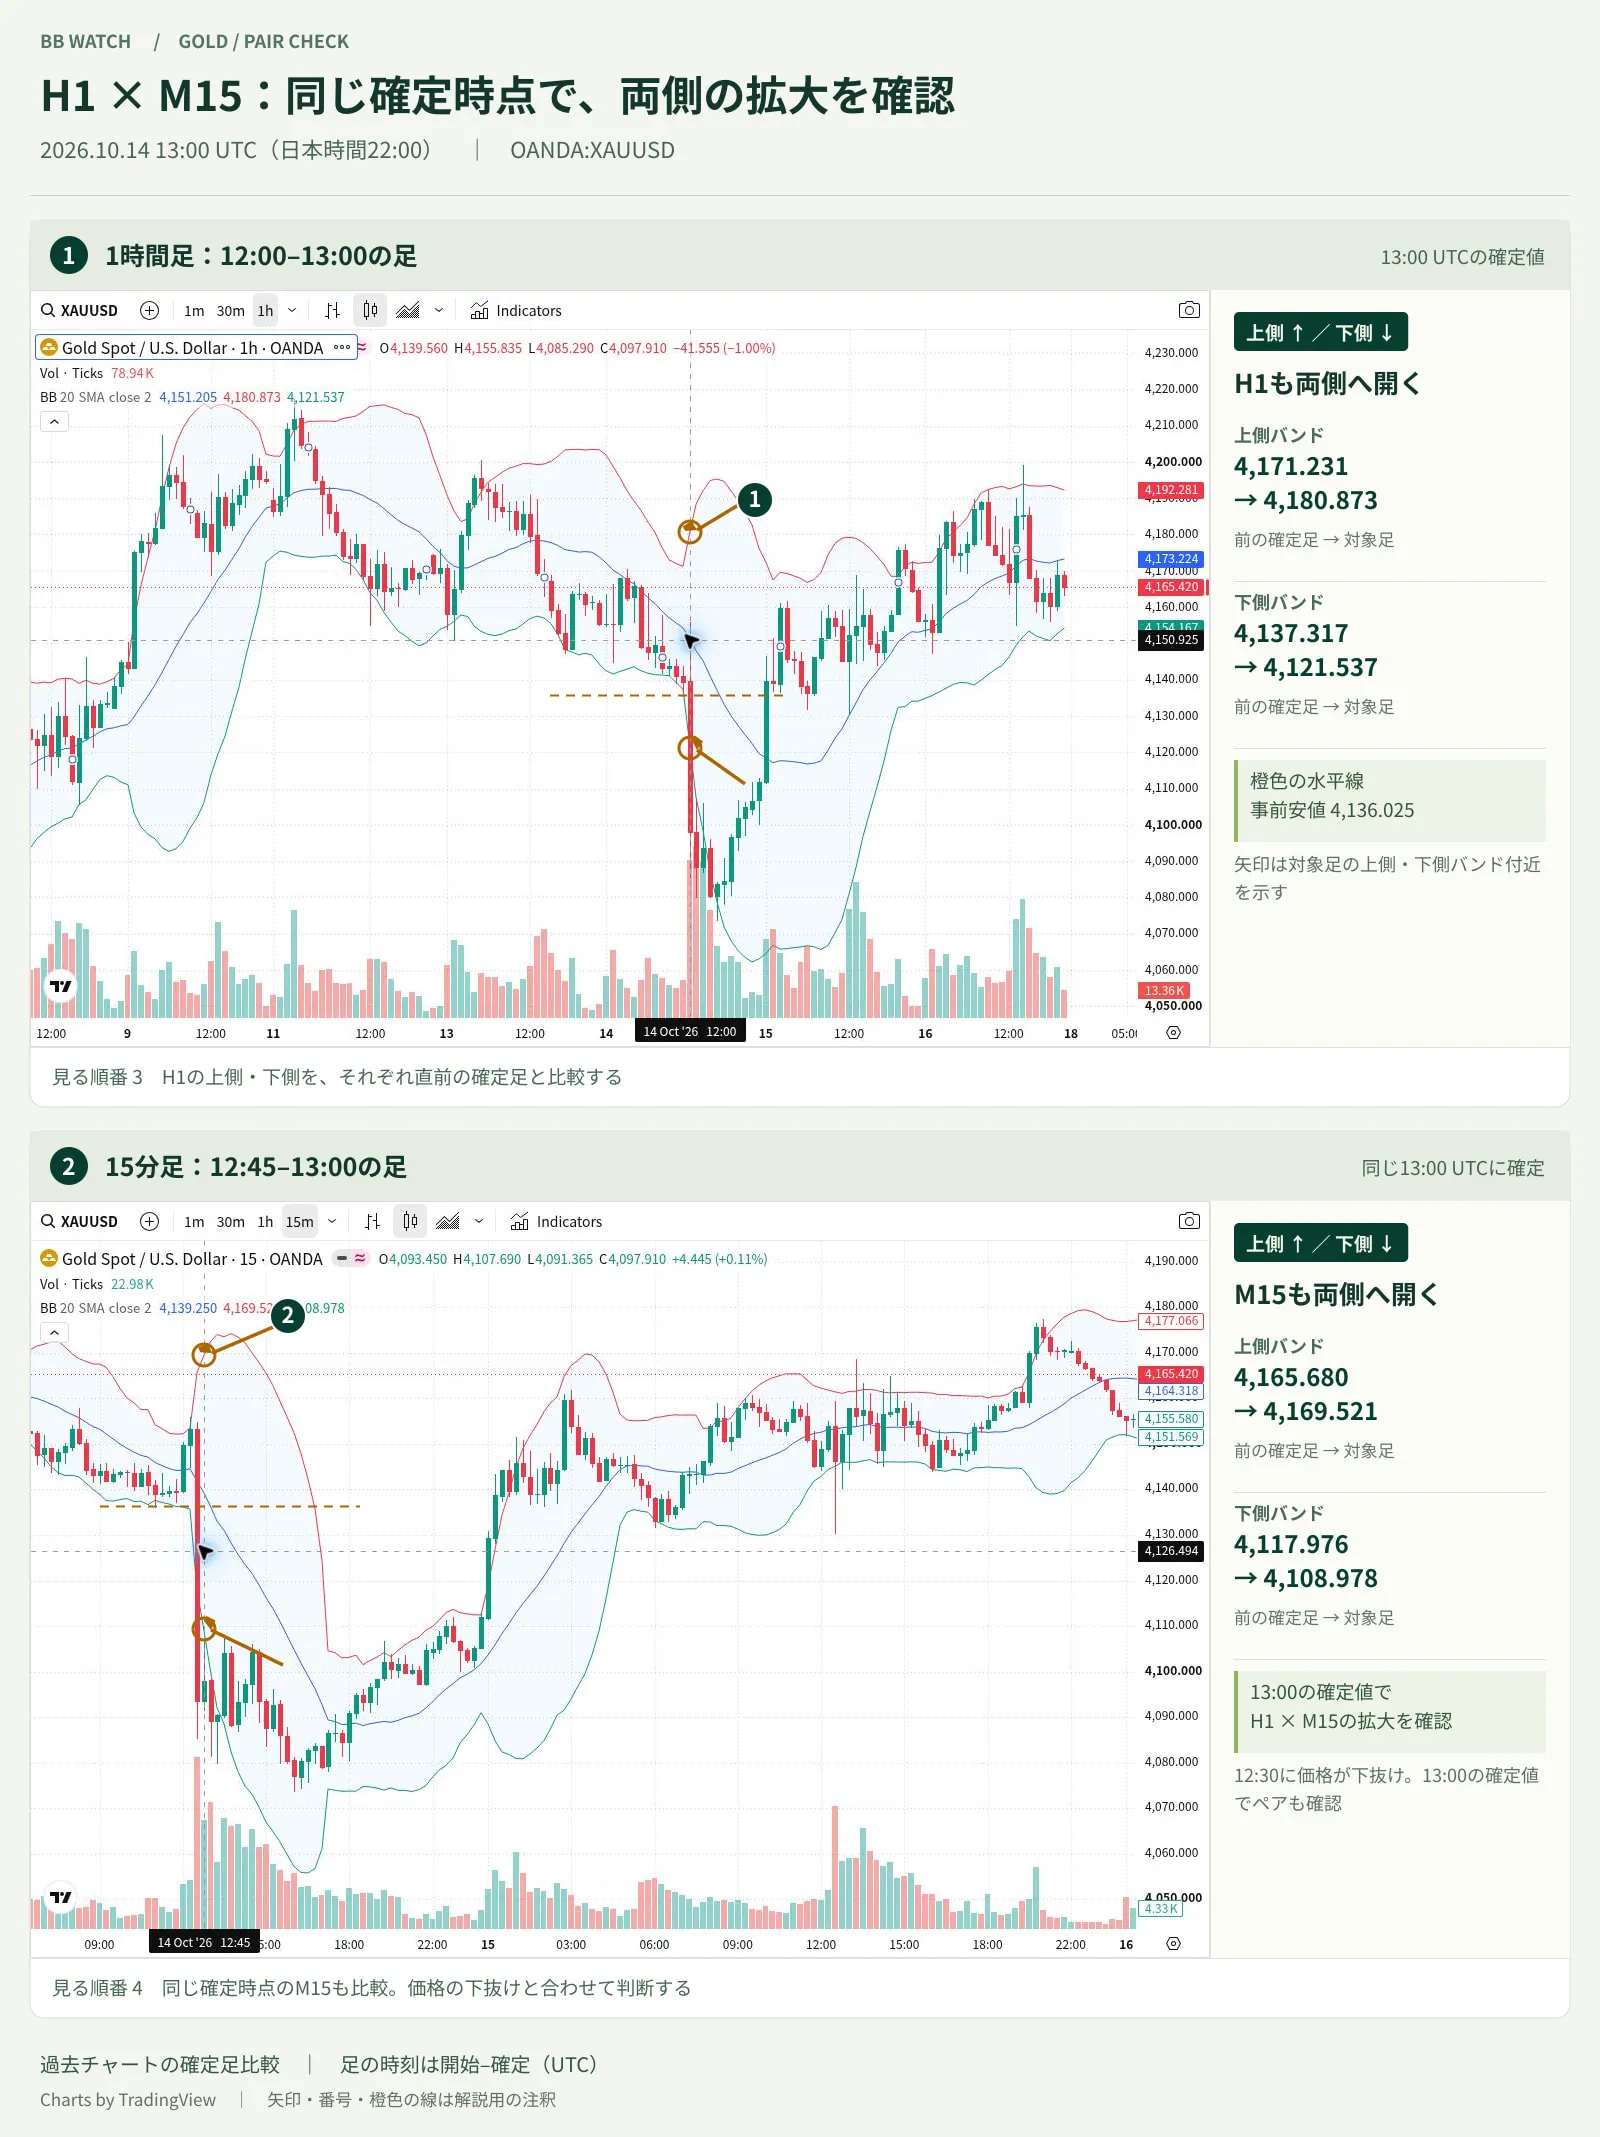
H1 and M15 confirmed at 13:00 UTC on October 14, 2026. In both, the upper band rose and the lower band fell. Charts by TradingView
When the low is broken, pair expansion overlaps
In the 12:30–12:45 15-minute bar, price fell well beyond the recent low. And comparing the 1-hour and 15-minute bars confirmed at 13:00, both see the upper band rising and the lower band falling.
This is a state of pair-synced expansion where both legs of the pair expand. In addition to the 15-minute chart, the 1-hour BB also shows expansion.
If you’re using this to decide on selling, the order of checks is as follows.
・In the 4-hour chart, see whether you’re aiming for a decline after a rebound
・See whether the price breaks the recent low
・Compare whether the BB on the 1-hour and 15-minute charts both widen
・Determine the stop-loss placement and the distance to it to judge the entry
With this combination, you can move one step beyond “I want to sell because it suddenly dropped.” If the price starts moving downward at the targeted level and that change is reflected in the pair as well, you can add it as the basis for your entry.
BB Watch is used to compare changes across multiple time frames in that moment. Don’t get distracted by chart switching; when price reaches a key level, you can simultaneously confirm changes on the pair side.
Even when entering during a steep drop, it doesn’t mean you must wait for the bar to close. If using moving prices, judge the current state of the pair and price on the spot. The image this time shows the expansion of both legs confirmed at 13:00.
Confirmation column: pair confirmed at 13:00 UTC
Upper band on the 1-hour: 4,171.231 → 4,180.873; lower band: 4,137.317 → 4,121.537
Upper band on the 15-minute: 4,165.680 → 4,169.521; lower band: 4,117.976 → 4,108.978
You don’t need to memorize the numbers. Just understand with a diagram that the upper side opened higher and the lower side opened lower.
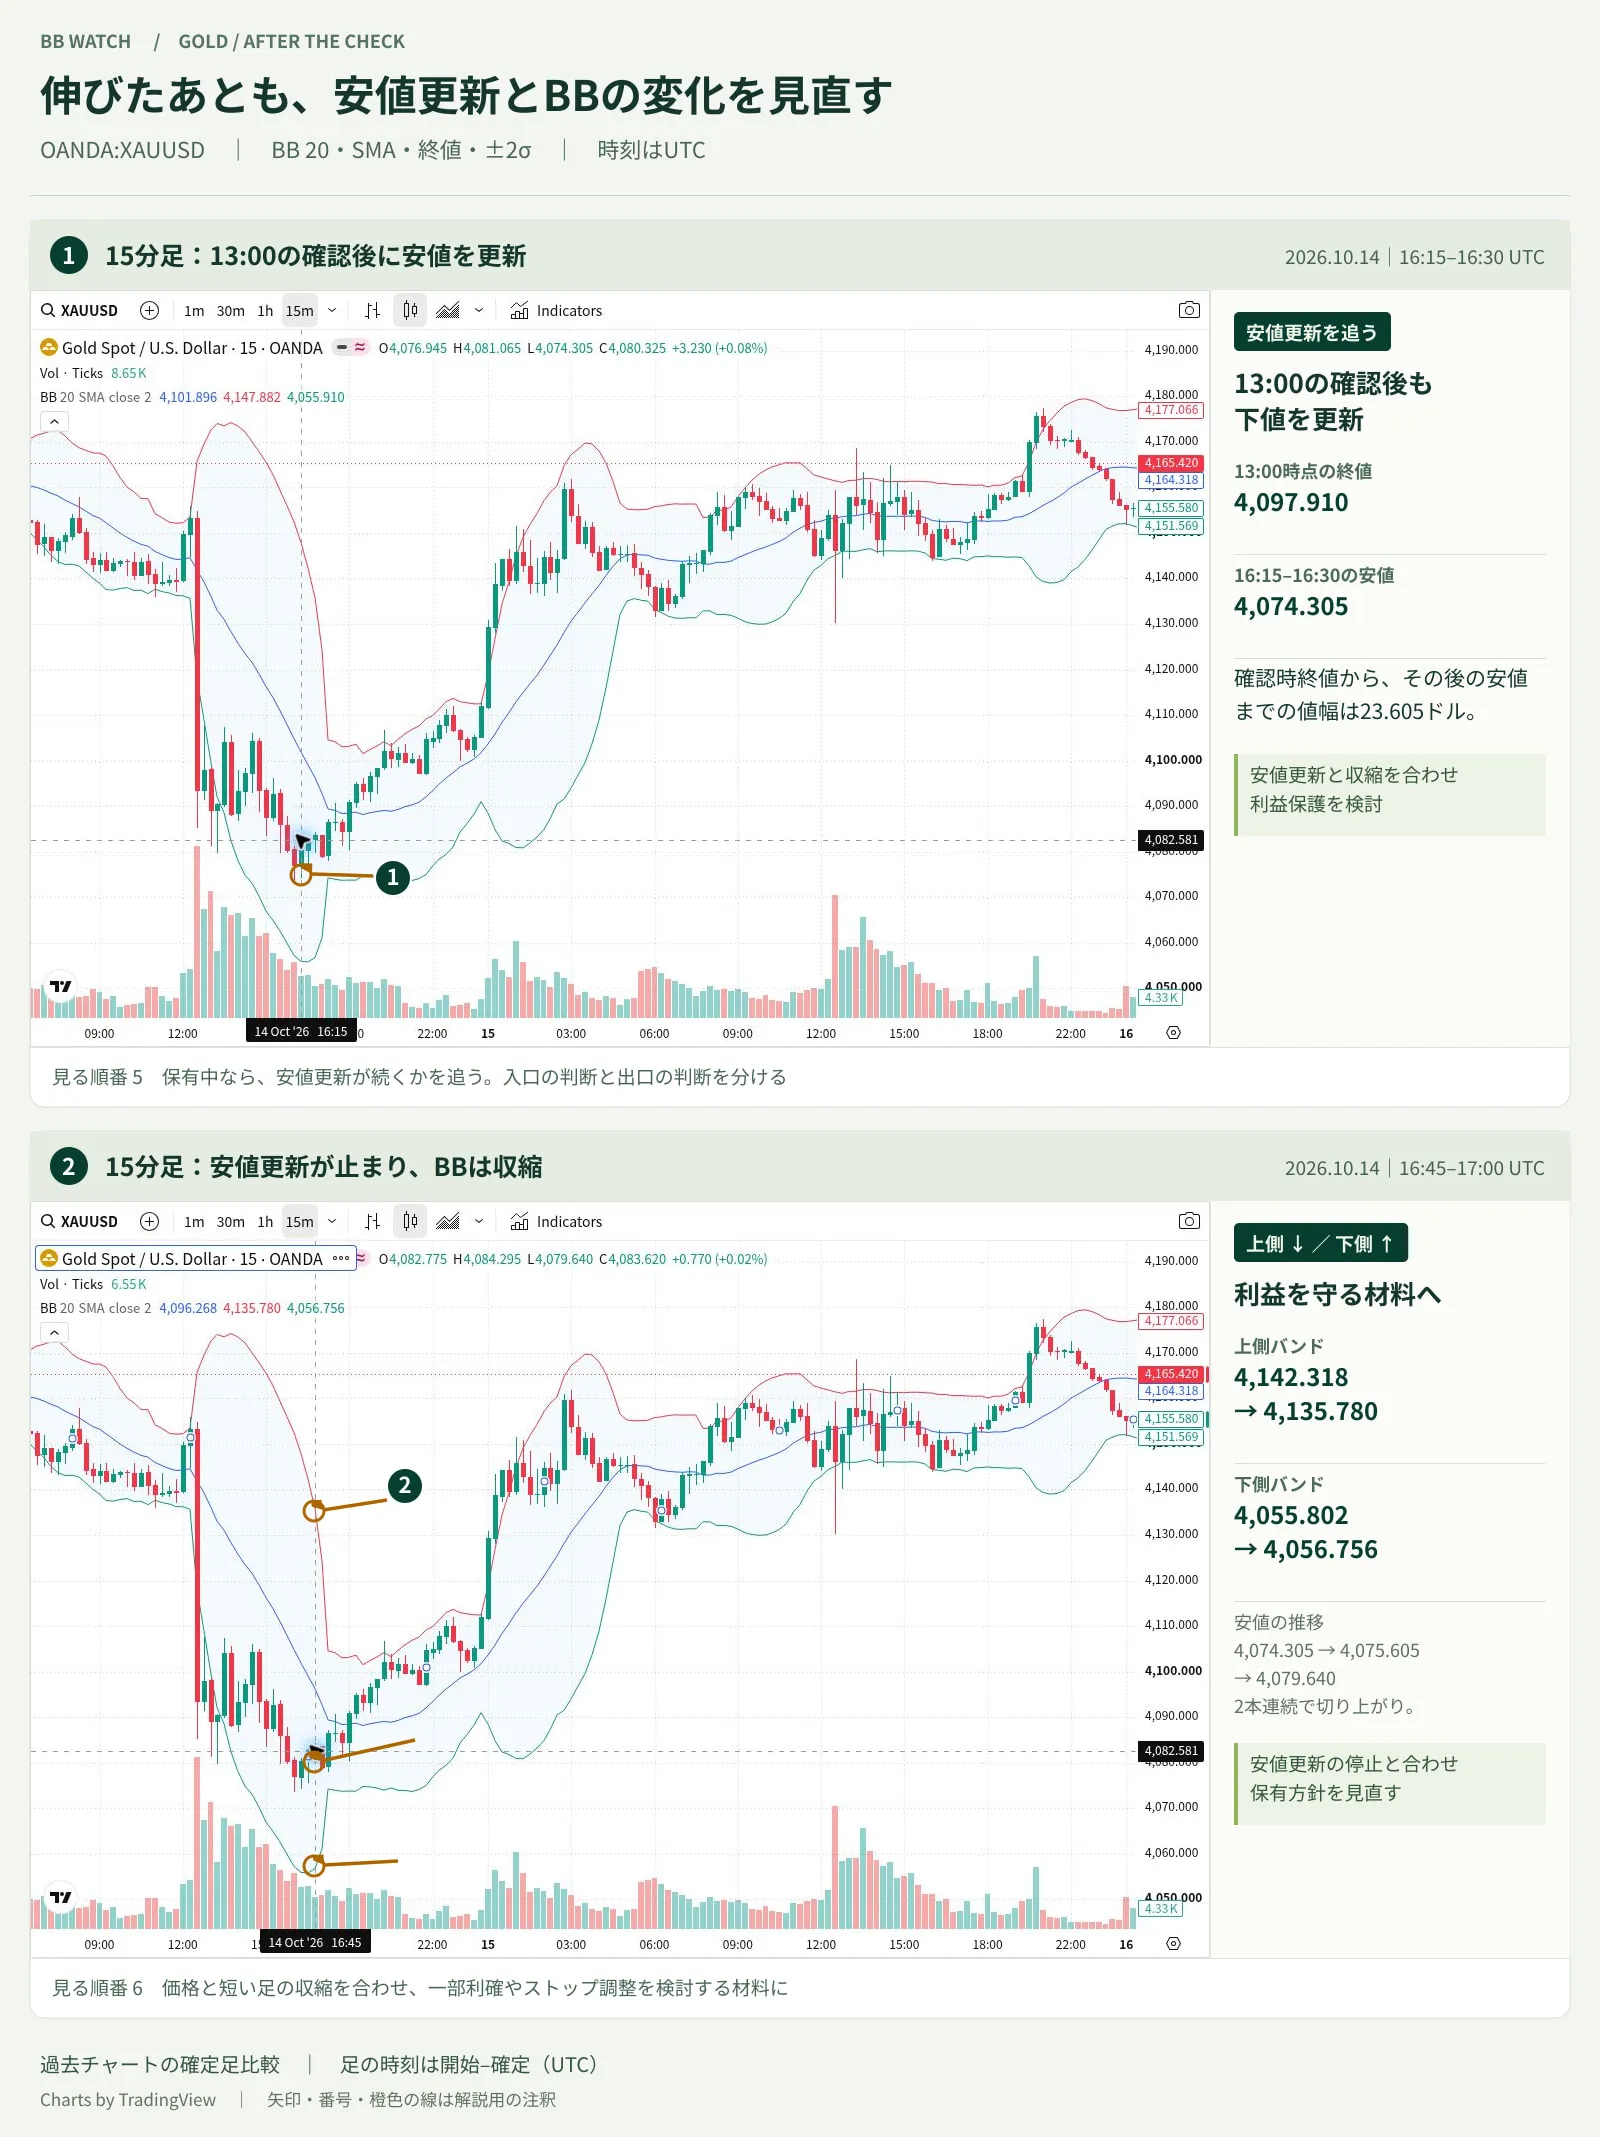
After the 13:00 confirmation, the low was updated at 16:15 on the 16:15-time frame. In the M15 from 16:45 to 17:00, the low update stopped and the BB contracted from both sides. Charts by TradingView
If it extends, next consider protecting the profit
The close at 13:00 was $4,097.910. Later, in the 16:15–16:30 candles, it fell to $4,074.305.
The downside continued after 13:00. If you’re considering an entry, confirm the distance to your own stop-loss rule such as the rebound high. What we’re looking at here is price movement after confirming the pair’s expansion at 13:00.
If you could hold the short, don’t just keep holding because you expect it to go further. Track the new low and the BB changes on shorter candles.
After the 16:15 low, the next two candles did not make a new low. In the 16:45–17:00 candles, the upper band fell and the lower band rose. This was a case where the 15-minute BB contracted from both sides.
If you’re protecting the profits on a short you hold, you can consider partially taking profits or tightening stops here. Don’t rely solely on BB contraction to reverse to buying; judge it in conjunction with the price movement stopping at a new low.
BB is calculated from recent price volatility. Contraction on short candles is a reminder that the same widening pattern as during a sharp drop may not continue. In this example, the rebound continued afterward.
There are reasons to compare the pair both at entry and exit
If the price breaks and only one lower-timeframe leg widens while the other hasn’t yet followed, re-check whether the entry conditions are met. This is a way to avoid catching a trap that moves only on the broken price.
Conversely, if the pair expands at the target moment, that becomes material for entering the wave. While holding a position, synchronize the contraction of the short legs with key price levels to support profit protection decisions.
This time we chose the 1-hour x 15-minute combination. The pairing is not fixed. For example, if you want to target the 15-minute wave more briefly, you can use 5-minute x 1-minute with a technique that suits your wave target.
“I’ve reached a place where I want to sell. At that moment, what is the pair doing?”
If you also want to see an upward breakout,An example of breaking GOLD resistanceand compare with it.
If you’d like to add that confirmation to your regular environment analysis, please view the screen and usage on the BB Watch product page.
View the BB Watch product page
Conditions: TradingView/OANDA:XAUUSD. BB period 20, SMA, close price, ±2σ. Time is UTC (Japan time is +9 hours). The candle labels indicate start to confirmation times. The images are based on historical confirmations and do not reproduce intrabar synchronization times or actual trading results. The trading procedure is for illustrative purposes and may incur losses.
Charts by TradingView
View chart source (TradingView)