
Mitsui O.S.K. Lines, after the sharp rise, the pullback rebounds at the 50% level――Upper room potential and retreat criteria seen in FUKAN
Mitsui O.S.K. Lines: After the surge, is the pullback at the 50% level likely to rebound?――Upper potential and retreat criteria viewed on FUKAN
Subject: Mitsui O.S.K. Lines CFD (9104.TSE) / M5
Publication date: October 13–16, 2026
Focus: Support near 50%, maintenance near 38.2%, upside potential near 23.6%
Introduction | How to evaluate pullbacks after a rise
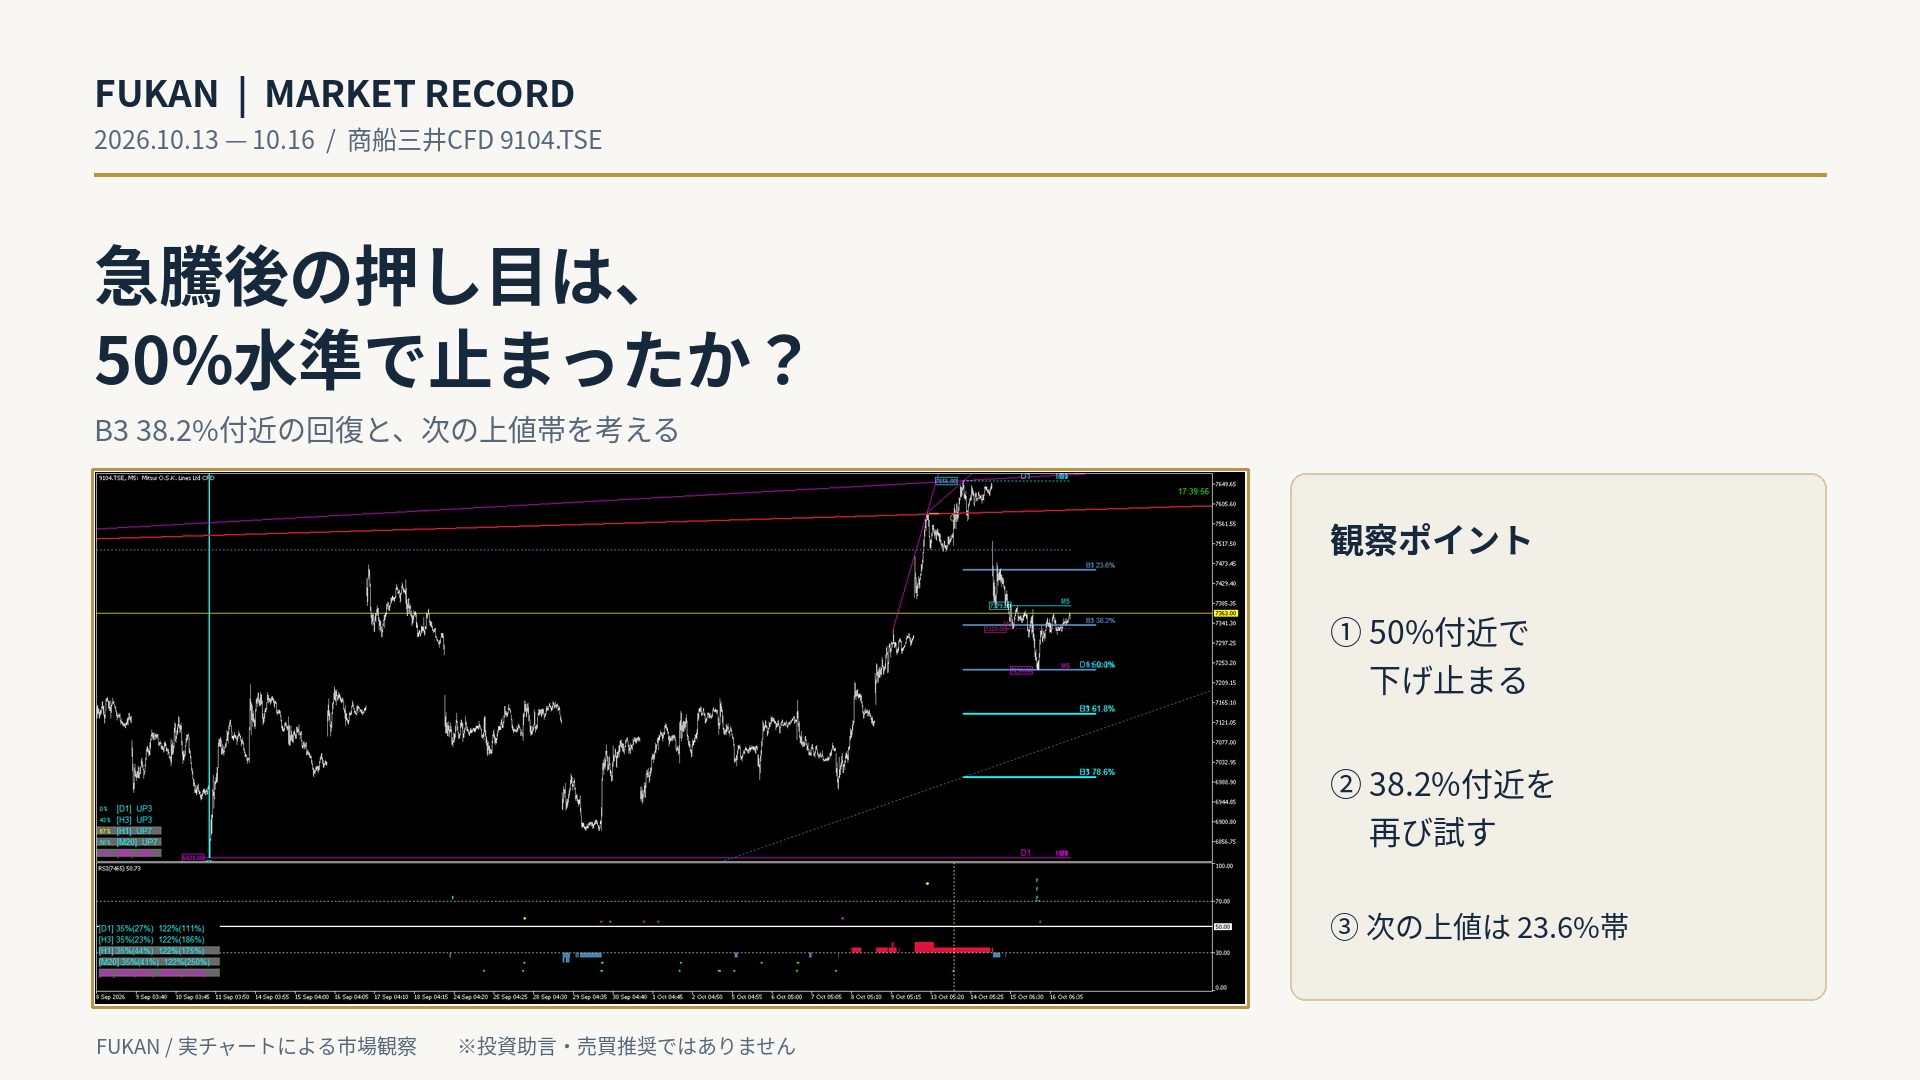
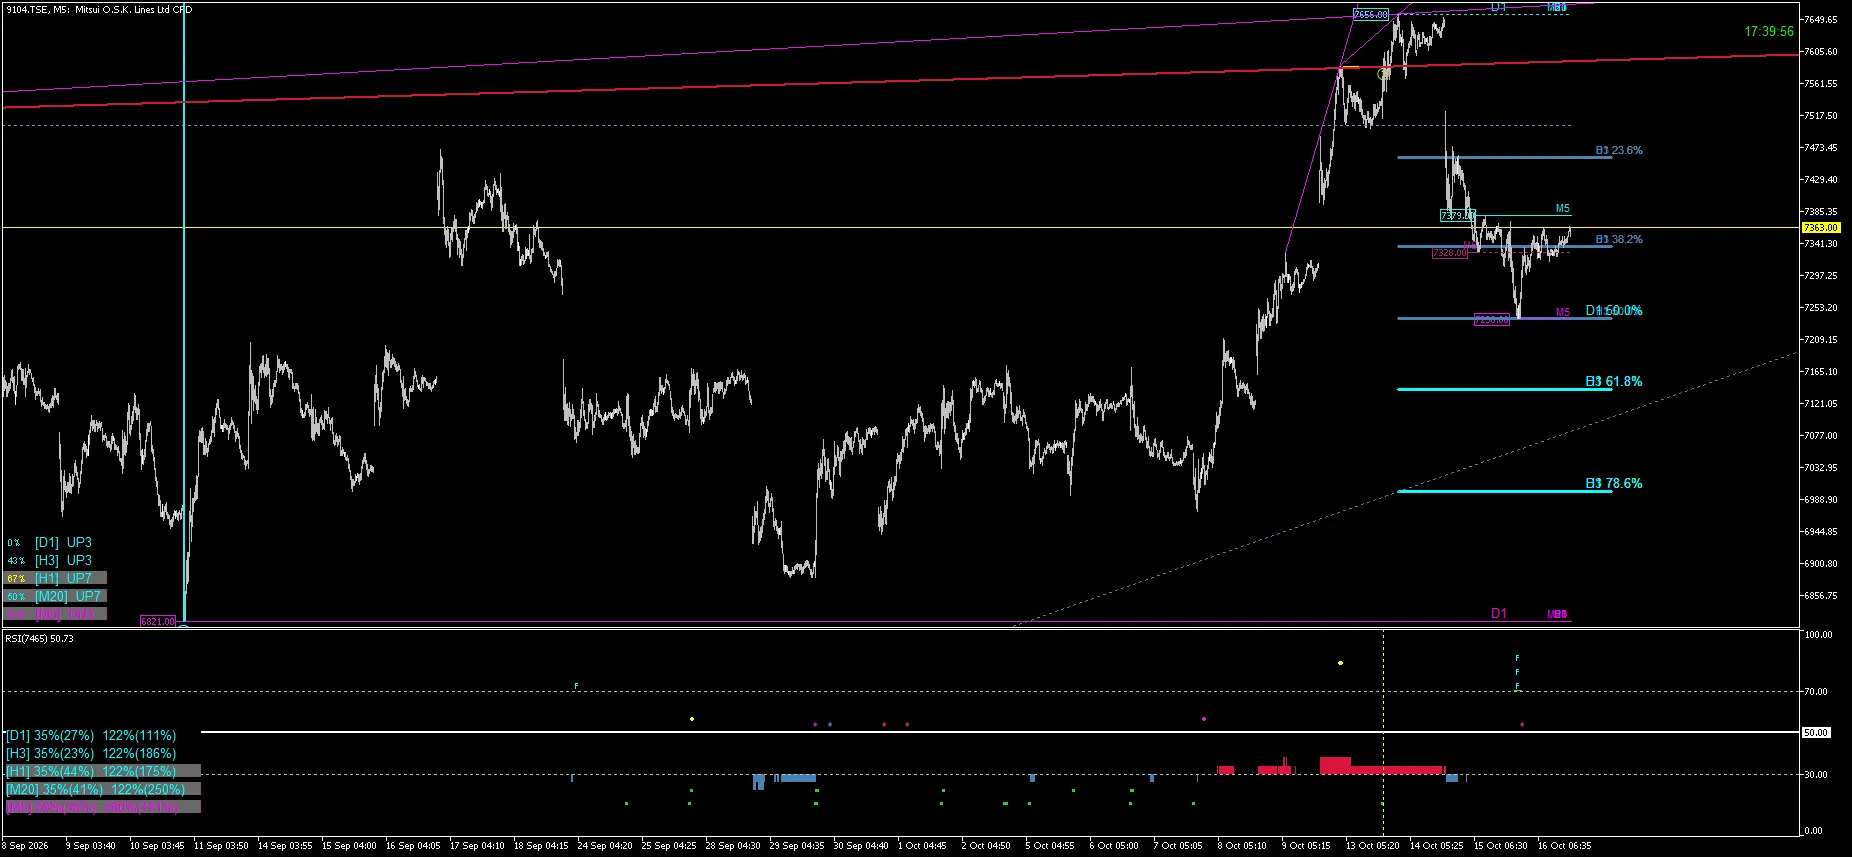
Mitsui O.S.K. Lines CFD (9104.TSE) surged on October 13–14, with a high around 7,655.60 displayed on the FUKAN screen. It then pulled back significantly, and in the saved image on October 16 it pulled down to around the B3 Fibonacci 50.0% level and then moved back toward around the 38.2% level.
From the current FUKAN perspective, what matters more than the fact that the rise paused once is “where the pullback stops, and how much room remains to the next resistance band.” We will organize the criteria for support, resistance, and interpretation for a potential re-rise from the pullback, using four days of actual charts.
1 | October 13: acceleration of the rise and move toward the higher band
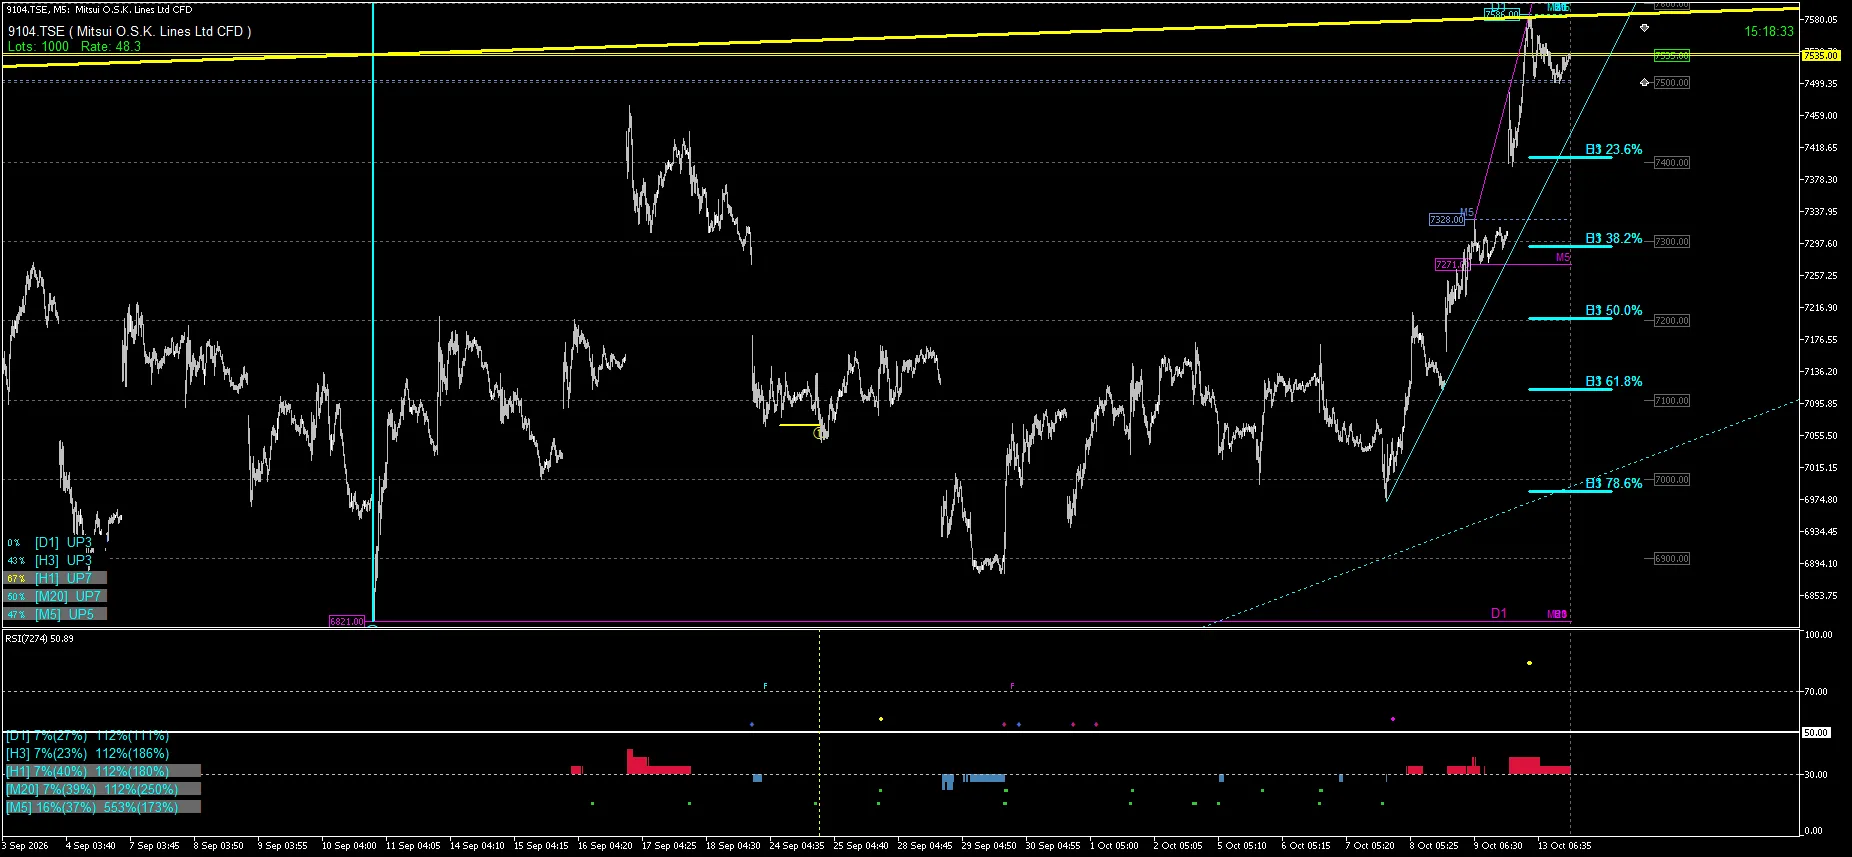
In the saved image for October 13, price rose sharply from the prior range and tested a horizontal band near 7,535. How far a pullback will occur after a sharp rise is critical when deciding whether to chase or wait for a pullback.
2 | October 14: high near 7,655 formed
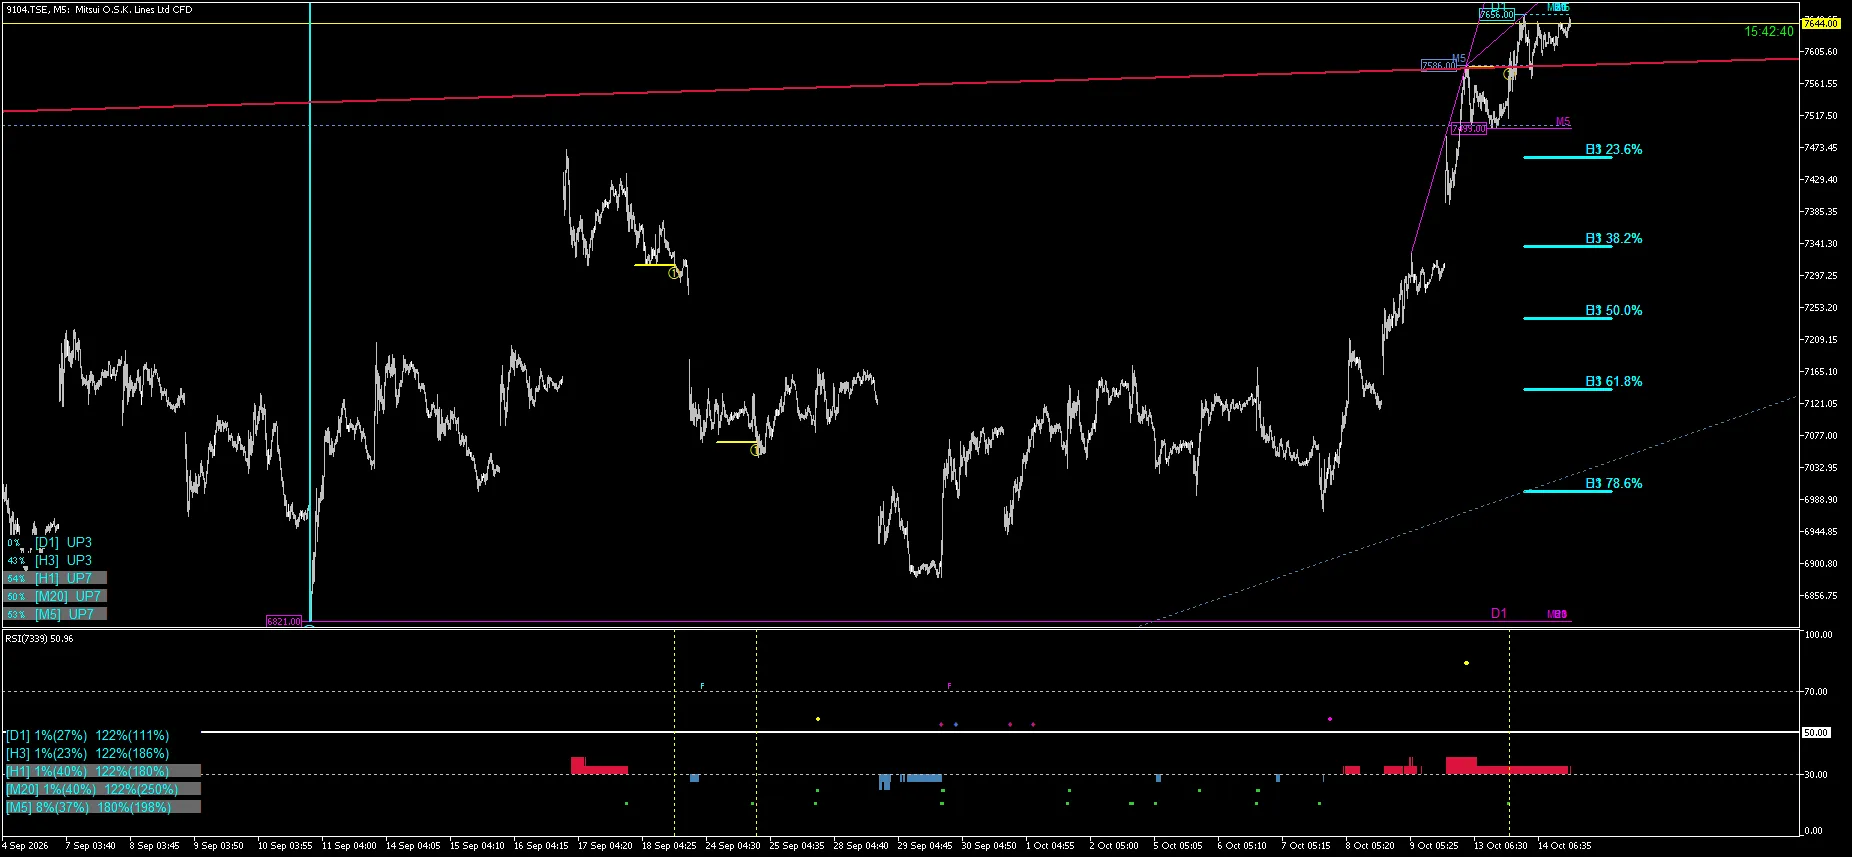
The saved image for October 14 shows a high around 7,655.60. In a strong up-move, it’s better to anticipate which levels can act as support if the price retraces rather than chasing only the highs. The FUKAN B3 Fibonacci levels can serve as a gauge of pullback depth.
3 | October 15: pullback from the sharp rise
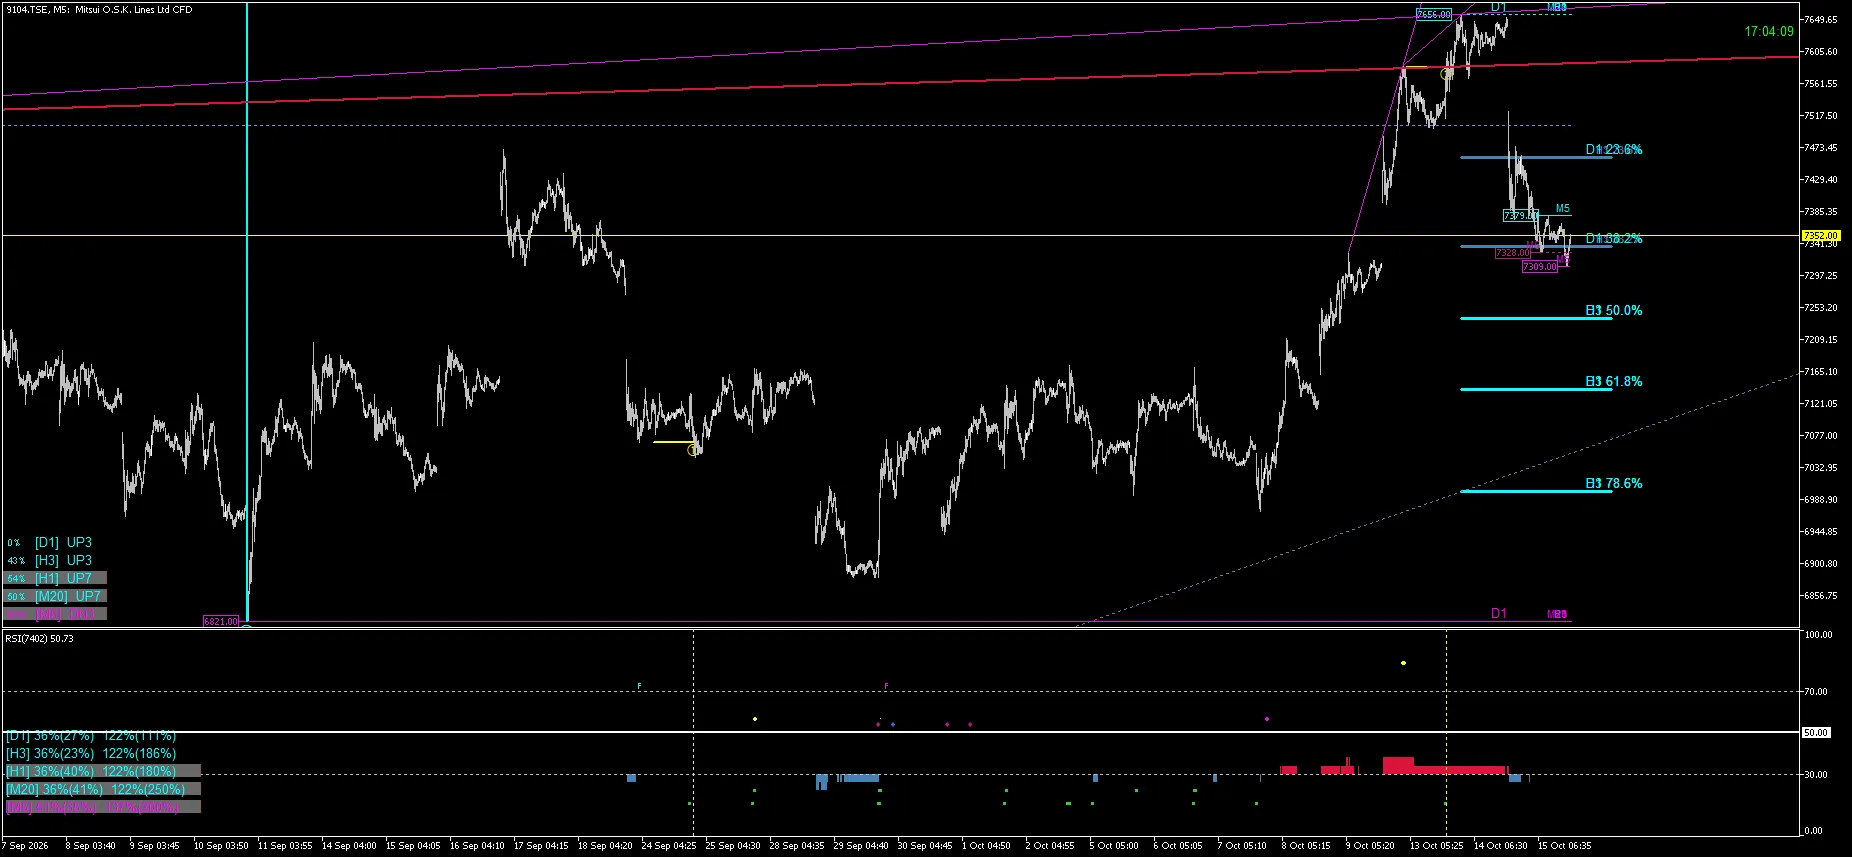
The saved image for October 15 shows a large drop from the high, with the right edge around the low-7,300s. The increased distance from the high allows considering pullbacks differently from October 14’s high-price chase.
However, it is not yet clear whether the rebound will continue. The key is the level where the pullback stalls and how the price moves afterward.
4 | October 16: pullback to around the 50.0% level, then reclaim toward around 38.2%
In the saved image for October 16, the right-side price movement pulled down to around the B3 50.0% level (roughly around 7,250) and then reversed to around the B3 38.2% level (roughly 7,340–7,350). The price shown on the far right is 7,363.00.
The 50.0% level acting as support on the downside provides a basis for considering pullback support. On the upside, the B3 23.6% level remains around 7,470, which can serve as a next target in the rebound. All values are approximate read from the saved image’s scale.
5 | Current FUKAN scenarios for pullbacks
If we expect a re-rise from the pullback, the first thing to watch is whether the 38.2% around the B3 level can hold. If it holds and tests higher, the 23.6% near 7,470 becomes the next target. Conversely, if the price again clearly falls below the 50.0% area, it would be a condition to reassess the notion that the support held this time.
On October 16, the FUKAN bottom-left shows D1, H3, H1, and M20 as UP, while M5 is DN3. Even if the higher timeframe shows an upward signal, given that a short-term pullback remains, it is practical to judge whether the price actually sustains support.
What matters is not the idea that “50% guarantees a rebound,” but that the price responded near that level and that the next target and the distance to the next support break can be compared on the same chart.
6 | Compare entry position and risk with numbers
If we take around 7,363 on the right edge as the base, the price difference to the next 23.6% around 7,470 is about 107, while the distance to the 50.0% around 7,250 is about 113. In this simple distance comparison, upside potential and distance to support are roughly similar.
However, if you place a stop-loss below the 50.0% level, the risk distance becomes larger. With spreads, fees, and slippage included, whether you chase at the retrieved price or wait to near the support area changes the balance of risk and potential reward.
This comparison is not a price instruction but an example of evaluating a trading plan using the visible supports and resistances on FUKAN. CFD contract size, currency conversion, and costs vary by account conditions, and the price differences shown here do not represent profit or loss amounts.
7 | Notes on save times and CFD data
The save times of the used images are October 13 15:18:41, 14 15:42:44, 15 17:04:09, and 16 17:40:07 (local collection log times). The final tick on the 16th is broker server time 09:19:55, which does not match the save time. They are not presented as live prices in the 17:00 hour or as the official closing price of the actual stock.
The prices in this article are the display prices of Mitsui O.S.K. Lines CFD in the collection environment. They may differ from actual stock exchange data, and the Fibonacci levels on the chart may change due to recalculation or anchor updates.
Summary | If support remains, consider a rebound from pullbacks
Mitsui O.S.K. Lines CFD surged and then pulled back; on October 16, the 50.0% area showed a reaction, with movement back toward around 38.2% that can be observed. Under the current structure, as long as support holds, there is room to anticipate a return toward the 23.6% band.
At the same time, if the support is broken, a clear criterion to adjust the view is established. The value of FUKAN lies in being able to compare pullback position, upside potential, and retreat criteria on the same chart to concretize trading assumptions rather than merely predicting up or down.
This article is a market observation and analysis record, not investment advice or a buy/sell recommendation. It does not guarantee future price movement, returns, or win rates.