
The PF3.8 method had only 5 trades.
The largest number on the report card was the number you should trust the least.
In my validation records, there is a method called “Total profit ÷ Total loss” which equals 3.80. If it exceeds 1, it’s profit; if it falls below, it’s loss. 3.80 looks quite strong.
However, the number of trades was only five.
Five trades with 3.80, versus 158 trades with 1.75
This is a method based on a small flag on H4 candles. I tested USDJPY, EURUSD, and GOLD for three years, and there were only five trades. My acceptance condition is at least 150 trades. It’s not enough.
There were other similar cases. A harmonic-shaped method yielded 2.74, but there were only three trades. In baseball terms, it’s like getting a hit in one at-bat and saying your batting average is 1000.
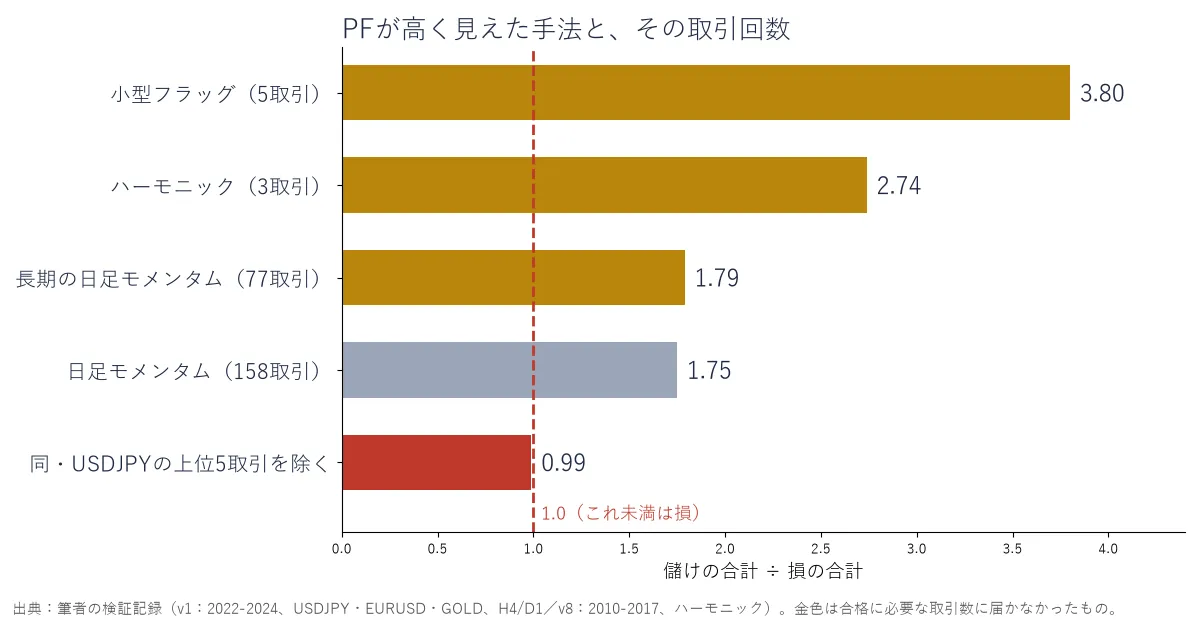
What I want you to notice in this diagram are the three gold bars. None of them reached the required number of trades, so their numbers are meaningless. The gray bar is an example with enough trades.
Even with enough trades, you can’t be sure yet
Daily momentum, over 158 trades, was 1.75. The number itself is respectable, and the count exceeds 150 trades.
But when you break down the details, it’s different. 73.4% of the profits concentrated in USDJPY. If you exclude the five large USDJPY trades, 1.75 becomes 0.99. It falls below 1.
The magnitude of the number alone doesn’t reveal true strength.
The order to look at performance
From here, this is my thinking. The way to read the performance report becomes clear if you decide on the order in advance.
First, look at the number of trades. Next, check whether profits are not overly concentrated in a single period or currency. Only after that should you consider large numbers.
I want to stop promoting only win rate or profit size. Numbers that do not include the number of trades and the period are not useful as material.
Things not clear in this article / cautions
・The required number of trades for acceptance varies by validation version (v1 requires 150 trades or more; v8 requires 300 trades or more).
・v1 lacks fee data, and the results are provisional with fees set to zero.
・The periods are: v1 is 2022–2024, harmonic v8 is 2010–2017. They are not meant for a direct comparison under the same conditions, but as illustrative examples of appearance.
・These are rules I created for validation purposes, not methodologies for a specific person.
Sources
・My validation records (trial logs from v1–v10 and method catalog)
The full validation including 10 trends and countermeasures is compiled in the e-book “FX Methods: About 2,100 Validation Records.”
https://www.gogojungle.co.jp/tools/ebooks/87920
This article presents validation records and information and does not advocate for specific trades or promise profits. Please make investment decisions on your own.