

What to do when the direction of the leading foot and the trailing foot are different? Learn from the chart: Trend reversal and pullback [DWM Practical Chart Analysis EP.01]
DOWWAVE MARKER | DWM Practice Chart Analysis Series EP.01
What if the direction of the higher timeframe and the timeframe in action differ?
Learn from charts: Trend reversals and pullbacks
A practical example of multi-timeframe analysis by combining the execution timeframe CHoCH/BOS with the higher timeframe trend, moving averages (MA), and key price levels.
Even if an upward CHoCH or BOS is confirmed on the 15-minute chart, the 4-hour chart may still be in a downtrend. Conversely, even if the 15-minute chart shows a continued decline, nearby support on the higher timeframe can be just below.
In such situations, chasing only the direction of the signal can cause you to miss the “current position” from the higher timeframe view.The focus should be on understanding the relationship between the higher timeframe and the execution timeframe, not on determining which one is correct.This is what we’ll explore.
The key is not to decide which timeframe is correct, but to read how the two relate to each other.
This time, we will compare two chart cases where the directions diverge.
We will check in order: “higher-timeframe flow,” “price range in progress,” and “execution timeframe structure changes.”
Learn from video | What to do when the higher timeframe and execution timeframe differ?
We explain the market structure indicated by CHoCH and BOS and the cases where the higher-timeframe trend diverges from the structure on the chart. You can watch a video on the points to consider when judging trend reversals and pullbacks.

See the Structure. Follow the Trend.
01 / THE CONCEPT
A higher timeframe “retrace” can become the execution timeframe’s “uptrend”
Markets do not move in a straight line, up or down.
Even if a downtrend on the 4-hour chart (H4) continues with lower highs and lower lows, a retrace captured on the 15-minute chart (M15) can appear as a rising wave with higher highs and higher lows.
Conversely, a pullback in an uptrend on the 4-hour chart (H4) becomes a downwave on the 15-minute chart (M15).
Therefore, it is natural for different timeframes to display different trend judgments.
It is important to organize where the execution-frame wave sits within the larger wave of the higher timeframe.to understand.
| Timeframe | Main Verification Points |
|---|---|
| 4-hour chart (H4) | Big trend, current wave position |
| 1-hour chart (H1) | Relation of major highs/lows and moving averages (MA) |
| 15-minute chart (M15) | CHoCH/BOS, pullback, and trend resumption confirmation |
| 5-minute chart (M5) | Fine-tuned price movement and execution decisions as needed |
Note: This is an example where the execution timeframe is the 15-minute chart (M15).
The combination of timeframes varies with trading style.
02 / CASE 01
Execution timeframe shifts upward, but the higher timeframe remains downward
We examine a scene where the upward CHoCH/BOS is confirmed from the higher timeframe perspective.
STEP 1: On the 15-minute chart (M15) alone, it looks like an upward reversal
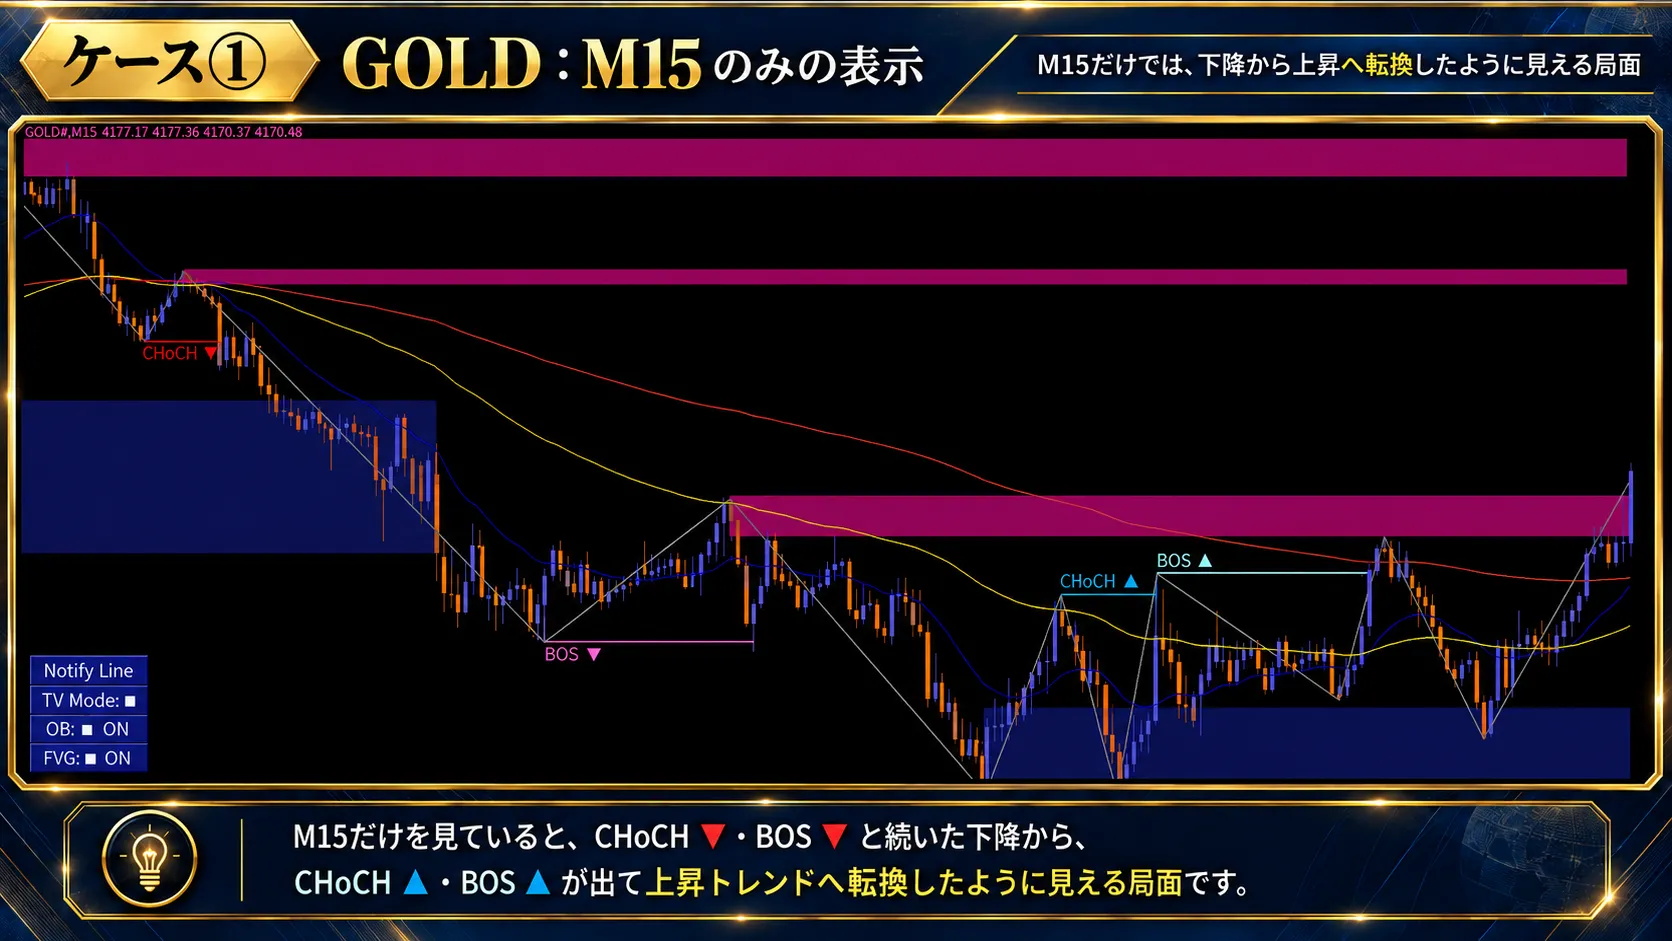
After a continued downward CHoCH▼ and BOS▼, a CHoCH▲ appears on the right, followed by BOS▲.
If you only look at the 15-minute chart (M15), it may appear that the market structure has turned upward.
However, acting on this information alone could cause you to buy near the top of a retrace in the higher timeframe.
STEP 2: Overlay the 4-hour chart (H4) moving averages to gain more evidence
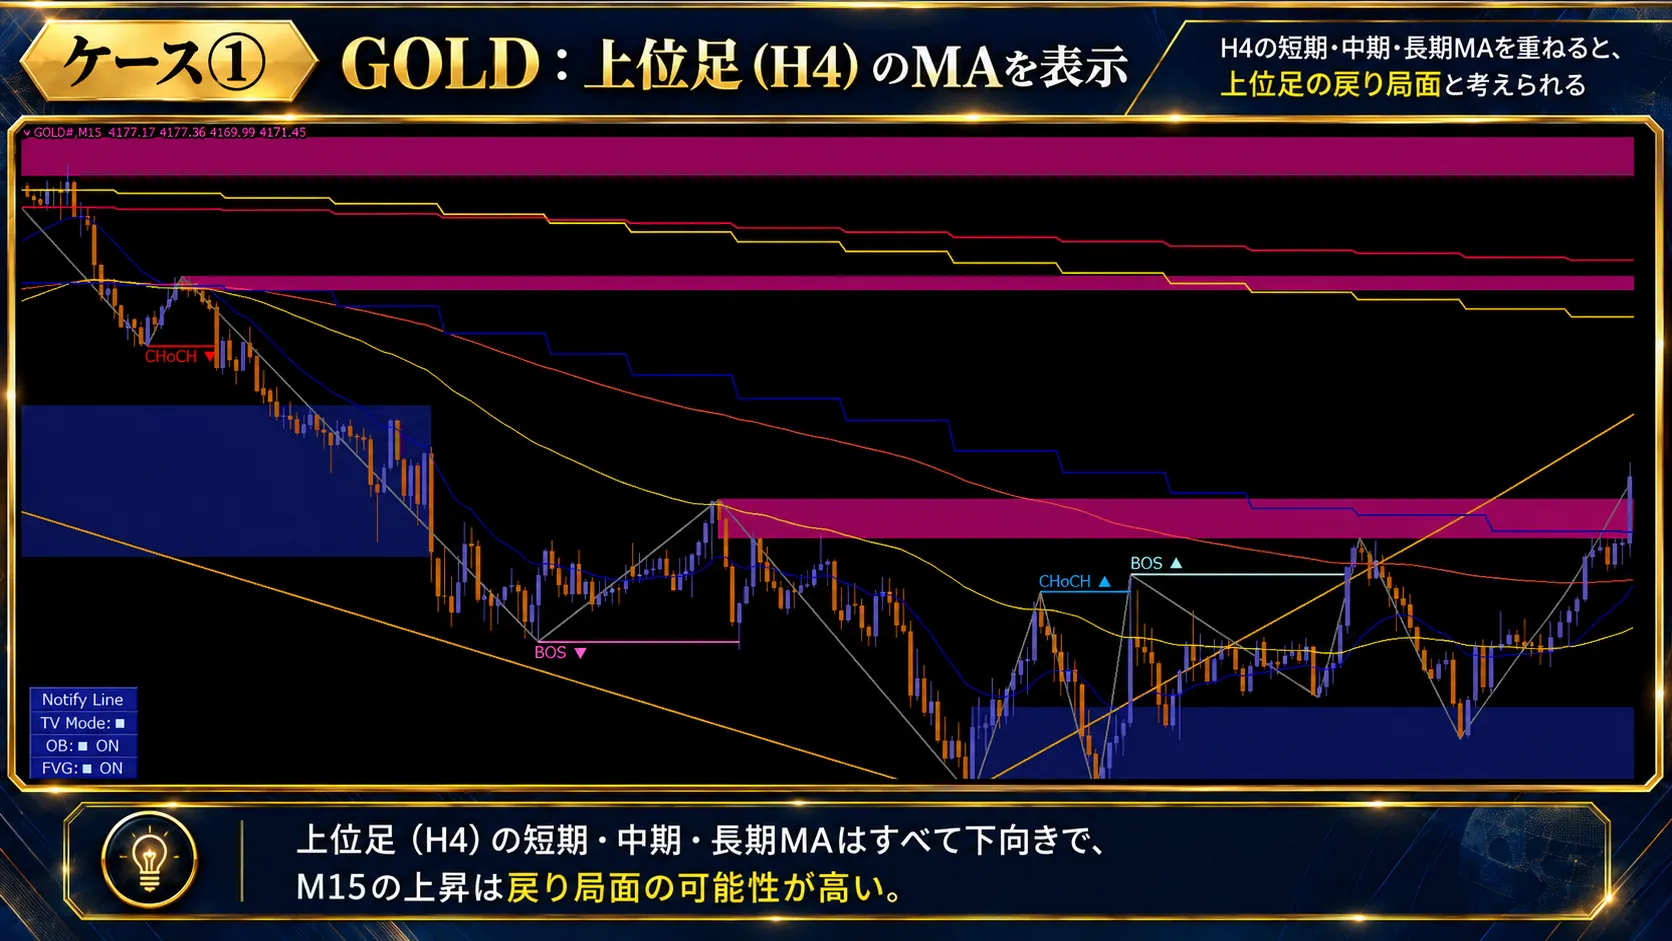
The 4-hour MA lines are trending downward.
This can be a scenario where the upward wave on the 15-minute chart (M15) is a retracement within the 4-hour downtrend.
Just because the higher timeframe MA is trending downward does not automatically mean “no buy.”
There may still be a possibility to break above the MA, so after a closer approach, confirm price action and the 15-minute chart (M15) structure changes.
STEP 3: Later, BOS▼ reappears
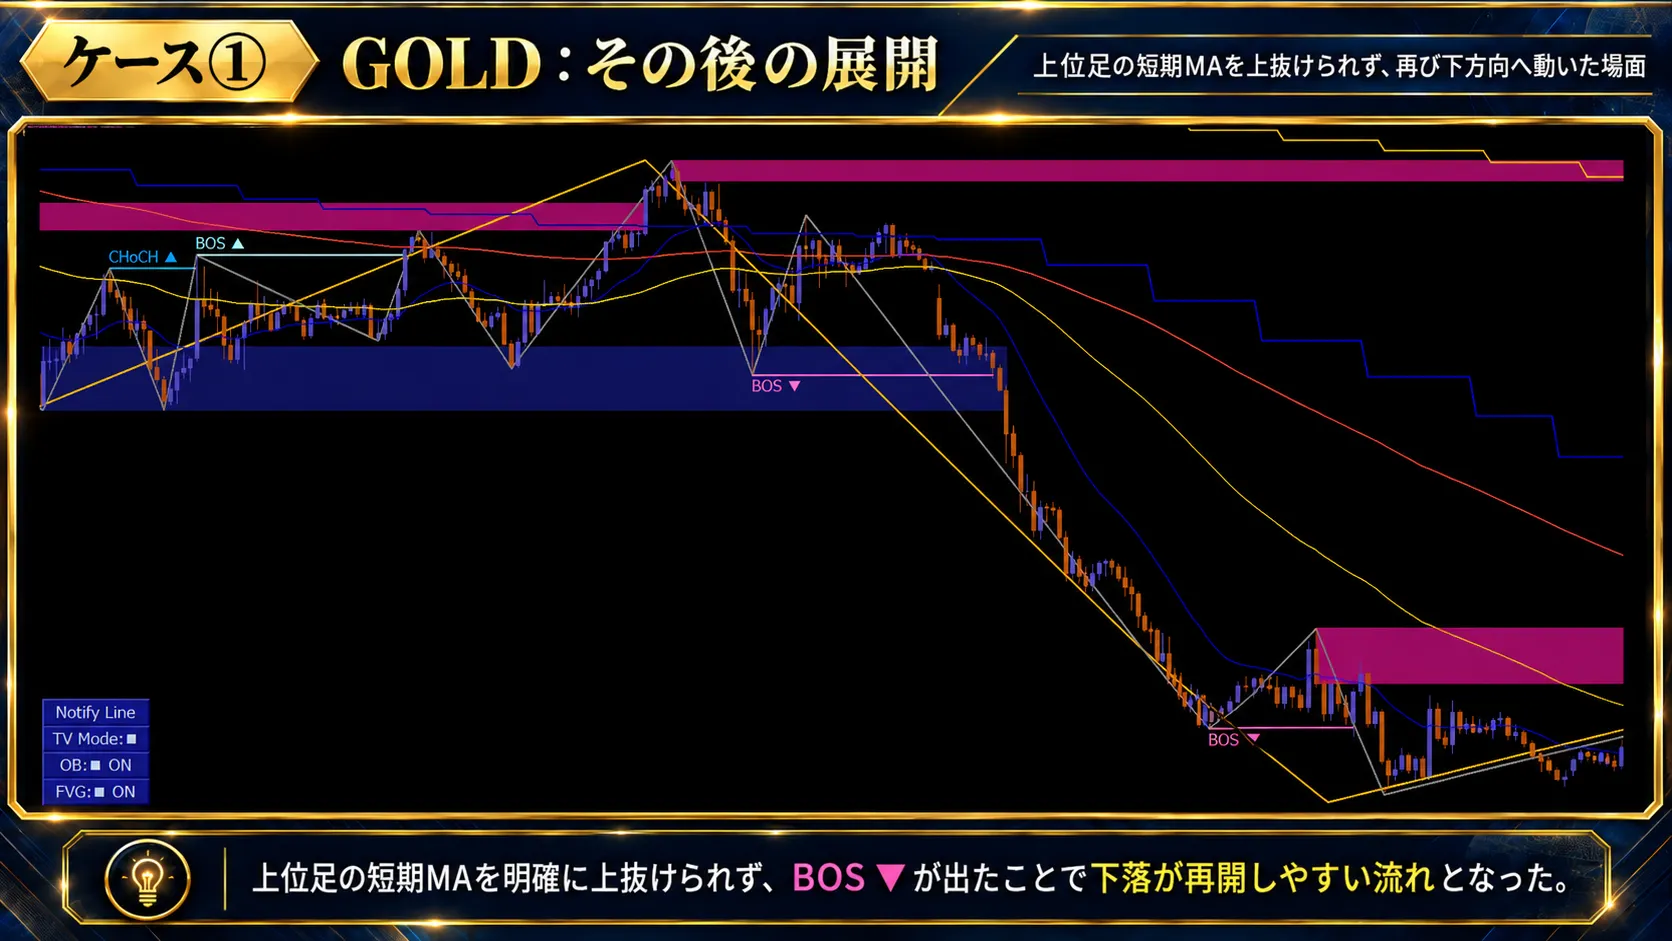
Afterward, price fails to extend higher, BOS▼ appears on the 15-minute chart (M15), and the decline progresses.
What to watch out for is that at the stage of Image②, the decline had not been definitively established.
Instead of retrospectively thinking “I should have sold,” the key is to have recognized the higher-timeframe downtrend and resistance ahead of time and wait for buying conditions to align.
STEP 4: On the 4-hour chart (H4), the scene is part of a larger downwave
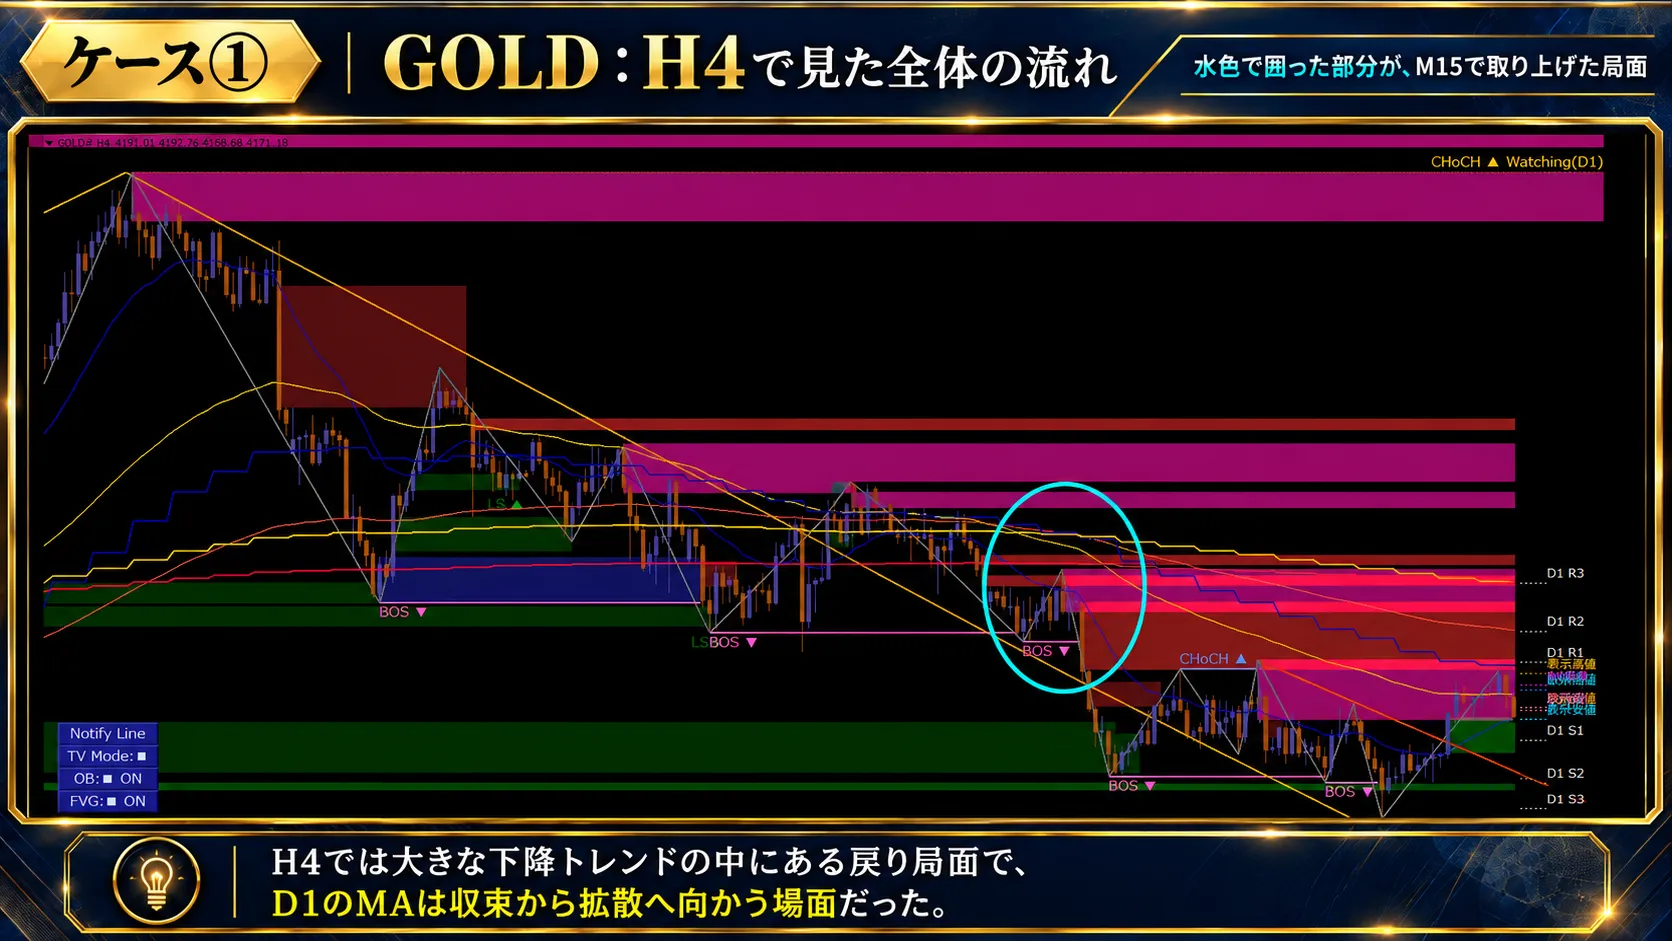
On the 4-hour chart (H4), the scene lies within a large downward wave.
Furthermore, the daily chart (D1) MA is also turning downward, indicating that the upward move on the 15-minute chart (M15) did not necessarily align with the higher timeframe flow.
Takeaway from Case ①: The CHoCH▲ and BOS▲ on the 15-minute chart (M15) indicate upward structure changes, but they do not mean “the higher timeframe downtrend is over.”
03 / CASE 02
Execution timeframe continues to decline, but support candidates overlap
Next, if you chase only downward signals, you may miss the chance of a rebound.
STEP 1: On the 15-minute chart (M15) the downward CHoCH/BOS persist
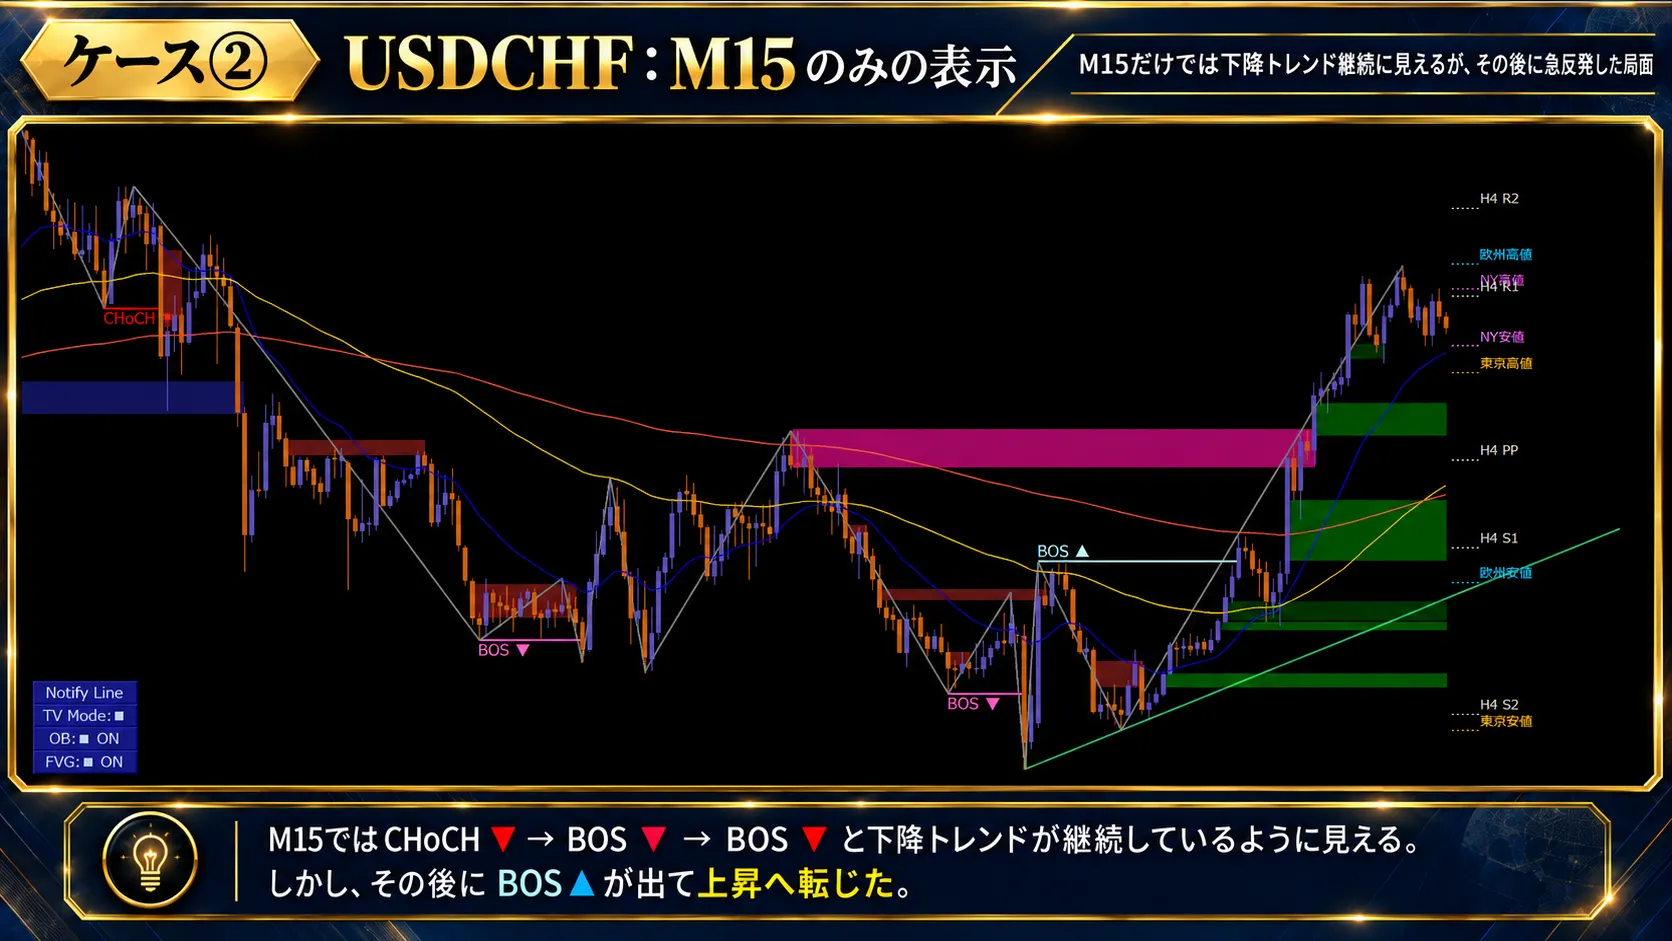
On the 15-minute chart (M15), after a CHoCH▼ then BOS▼, the subsequent BOS▼ suggests a downward bias.
However, price rebounds from the lows and subsequently BOS▲ appears as well.
Why was selling after continued declines dangerous?
Let’s overlay higher-timeframe information.
STEP 2: The 4-hour chart (H4) MA, local lows, and Pivot are in proximity
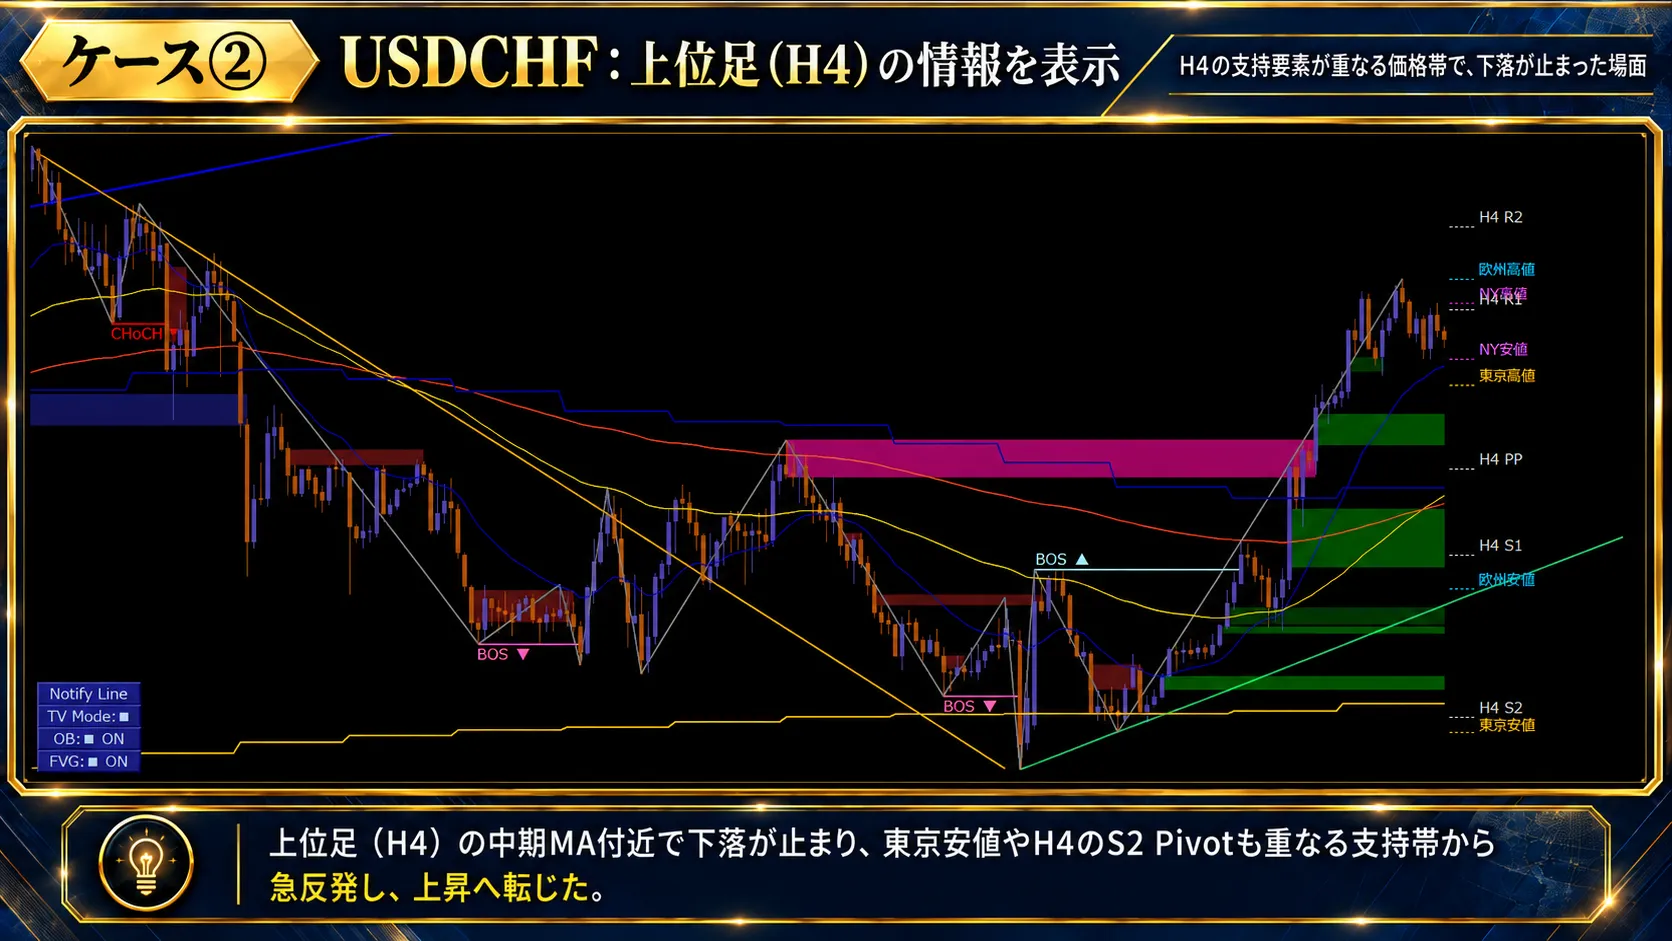
Near where the decline halted, there were multiple supports: the 4-hour MA, Tokyo session lows, and the H4 S2 Pivot.
These do not guarantee future rebounds but are price zones to watch when considering new sells.
The important point is not to fit the reason after a rebound, but to assess whether you could identify the proximity to support as price approaches.
From the moment price nears a support candidate, can you grasp their positional relationships?This is the point of verification.
Case② takeaway: This case does not mean “the entire 4-hour chart (H4) was in an uptrend.”
Where higher-timeframe support elements cluster, it is important not to rush to sell based solely on the 15-minute chart’s downward signals.
04 / THE CHECKLIST
Four confirmations to avoid jumping in on signals alone
“Direction judgment” and “entry decision at that price” are separate.
Being too close to important price levels or having already extended price ranges can also be a reason to pass.
05 / ABOUT DWM
DowWave Marker helps organize market structure
The charts in this article use an indicator that visualizes market structure based on Dow Theory“DowWave Marker (DWM)”.
The core of DWM isvisualizing trend structure with CHoCH and BOS.
By overlaying higher-timeframe MA, ZigZag, major highs/lows, prior day/week highs/lows, market highs/low, Pivot, etc., it aids environment recognition across multiple timeframes.
In the SMC Integrated Model, attention areas like Fair Value Gap (FVG) and Order Block (OB) can also be displayed, with Candle Range Theory (CRT) and Cluster Early Trigger (CET) as additional decision aids.
These do not automatically decide buys/sells; they are tools to help discretionary traders organize their analysis.
DOWWAVE MARKER
Look at market structure, wait for pullbacks, and capture trend resumption.
06 / FREE TRIAL
Try it on your own charts with a 14-day free trial
DWM offers a 14-day free trial available for MT4 and MT5.
Since you can use the SMC Integrated Model as well, you can see how market structure and higher-timeframe information are organized on the assets and timeframes you usually view.
Product details:MT4 version/MT5 version
07 / CONCLUSION
Summary|Confirm the position of the waves, not just the direction
Even if the 15-minute chart (M15) shows an upward CHoCH/BOS, the 4-hour chart (H4) may show a retracement within a downwave.
Conversely, even if the 15-minute chart (M15) continues to decline, higher-timeframe support candidates may be waiting nearby.
By considering higher-timeframe trends, key price levels, and execution-timeframe structure changes all at once, you have options beyond “enter now”: you can “wait for a reaction” or “pass.”
Check market structure, wait for pullbacks, and capture trend resumes.
In the DWM Practice Chart Analysis Series, we will continue to explain this approach with concrete charts.