

Aim for SILVER's rebound and protect the extended profits. From pair expansion to the 15-minute chart contraction
After buying, it moved in the expected direction. Yet, as we waited for it to “perhaps go a bit further,” the unrealized gains nearly disappeared. Compared with the time spent deciding the entry, hasn’t the time to decide the exit shortened?
If you want to use the expansion of BB as a trigger, you should also consider what to watch after buying and what to hold. Here we look at SILVER as of September 25, 2026, examining the rationale for targeting a short-term pullback and the points to verify to protect the extended profits.
First, aiming for a short-term pullback
First, at 09:00 UTC, and 18:00 Japan time, we organize the criteria. The four-hour close confirmed at this point is about $64.56. The BB baseline in a downtrend was below around $64.97. The confirmed value for the four-hour chart at 08:30 is information that is not yet known.
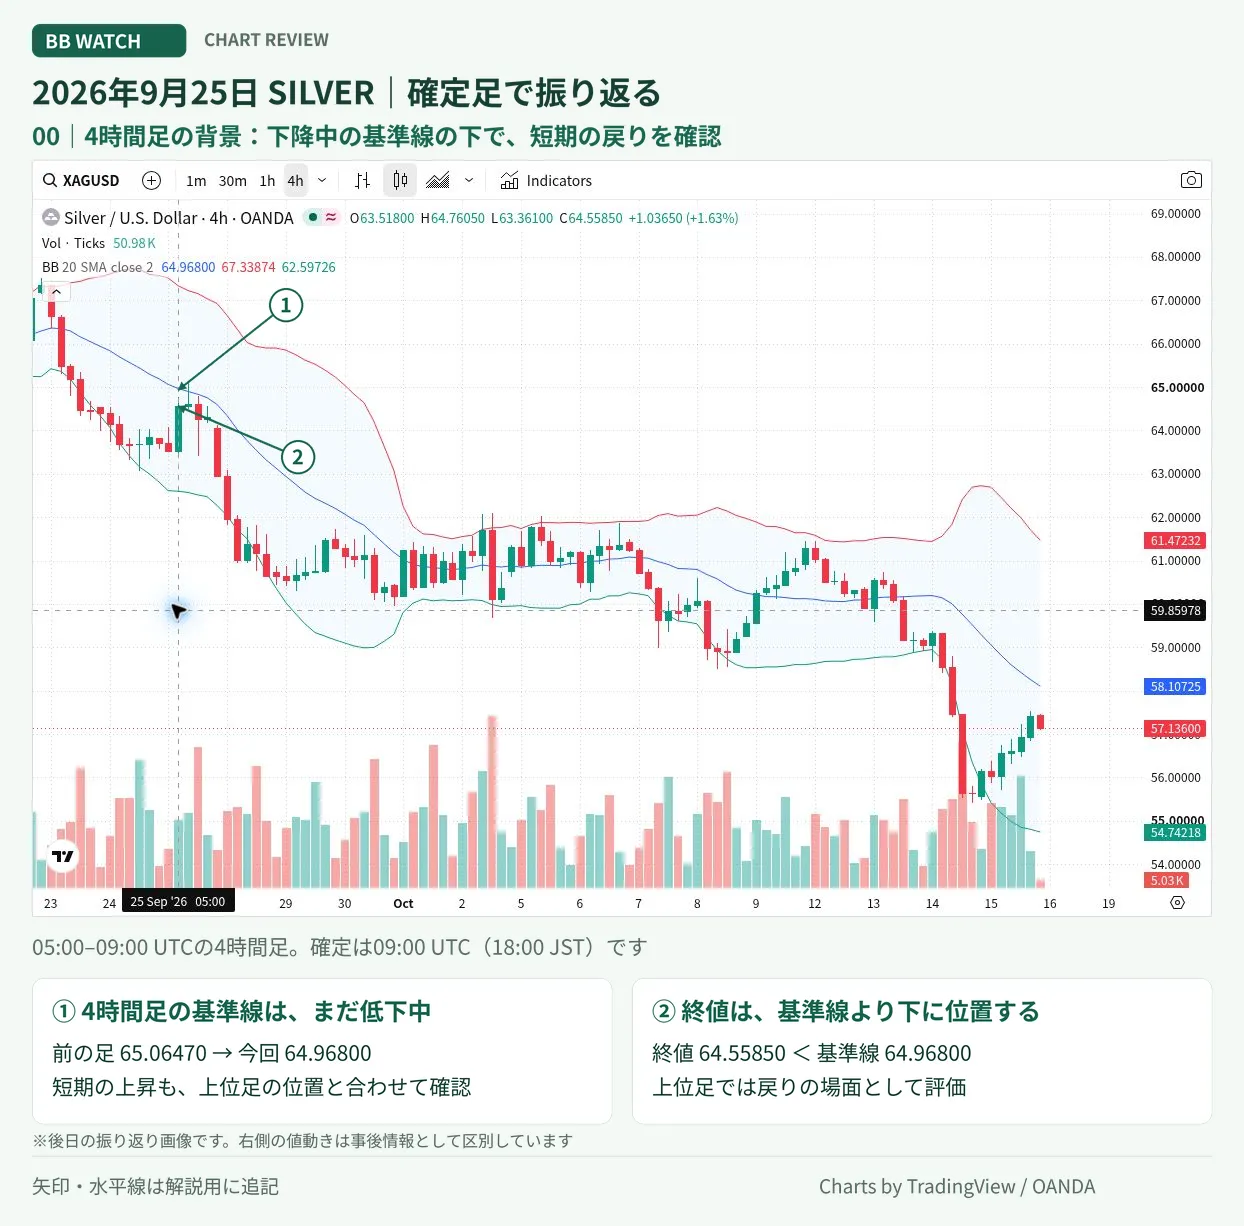
What we target here is a wave turning upward within the downtrend. Since there is a baseline around $65 above, if you are buying anew, you compare the remaining distance to there with your stop-loss width. The baseline moves with price action, so it is not treated as a fixed take-profit price.
Before thinking “it’s already rising enough to take more,” confirm where to buy. Even with the same rise, the early stage and the much larger rise have different room for accepted risk.
Breakout and expanding BB on the pair’s timeframe
The immediate upper target was around $64.09 indicated by the 1-hour chart starting at 01:00 UTC. The 15-minute chart closes around $64.18 starting at 08:15, and this high is exceeded by the close.
However, this bar will have its confirmation at 08:30 while the 1-hour chart is still forming. This time we will compare the 1-hour chart starting at 08:00 with the 15-minute chart starting at 08:45 at the confirmed point of 09:00 UTC.
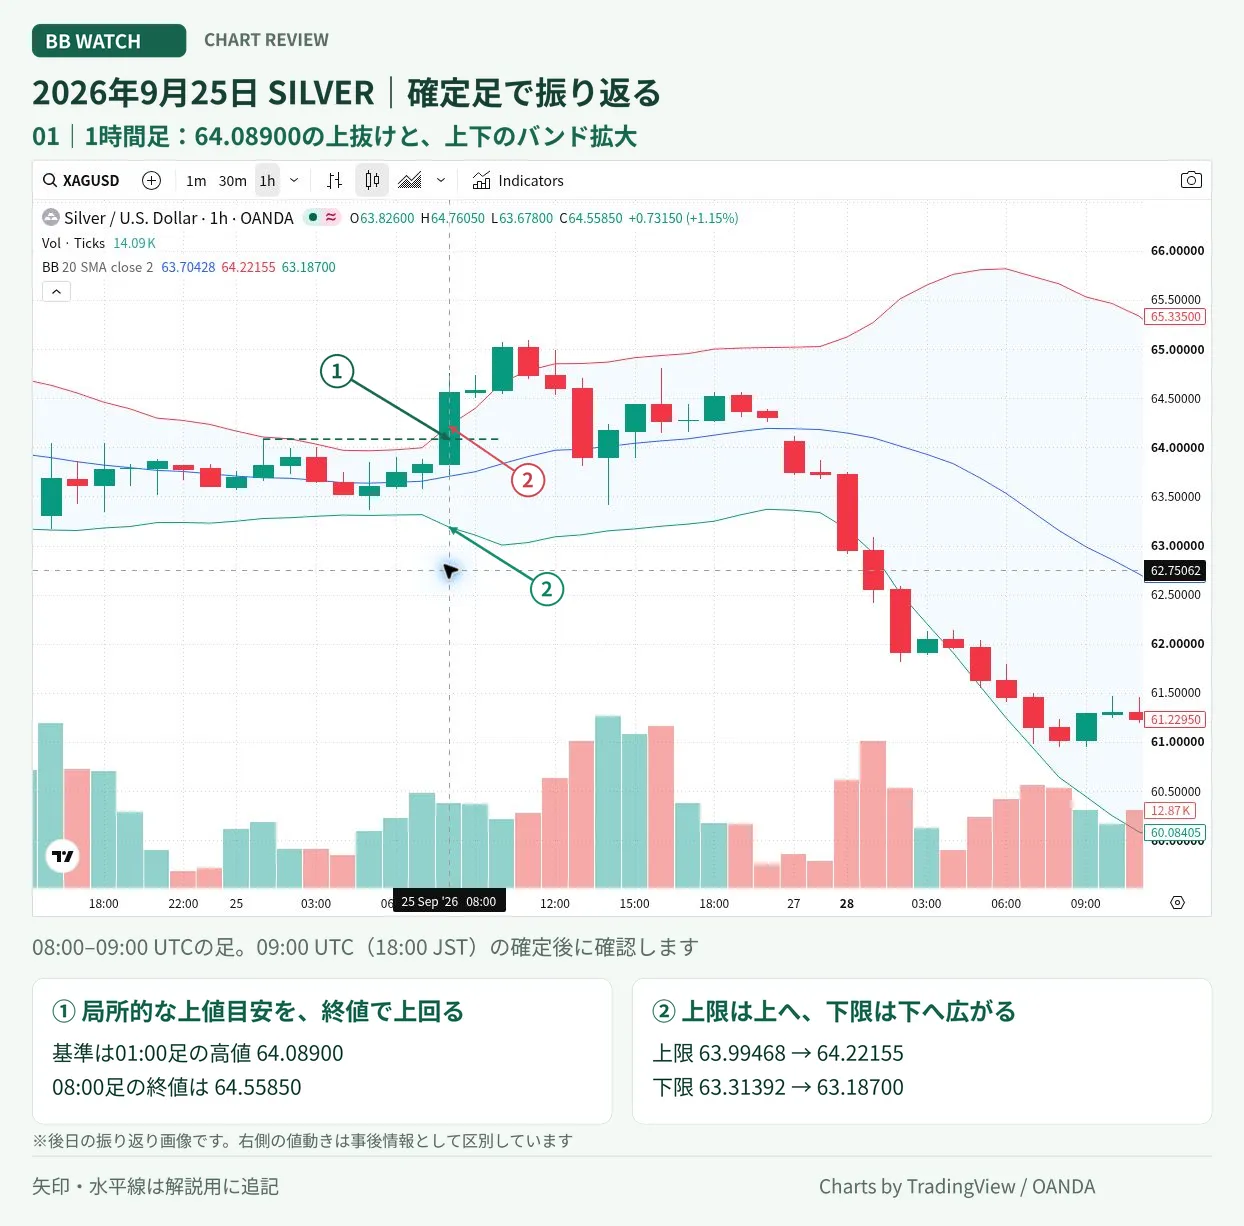
On the 1-hour chart, the upper band rose while the lower band fell compared to the previous bar. The 15-minute chart also shows the upper limit rising and the lower limit falling. This is a situation where expansion in both directions can be observed.
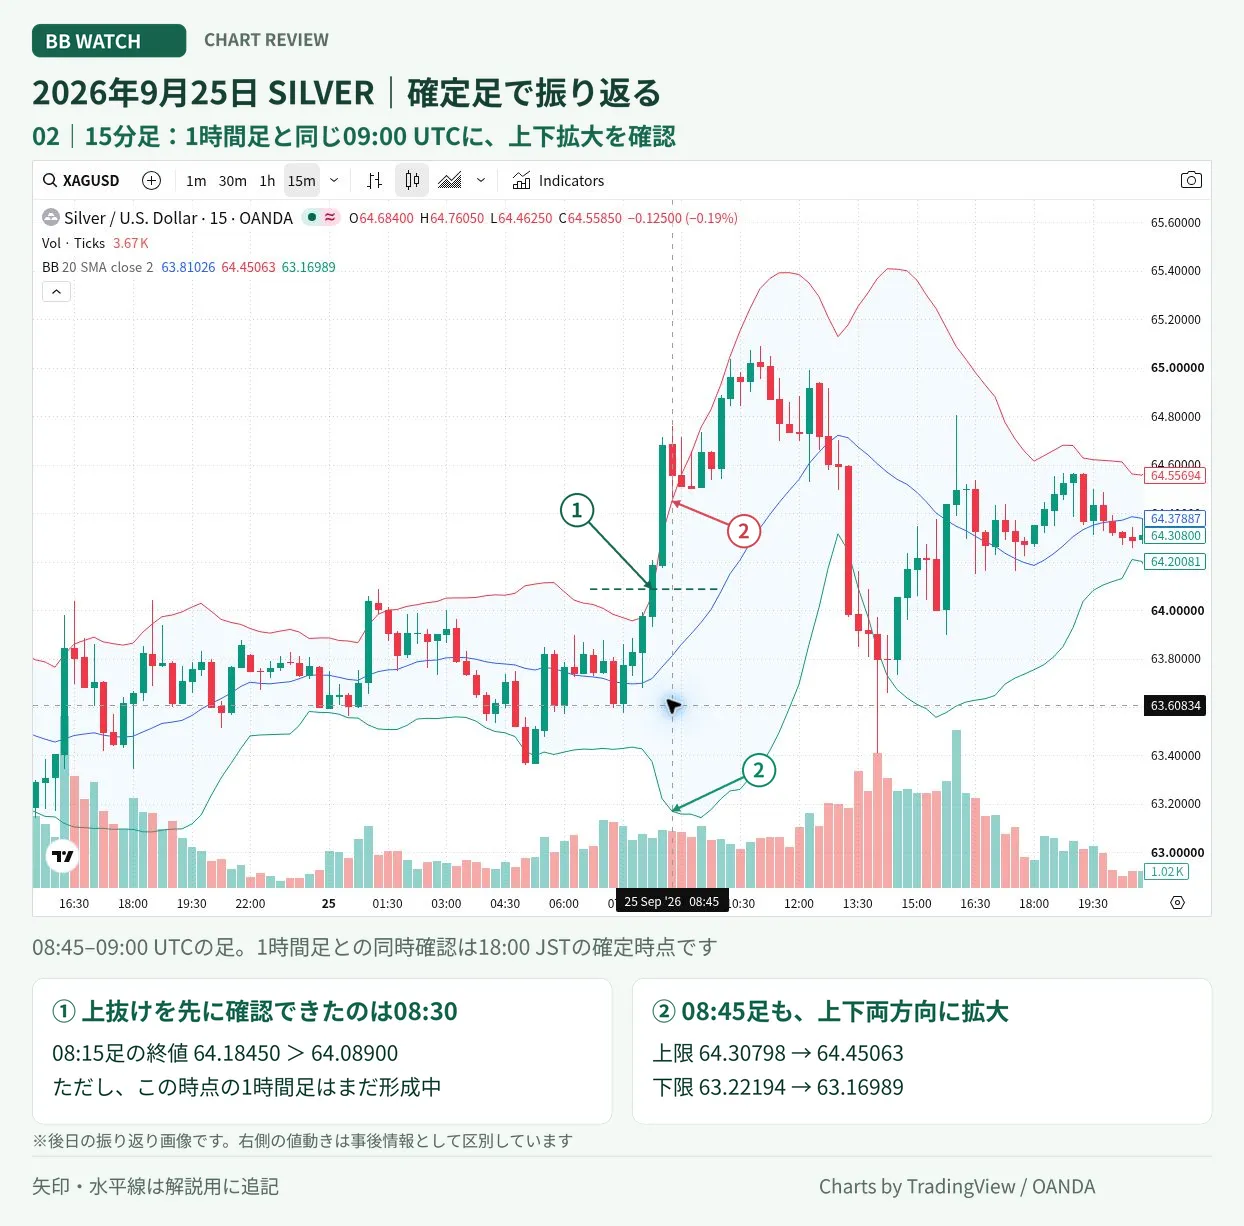
The rationale to buy is the breakout of the recent high coinciding with expansion on the pair’s timeframe. On top of that, keep in mind that the pullback is ongoing on the four-hour chart. Seeing momentum and the position on higher timeframes together makes it easier to decide the target price range.
BB Watch can be used to compare such multi-timeframe changes. Instead of just focusing on the breakout price, use it to check whether expansion is also appearing in the pair you normally use.
After the rise, follow the 15-minute chart’s changes
Then the 15-minute chart starting at 11:00 UTC rose to about $65.09. This price was verified afterward. It should not be used as the target price you knew at the time of setting up the trade.
An example of judging profits to protect is the BB width afterward. On the 15-minute chart starting at 11:45, BB width shrank from about $1.90 to about $1.80. The upper bound stayed almost flat, while the lower bound rose. This bar confirms the BB width narrowing at 12:00.
If you were aiming for a short-term pullback, there is a way to consider partial profit-taking or raising stops at this point. Don’t decide the reversal solely on shrinking; check whether you have approached the target profit range and at what price level you would exit the holding.
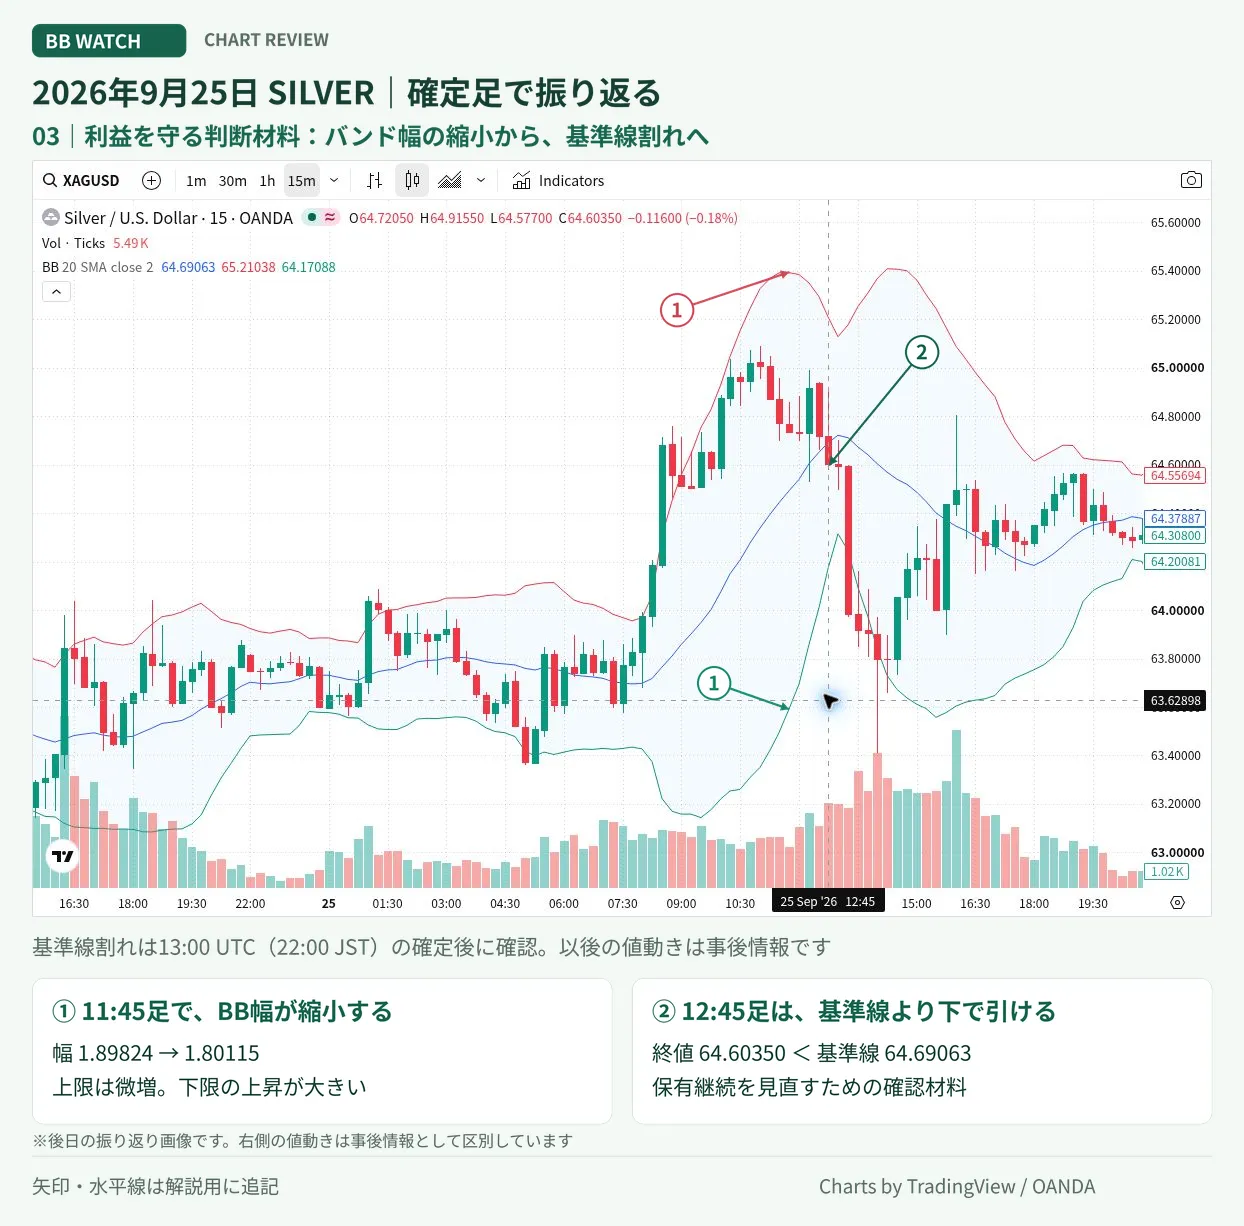
The subsequent bar starting at 12:45 closed around $64.60 and fell below the baseline around $64.69. By the confirmed point at 13:00, you can see the BB width narrowing and a break below the baseline. Setting exit rules in advance, such as closing remaining buys if these conditions occur, helps reduce the time spent hesitating while watching unrealized gains.
The stall after returning near the four-hour baseline cannot be definitively attributed to the baseline being the cause of the decline. Here we view it as an example of reviewing holdings in response to changes on the higher timeframe, considering the position of the higher timeframe.
Choose the pair according to the wave you’re aiming for
This time we used 1-hour × 15-minute charts. If aiming for shorter waves, use combinations like 5-minute × 1-minute that fit your usual method. Confirm the pair’s expansion at entry, and while holding, monitor the shorter-timeframe contractions and price breakdowns. This keeps entry, exit, and profit management in the same flow.
If you’d like to organize the timing for re-evaluating the entry reason and the holding while comparing multiple timeframes, please refer toBB Watch product pagefor display and usage instructions. The concept of pair expansion is also described inan article explaining the BB mechanism.
Chart conditions
OANDA’s XAGUSD, shown on TradingView. BB uses a 20-period, SMA, close, ±2σ. Times are UTC; Japan time is UTC+9. The 1-hour chart from 08:00–09:00 and the 15-minute chart from 08:45–09:00 were compared at the same confirmation point. The image is a later retrospective. Up to the time when the pair’s expansion started aligning on the chart, the figures have not been reconstructed. The decision during the bar depends on your usual trading rules. Charts by TradingView. Source:TradingView
The trading explanations are exploratory examples. BB Watch does not place orders and does not guarantee profits.