

Before deciding to pass it off as "might be another trick." Capture GOLD's breakout in the 1-hour and 15-minute charts
I had already decided where I wanted to buy. Even so, when the price breaks out, my hands hesitate with thoughts like "it may come back." After watching for a while, only the intended wave advances forward.
What I want to see in such moments are price movements that break resistance and the BB expansion on the pair's timeframes. This time I will use GOLD as of October 9, 2026 to look at where to consider buying and what to base the targeting of that wave on.
First, decide which wave you want to capture
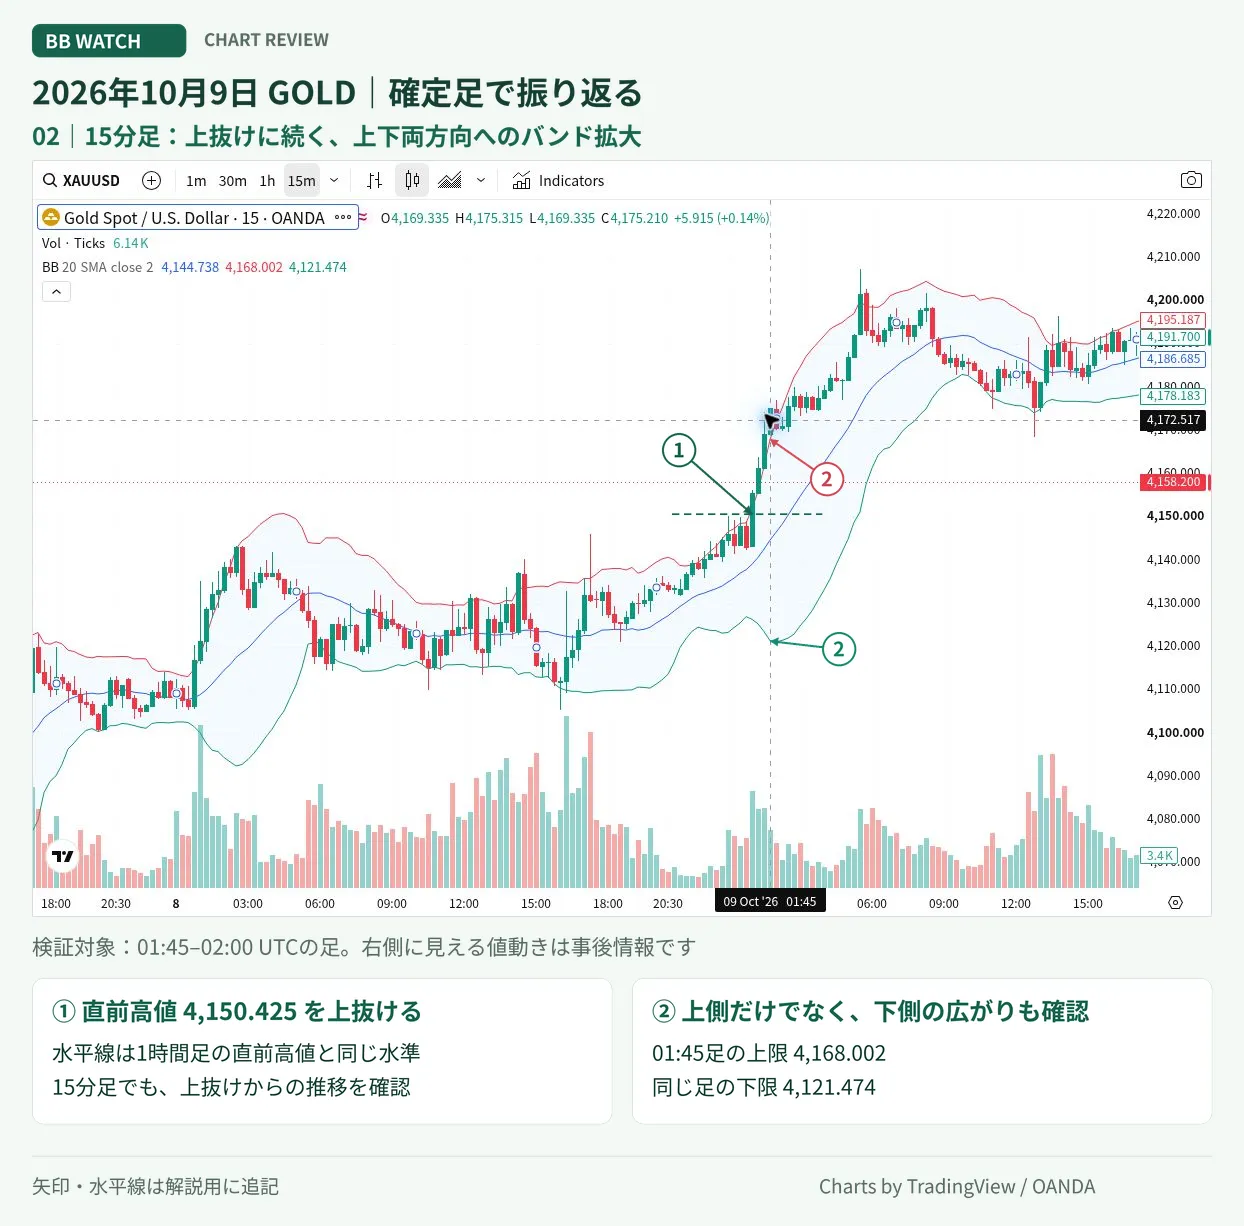
On the 4-hour chart, after late September’s decline, the market continued to oscillate up and down. The target this time is the wave that retraces from a recent low. Rather than assuming a big uptrend has begun, think of it as a moment to grab the move beyond nearby resistance.
Above, the high of 4,227.530 dollars reached on October 2 remained. If you have a target for the upside before buying, you won’t greedily think “it should rise forever” after the extension.
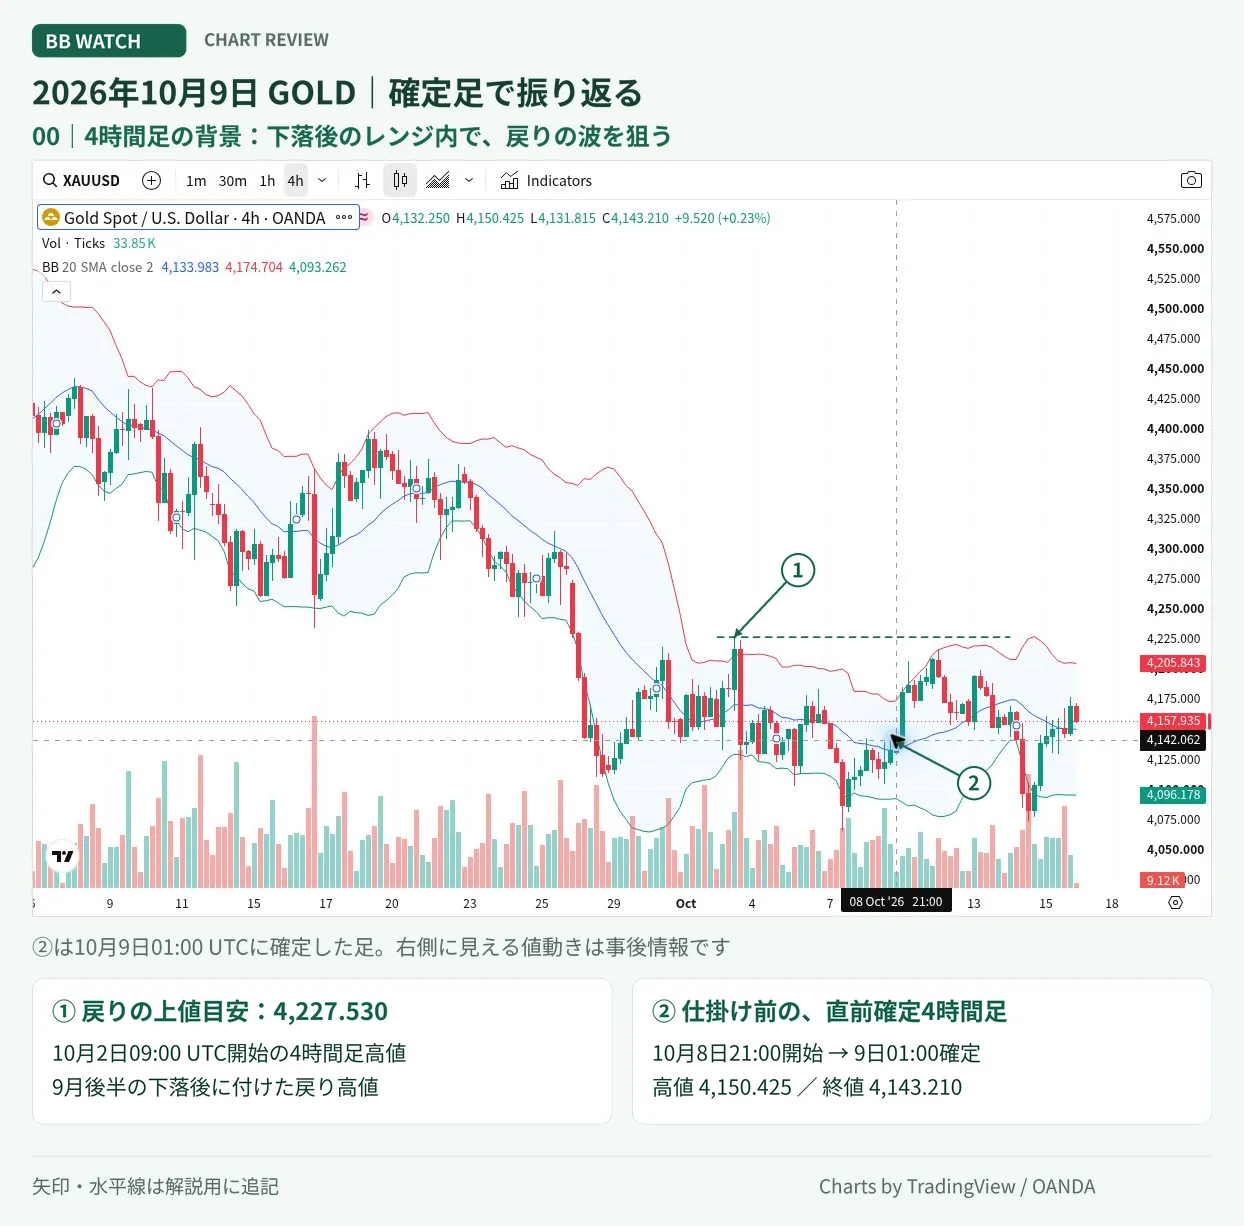
Next, narrow down the entry points using the 1-hour and 15-minute charts. The 1-hour chart starting at 00:00 UTC on October 9 rose to 4,150.425 dollars and then closed at 4,143.210 dollars. The vicinity around 4,150 dollars, where it paused, is the next resistance to watch.
It broke the resistance. Is the pair widening at that moment
From 10:00 to 11:00 on October 9 (Japan time), the price broke above that high on the 1-hour chart. The corresponding UTC times are 01:00–02:00. During this period, the 15-minute chart continued with bullish candles, and on the 1-hour chart, it was confirmed at 4,175.210 dollars at 11:00 Japan time.
In that hour, the BB for the pair also widened. On the 1-hour chart the upper band turned upward while the lower band turned downward. On the 15-minute chart, from the 01:30 to the 01:45 session, the upper band rose and the lower band fell. At 02:00 UTC, the confirmation time of 11:00 Japan time, expansion is visible on both timeframes.
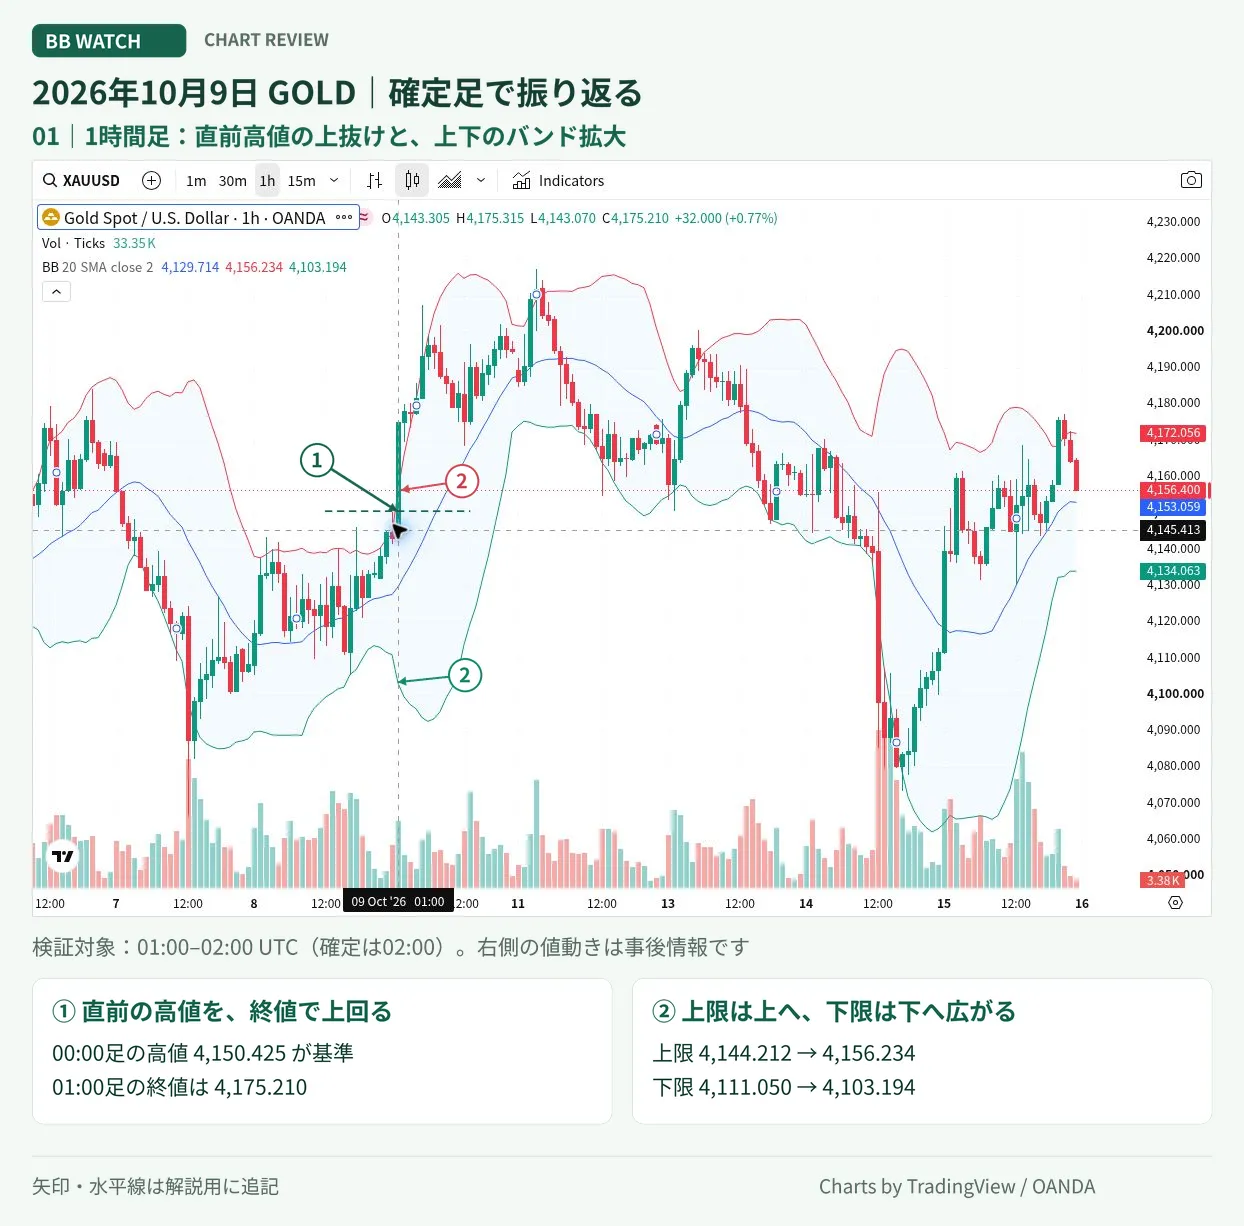
There are three reasons to consider buying here: there is a retracing wave on the higher timeframe I had targeted, the price has broken above the nearby resistance, and the BB has expanded on both legs of the chosen pair. Rather than chasing just because a big bullish candle appeared, you can base your entry on concrete evidence.
BB Watch is used to compare this pair’s changes on the spot. Instead of only looking at the 15-minute chart when the price breaks resistance, also check whether expansion is appearing on the 1-hour chart. It’s a way to add confirmation for your trading rules at the moment of entry.
The times and figures here are reviewed as confirmed data. The exact seconds that synchronized in the market are not reconstructed. Whether you decide to judge from a live bar or wait for confirmation depends on your own trading rules.
Don’t hold on thinking “it will rise more” after you buy
Afterwards, the 15-minute chart starting at 05:30 UTC rose to 4,207.485 dollars. This result was confirmed afterward and was not a target you knew at the time of entry.
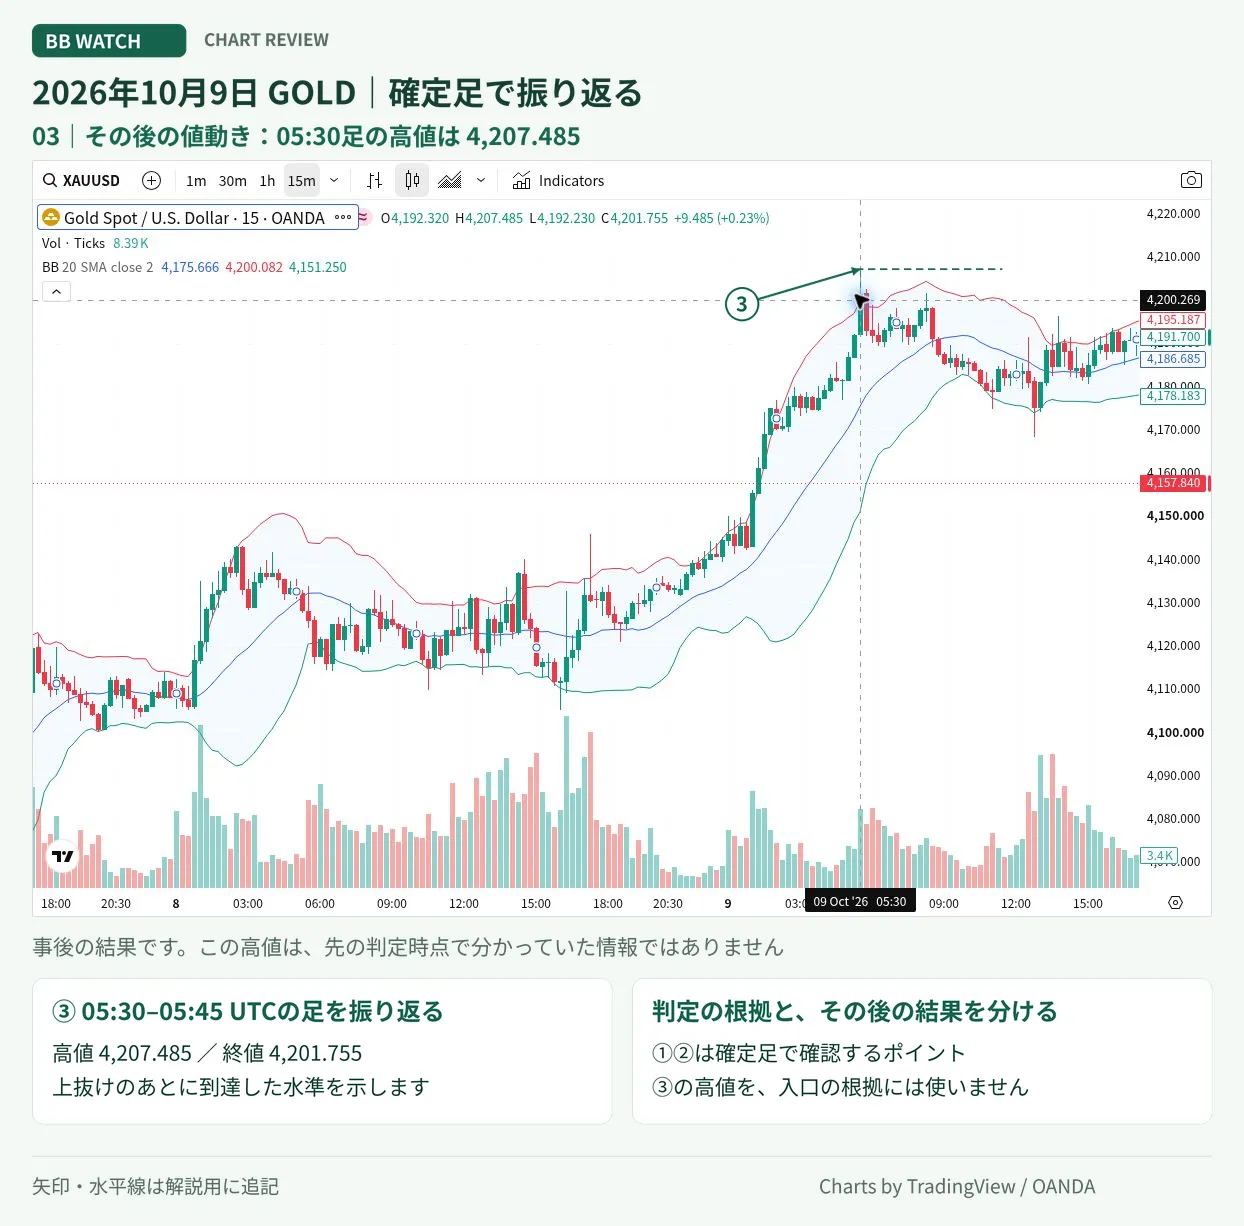
If you’re aiming for this wave, consider entering at the stage of breaking above resistance and monitor whether you can maintain that breakout level. If it quickly returns toward around 4,150 dollars and your stop-loss rules are met, exit. It’s also important not to hold a deteriorating long position just because BB expansion occurred.
Conversely, if the price continues after the breakout, consider holding while watching the distance to the next resistance. If in approaching the upper targets the momentum on shorter timeframes weakens, consider partial profits or lifting stops. Framing entry and exit together helps you focus more on the wave you’re targeting.
Choose pairs that align with your method and are easy to verify
In this case, for one wave on the 4-hour chart, I used the 1-hour and 15-minute charts. For example, if you want to target a shorter wave on the 15-minute chart, you could look at the 5-minute and 1-minute charts. Do not fix the combination; choose according to your usual method and the wave you’re aiming for.
apart from this case, as a routine use, if a resistance is breached but only the lower timeframes widen and the pair does not follow, assess whether the breakout will continue before jumping in. This supports decision-making to avoid traps. Conversely, if the pair’s expansion aligns with the intended moment, you can convert time spent hesitating into time to consider an entry.
BB Watch product page
For those who want to line up BBs across multiple timeframes that fit the target wave and compare the pair’s changes at the moment of resistance breakout, you can check how BB Watch is displayed and used here.
The reason to use the pair’s expansion as trading material is explained inan article that explains the BB mechanismas well.
Chart conditions
OANDA’s XAUUSD, TradingView display. BB period 20, SMA, close, ±2σ. The chart uses UTC; the article’s Japan time is UTC+9. Compare the 1-hour chart from 01:00–02:00 and the 15-minute chart from 01:45–02:00 at the same 02:00 confirmation point. The image is a later retrospective addition, with arrows and horizontal lines for explanatory purposes. Charts by TradingView. Source:TradingView
The buy/sell explanations are examples for consideration. BB Watch does not place orders or guarantee profits.