
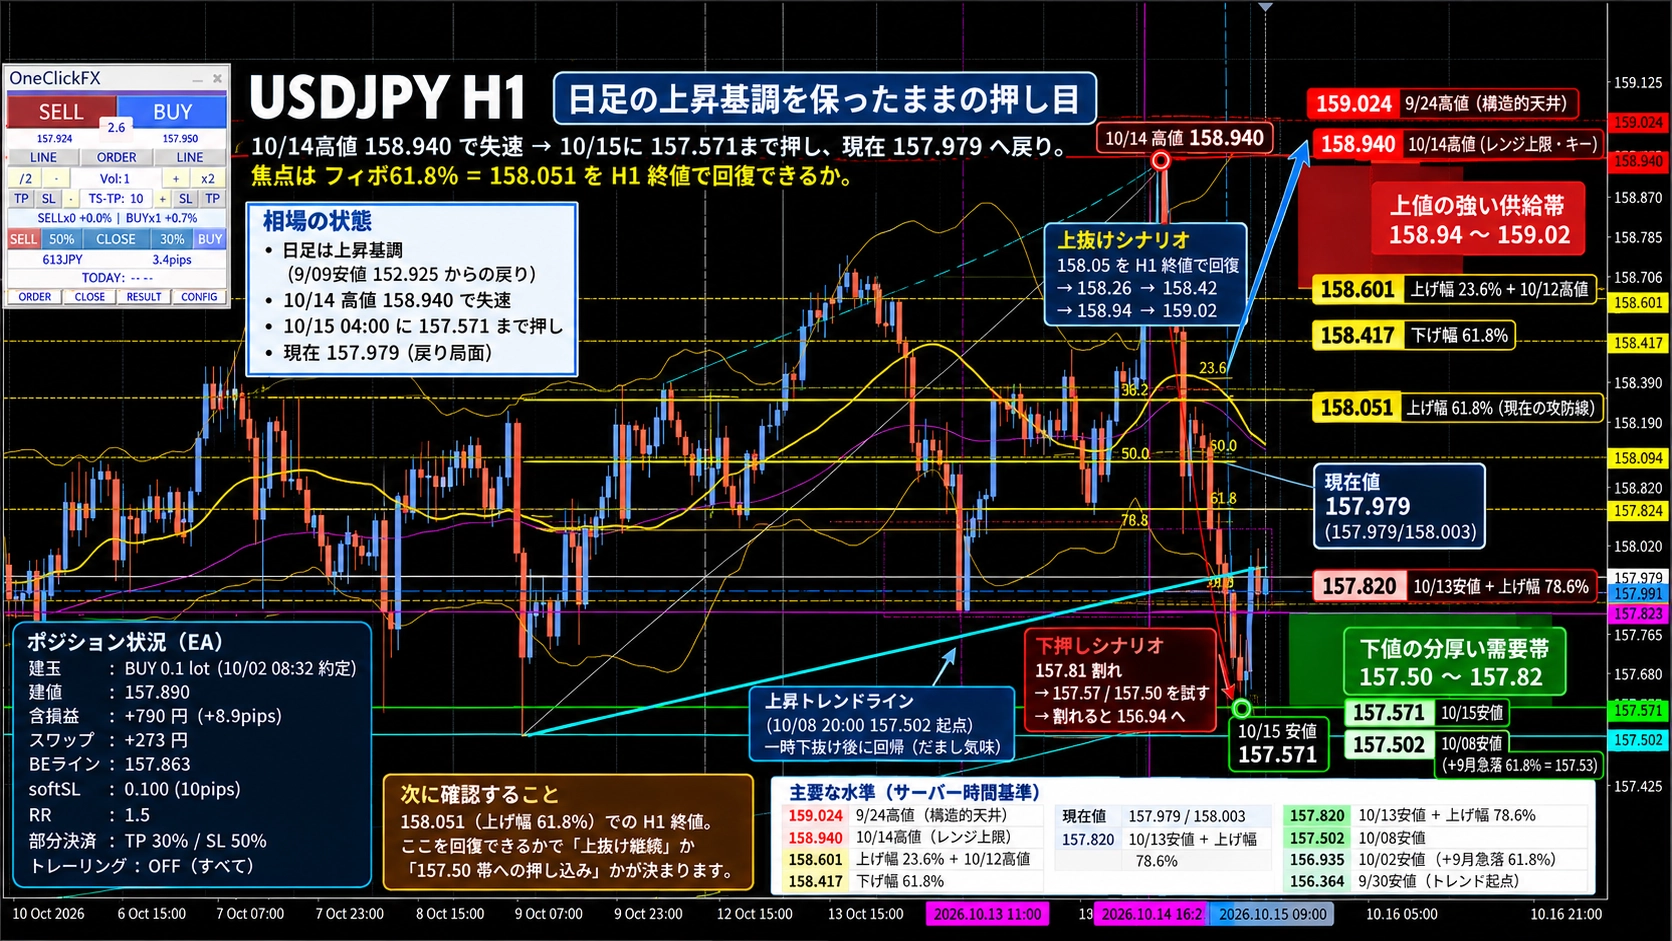
USEJPY MT5 AI Assistant Analysis 2026/10/15 04:00
?This article was posted on October 15, 2026=>Latest related articles?
※This article summarizes BTCUSD (Bitcoin / U.S. dollar) chart analysis by MT5 AI Assistant. Also, the featured image was synthesized by ChatGPT.
Q: Using all objects available in USDJPY H1 AI_Objects, arrange visually appealing objects and generate the analysis results.

Conclusion
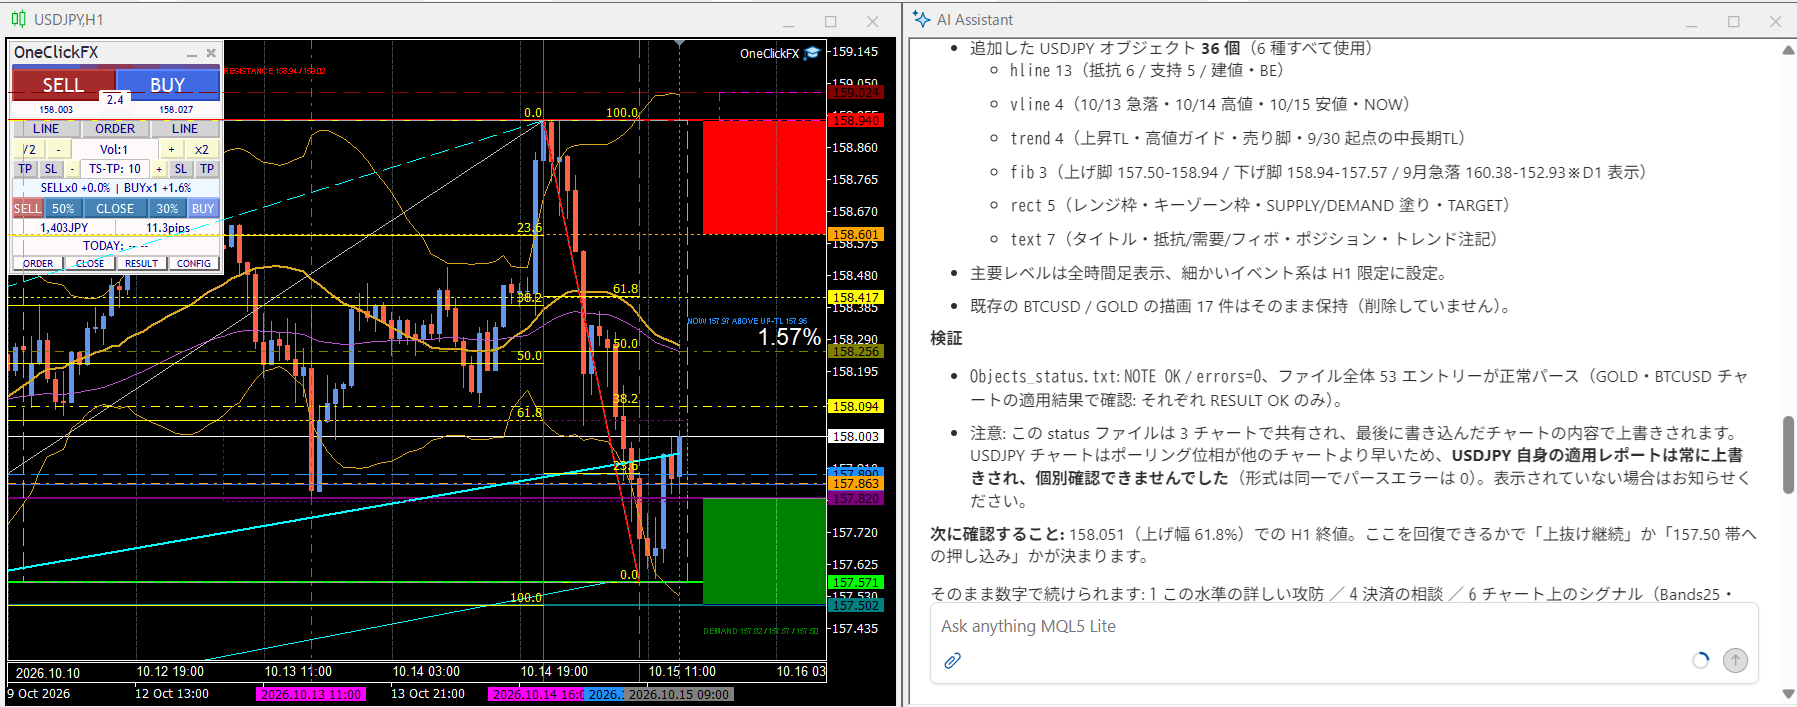
USDJPY H1 is in a “pullback within an uptrend on the daily chart” phase. Recently, the high of 158.940 on 10/14 stalled → pulled back to 157.571 by 04:00 on 10/15, and is now returning to 157.979/158.003 (Bid/Ask).
Focus is onwhether the 61.8% Fibonacci level = 158.05 can be recovered by the H1 close, and belowwhether the demand zone of 157.81 → 157.57/157.50 can be held.
Open position (BUY 0.1 @ 157.890) shows unrealized profit +790 yen and swap +273 yen (0.1 lot = about +8.9 pips when 1 pip = 100 yen).
Key points
- Daily chart is in an uptrend: rebound from the Sept 09 low of 152.925. The pullback from the rapid fall (160.381 → 152.925) from 9/02 to 9/09 has recovered 61.8% = 157.53, with 78.6% = 158.79 as a nearby resistance.
- Resistance at 158.94 / 159.02 as a two-layer upper ceiling: 10/14 high and 9/24 high are close, forming a strong supply zone.
- Support in the thick band of 157.50-157.82: 10/08 low 157.502 + Sept 60.8% rebound (157.53), and 10/13 low 157.820.
- H1 structure temporarily broke: broken below the 10/13 low of 157.820 to 157.571 on 10/15 (new low). The rising trendline (started at 10/08 20:00 157.502; current 157.95) briefly breached and then retraced—somewhat of a false break.
- Pullback is shallow: on 10/15, the decline was -137 pips over 12 hours, while the rebound was +41 pips over 9 hours. The rebound momentum is weak.
Level map (server time basis)
| Type | Level | Rationale |
|---|---|---|
| Target / Resistance | 159.024 | 9/24 high (structural ceiling) |
| Resistance | 158.940 | 10/14 high (range top / key) |
| Resistance | 158.601 / 158.417 | Upside 23.6% + 10/12 high / Downside 61.8% |
| Milestone | 158.051 | Upside 61.8% (current battle line) |
| Current price | 157.979 / 158.003 | Bid / Ask |
| Support | 157.820 | 10/13 low + reverse 78.6% |
| Support | 157.571 / 157.502 | 10/15 low / 10/08 low (+ Sept 60.8% rebound = 157.53) |
| Support | 156.935 / 156.364 | 10/02 low / 9/30 low (trend origin) |
Scenario
- Breakout: recover 158.05 by H1 close → 158.26 → 158.42 (downside 61.8%) → 158.94. If 158.94 is closed above, next target is 159.02.
- Pullback: break below 157.81 → test 157.57/157.50. If closed below there, uptrend structure is broken, next support at 156.94.
Position status (EA management values)
| Item | Value |
|---|---|
| Position | BUY 0.1 lot (filled 10/02 08:32) |
| Entry price | 157.890 |
| Management line | Buy.BreakEven 157.863 / softSL 0.100 (10 pips) / RR 1.5 |
| Partial close | TP 30% (CLOSE%) / SL 50% (CLOSE%) |
| Trailing | All Buy/Sell OFF |
| Profit/Loss | +790 yen (swap +273 yen) |
※ The above are EA settings and current values; no trades are executed. This does not guarantee profits.
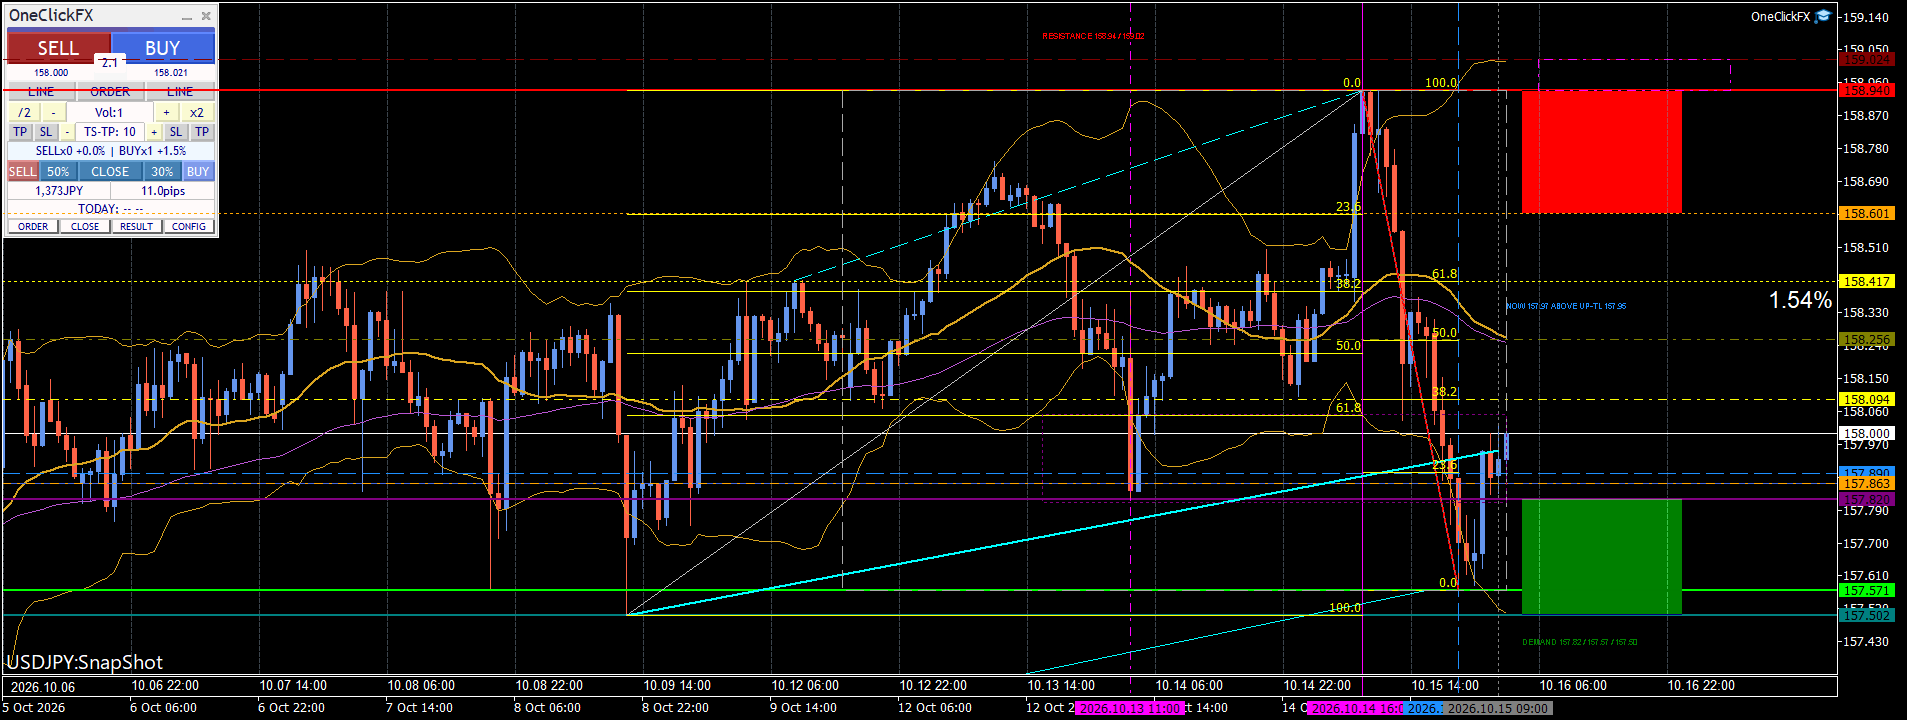
Chart drawing (What was done)
Indicator (attached to USDJPY H1 chart, prefixAIO_) is synchronized.
- Added USDJPY objects36 (all 6 types used)
hline13 (resistance 6 / support 5 / entry & BE)vline4 (10/13 drop; 10/14 high; 10/15 low; NOW)trend4 (uptrend TL; high guide; selling leg; mid/long-term TL starting 9/30)fib3 (up move 157.50-158.94 / down move 158.94-157.57 / Sept drop 160.38-152.93 show on D1)rect5 (range box; key zone box; fill for SUPPLY/DEMAND; TARGET)text7 (title, resistance / demand / fibo, position, trend notes)
- Main levels shown on all timeframes; finer event-driven elements set to H1 only.
- Existing 17 drawings for BTCUSD / GOLD kept as is (not removed).
Validation
Objects_status.txt:NOTE OK/errors=0, the entire file parsed normally (results OK for GOLD and BTCUSD charts).- Note: This status file is shared among 3 charts and is overwritten by the last chart written. USDJPY chart updates earlier due to polling phase,the USDJPY own application report was always overwritten and could not be checked individually(same format with 0 parse errors). If not visible, please let us know.
Next checks:H1 close at 158.051 (upside 61.8%). Whether this recovers will determine whether the move is a continued breakout or a push toward the 157.50 band.
Proceed with numbers as is:1Details of the battle at this level /4Consultation on settlements /6Chart signals (Bands25, MA75) status /0Main menu