
Nintendo CFD, breaks above the resistance band—a sign of a bottoming? The two levels to watch next
Nintendo CFD Breaks Through Resistance — A Sign of Bottoming Out? Two Levels to Watch Next
Target:7974.TSE / Nintendo CFD / M5
Photograph Date:October 9, 13, 14, 2026
Focus This Time:After breaking through the resistance zone, will the old resistance turn into support? Can the next upside band be surpassed?
Introduction — Oct 14, a Step Beyond the "Rebound"
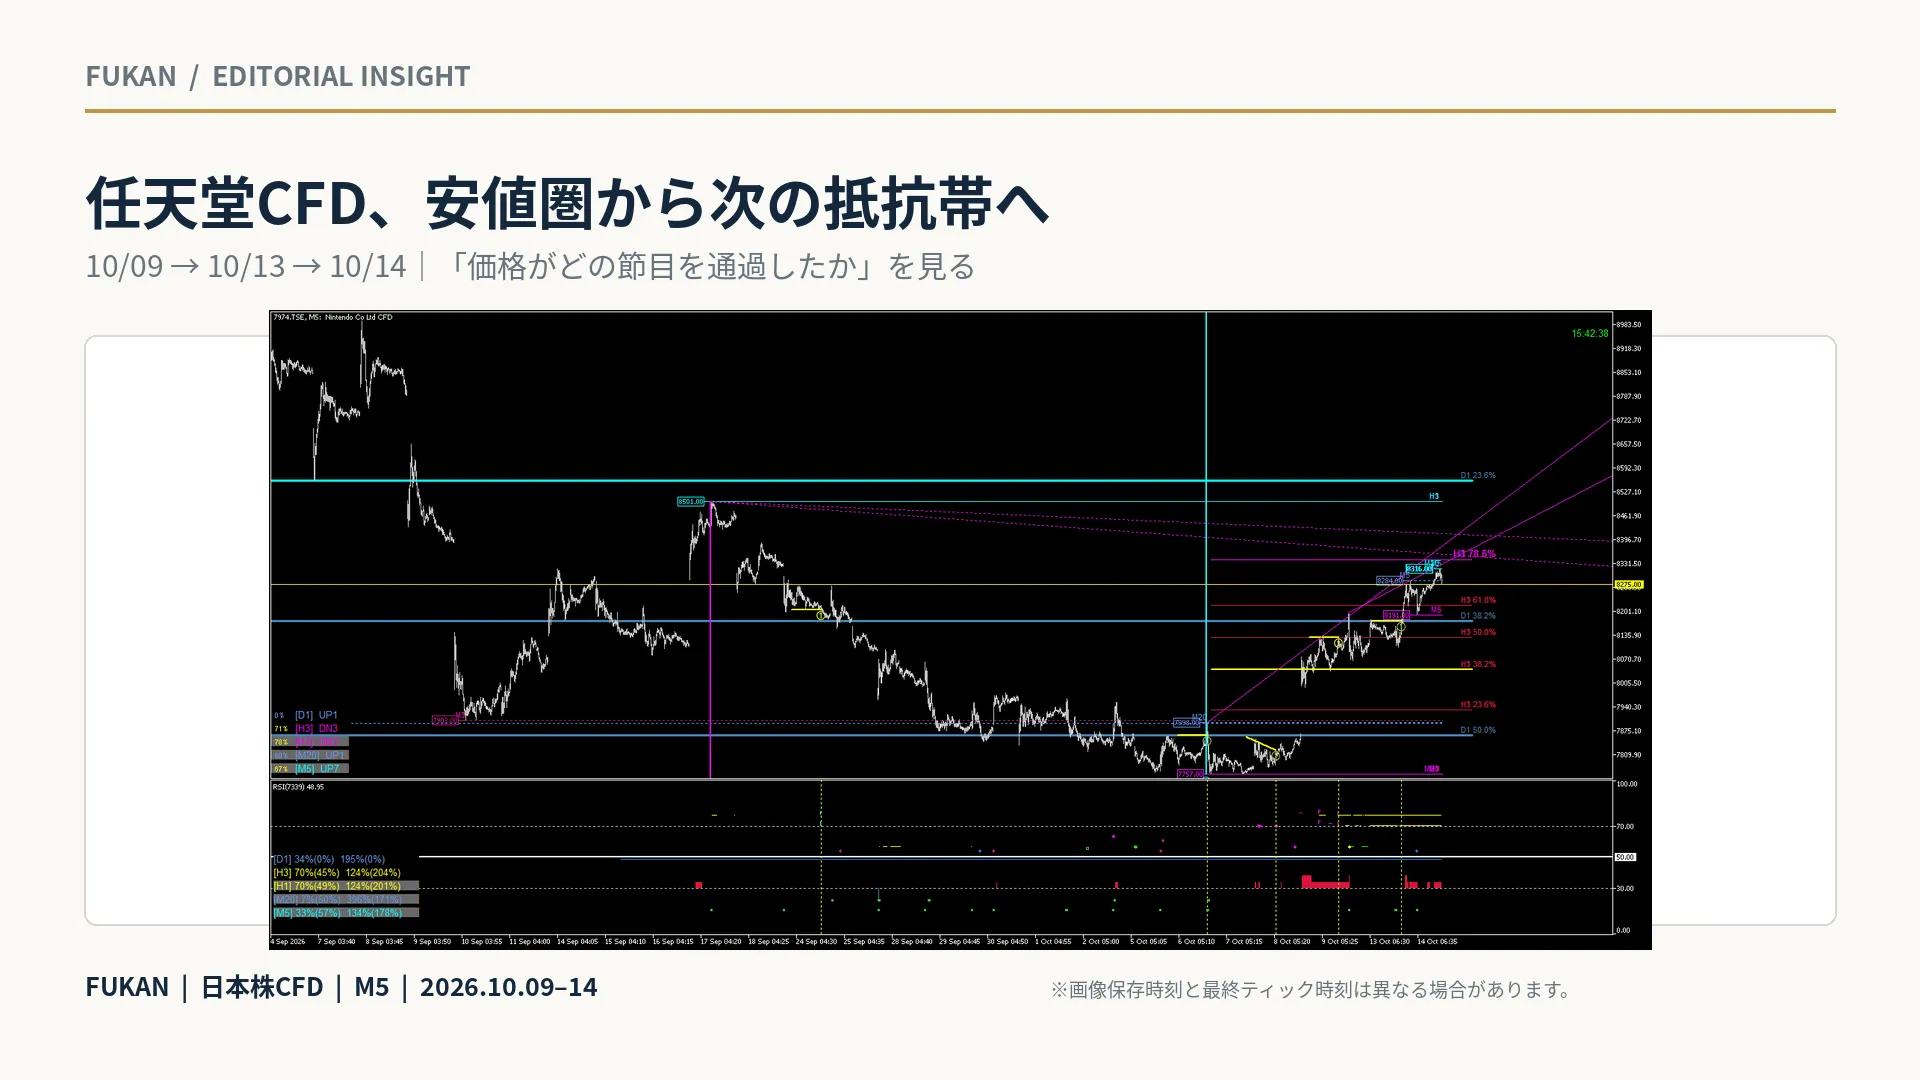
From the swing low around October 6 at 7,757, Nintendo CFD rebounded and repeatedly tested the levels that had constrained upside on October 9 and 13, and in the saved image for October 14, price moved above the resistance zone near 8,275.
At this point, there is growing speculation that the bottom may be forming.
However, we are not yet at a stage where a definitive bottom is confirmed. What matters is whether the resistance zone broken this time will turn into support, and whether the next upside band can be exceeded.
1|October 9 — Rebound from the Low Range, First Wall near 8,139
In the saved image at 15:44:14 on October 9, price recovered from the late around 7,757 on October 6. Yet, there is a horizontal band near 8,139 on the right edge, which remained as the first major wall for the rebound.
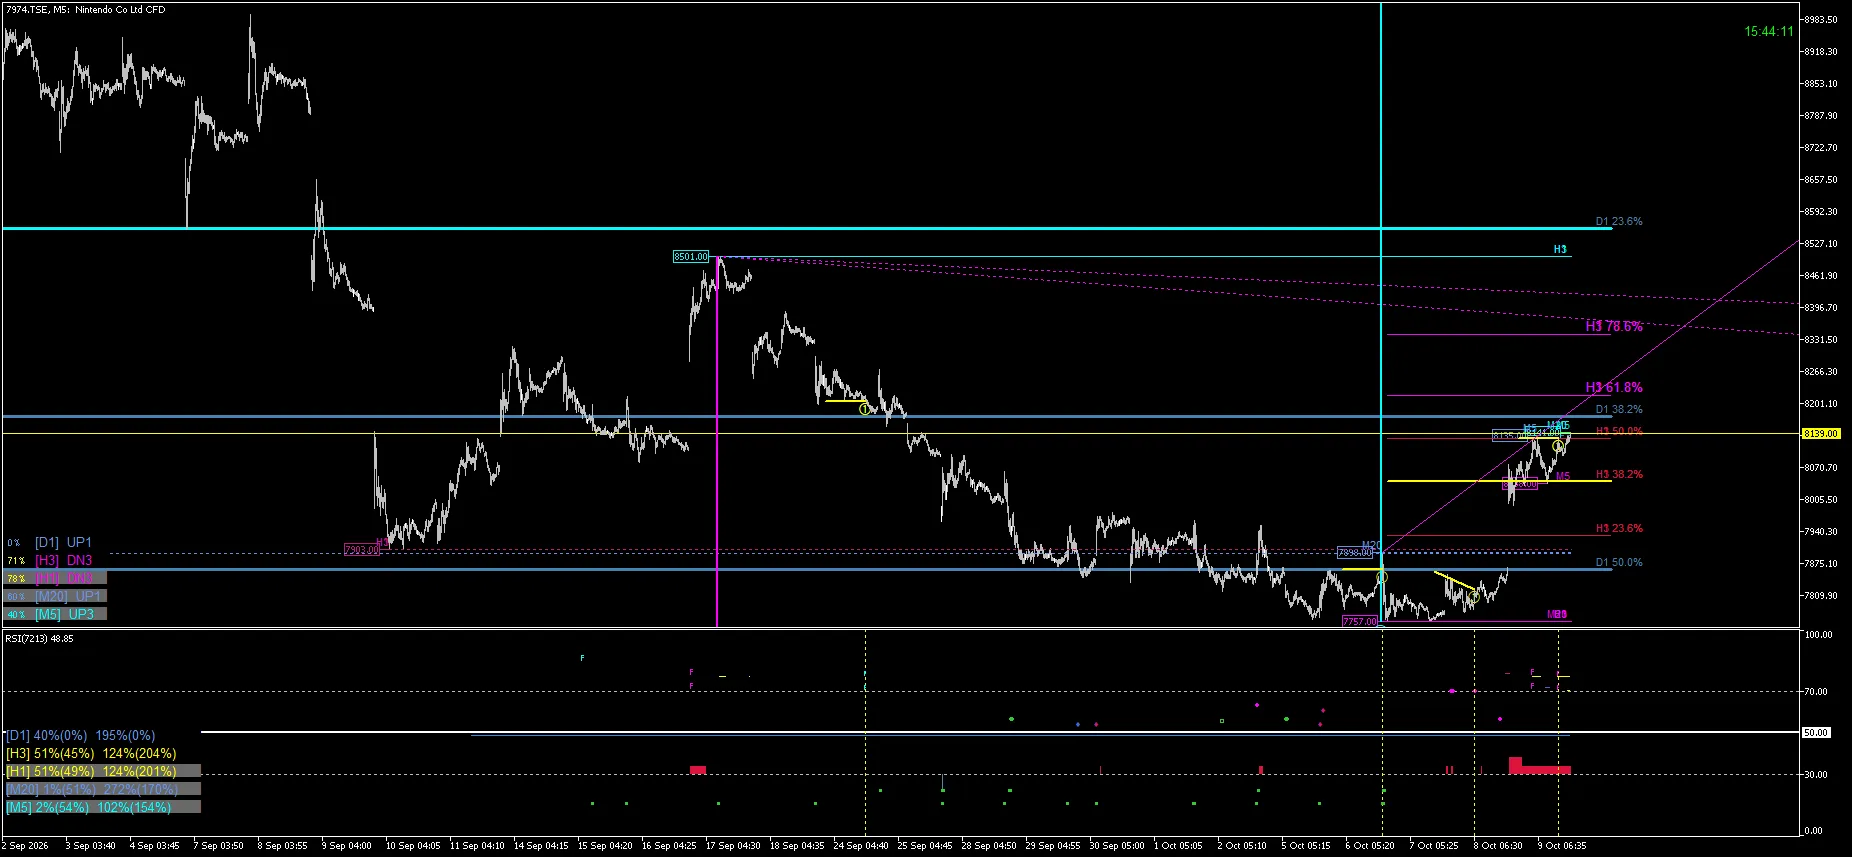
At this point, it is clear that price rebounded from a low, but it has not clearly surpassed the upper resistance. A rebound from a low and a reversal from a downtrend are not yet the same thing.
2|October 13 — Testing the Same Resistance Band Again
In the image saved at 15:18:35 on October 13, price is again near the horizontal zone around 8,139.
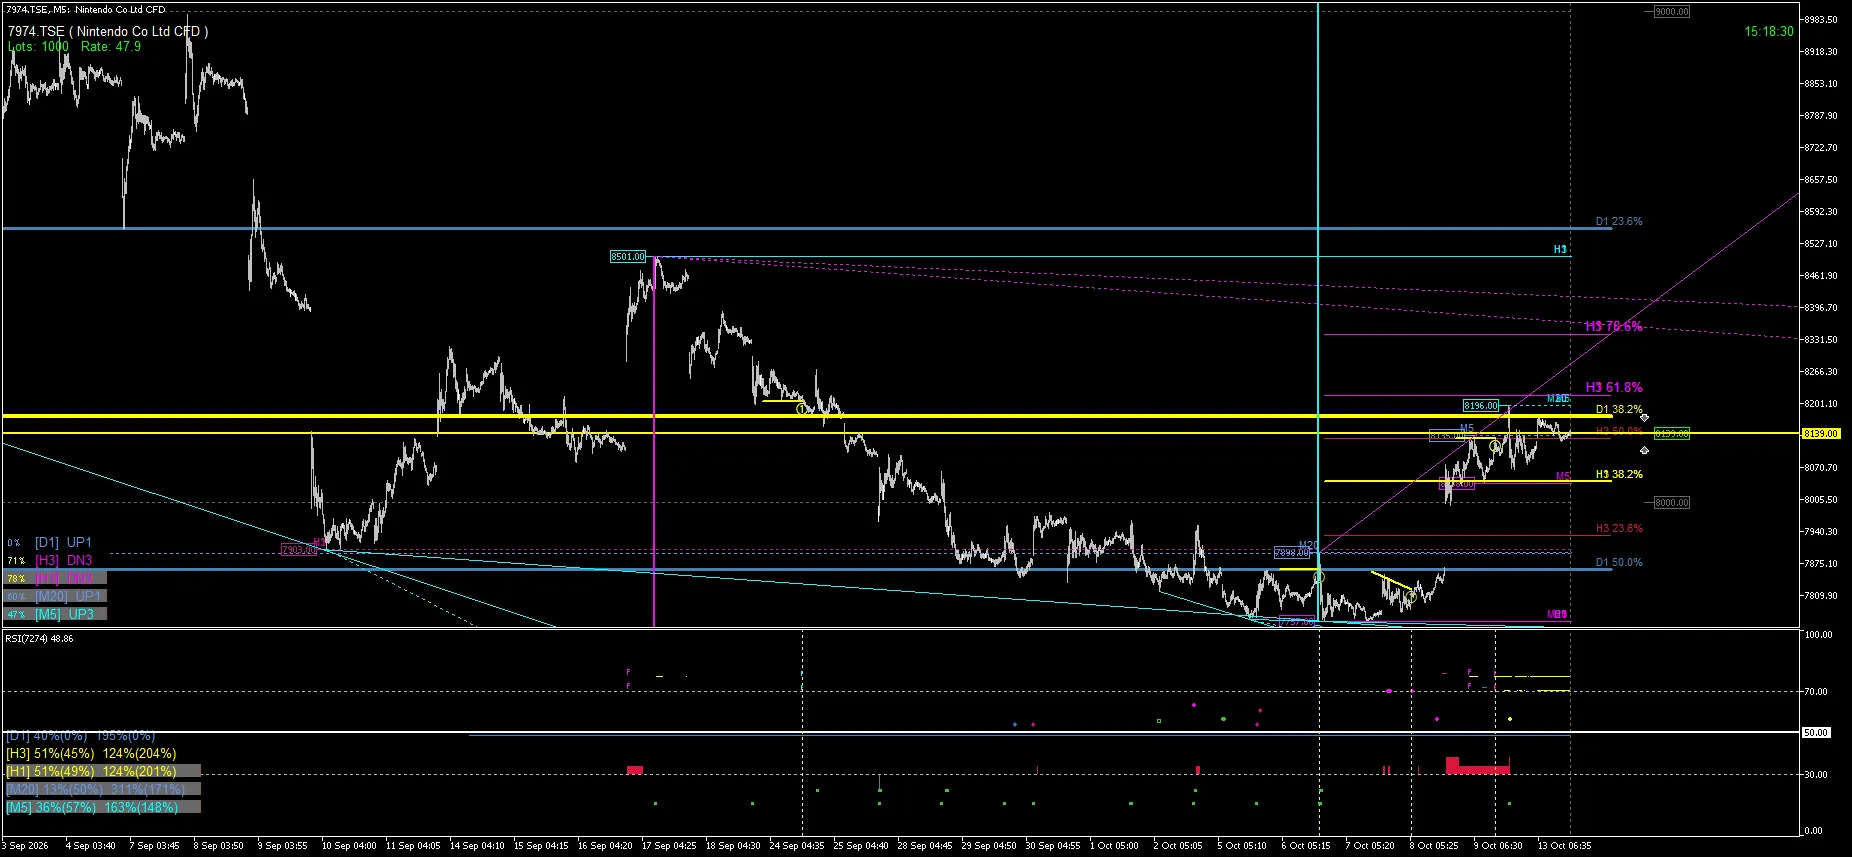
What to note on Oct 9 and 13 is that the same level is repeatedly treated as a key upside reference. Upward, there are several lines around 8,196, etc., indicating that it is still early to call this a completed bottom.
3|October 14 — Surpassing 8,275, Changing the Scene
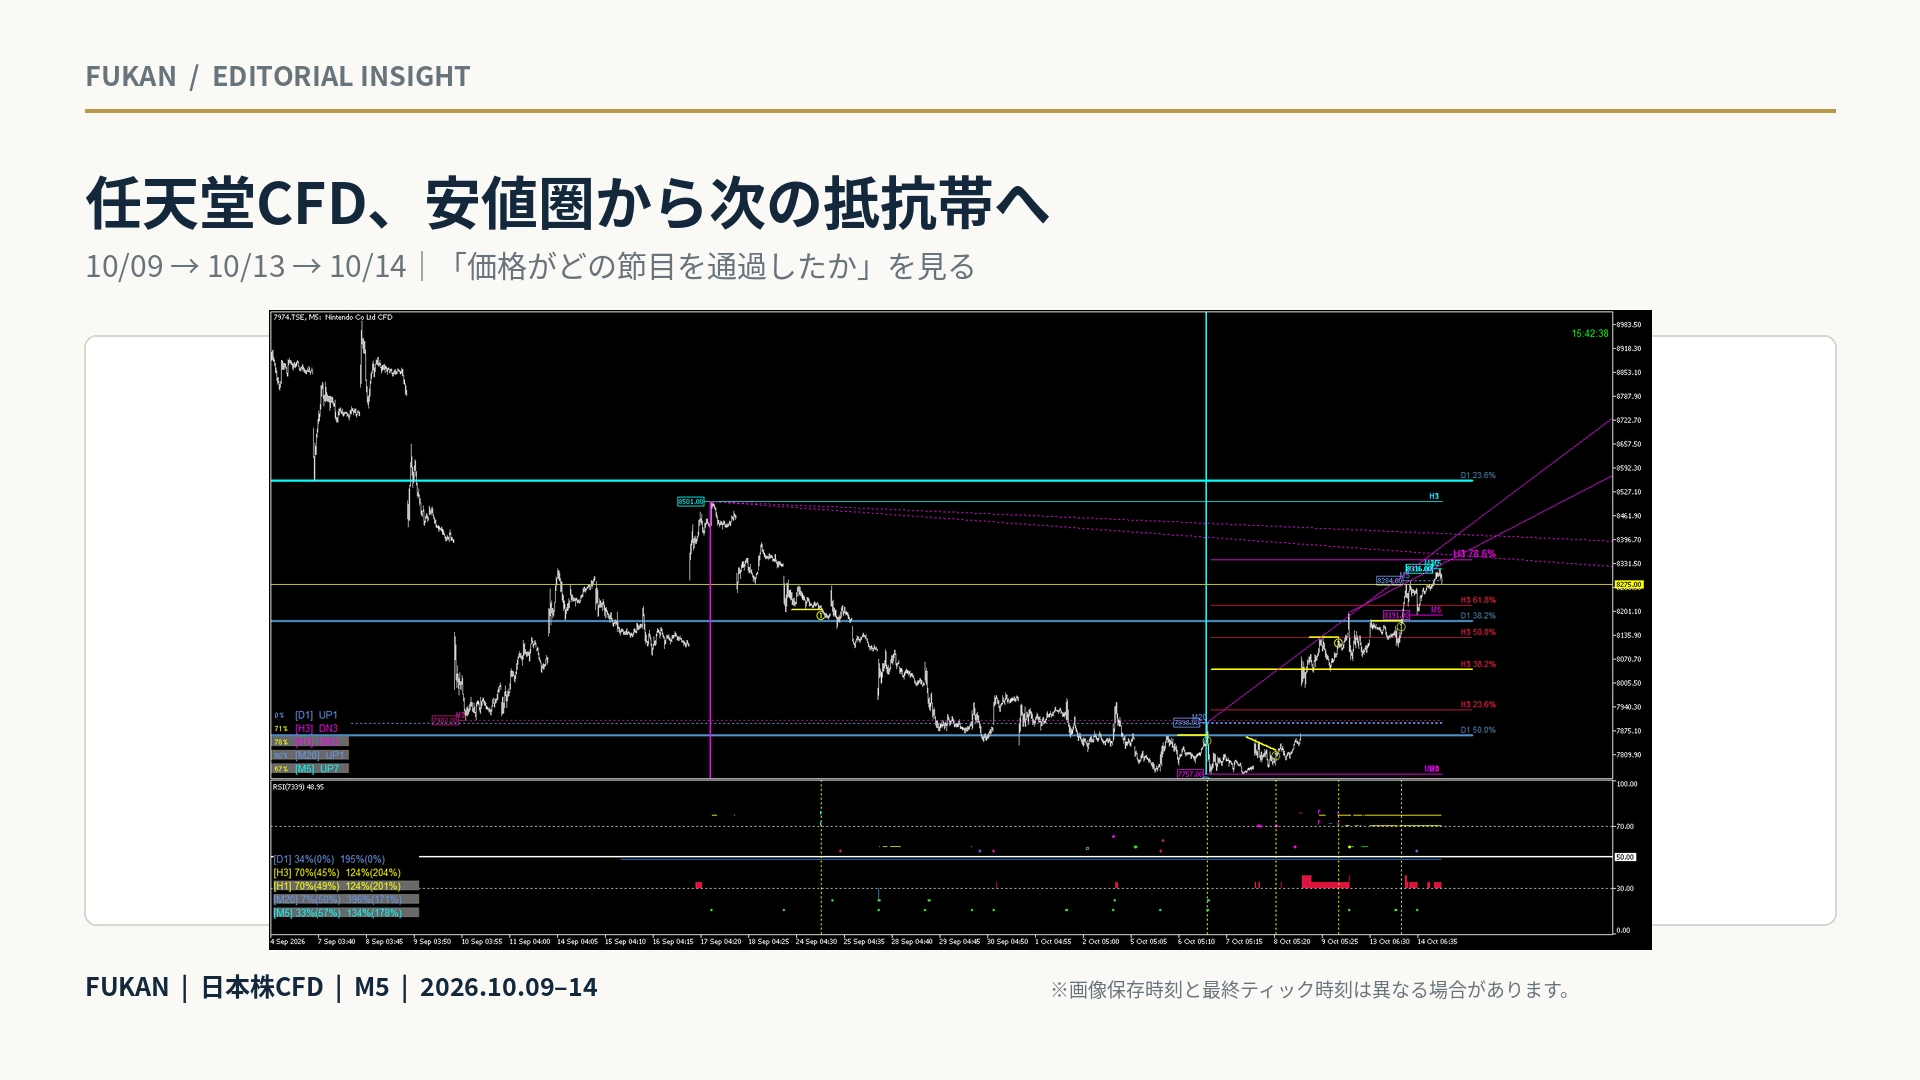
In the image saved at 15:42:41 on October 14, price is above the horizontal band near 8,275. Further up, there is a region with displays around 8,316 and diagonal lines clustered.
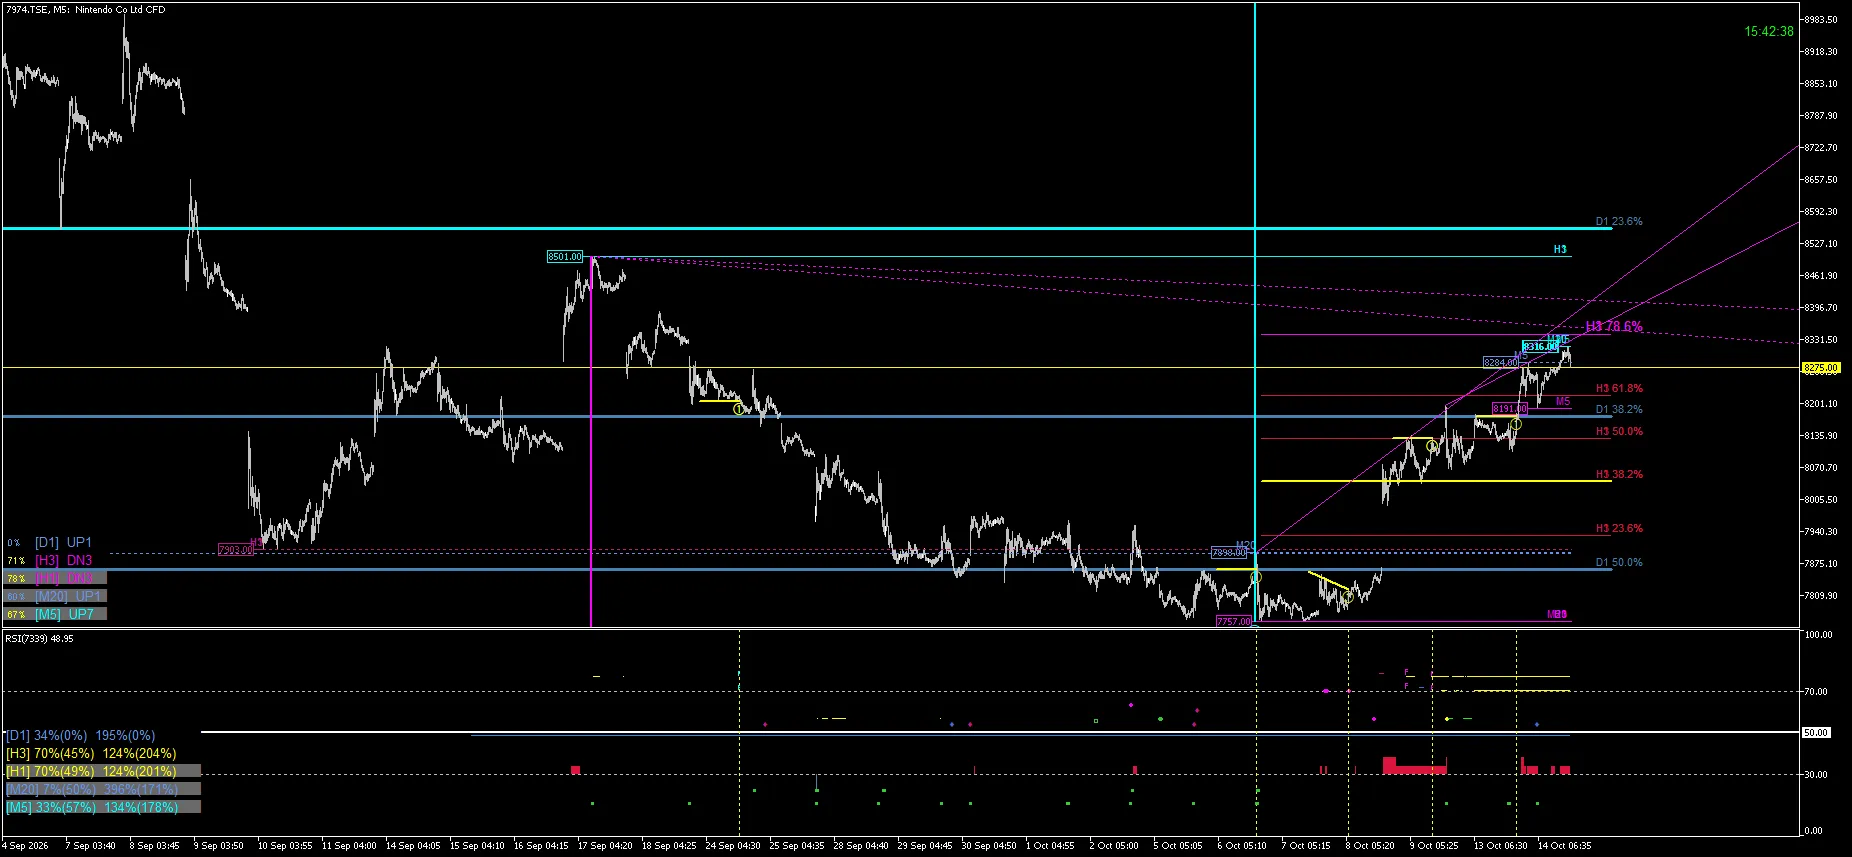
Compared with Oct 9 and 13, the clear change here is not which resistance band you are under, but which resistance band you have surpassed. Not stopping at a rebound but crossing an upper resistance band is a material point when considering a possible bottoming.
4|Possible Bottom? Two Levels to Watch Next
① Whether the 8,275 area changes from "resistance" to "support"
When price returns to the 8,275 area after exceeding it on Oct 14, will it stall there on the downside? If the prior resistance becomes support, it becomes easier to see that the break above may be a lasting change in price structure. Conversely, if price falls back below 8,275 quickly, the breakout may not be established yet.
② Whether the 8,316 upper band can be surpassed
In the Oct 14 image, just above price there remains the 8,316 level and some diagonal lines. If this can be surpassed, it would clear another hurdle upward. If price is rejected again here, it would suggest the price is still in the rebound phase.
5|What I want to see in FUKAN — Change from Resistance to Support
In FUKAN you can view price structures across multiple timeframes, including Dow highs and lows, on a single chart. In situations like this, rather than simply asking whether price went up or down, it helps to observe where price was stopped at resistance, whether the resistance was surpassed, whether that surpassed level can be maintained as support, and whether price can move toward higher resistance bands. This sequence clarifies the meaning of the moves.
6|How to View Nintendo This Time
From the low around 7,757 on October 6, after testing the Oct 9 and 13 resistance bands, price moved above the 8,275 area on Oct 14.This can be seen as moving one step closer to considering a bottoming process beyond a mere rebound.However, it is still necessary to gather more evidence to confirm a bottom. Going forward, whether price can hold the 8,275 area and whether it can exceed the 8,316 upper band will be crucial.
This article provides an analysis of market structure using FUKAN and does not constitute investment advice or a buy/sell recommendation. “Signs of a bottom” are analytical hypotheses and do not guarantee future price movement, profitability, or win rate.
7|About Time and Market Data
The three images are all FUKAN capture shots of Japanese stock CFDs. Save times are October 9 at 15:44:14, October 13 at 15:18:35, and October 14 at 15:42:41 (local collection log time), but the final tick times are 15:19:52, 15:18:16, and 15:19:57 respectively. We do not treat the save times as the market’s final transaction time or official closing price. Prices are the broker’s displayed values and may differ from official exchange data for the underlying stock.
Summary — Breakthrough Confirmed, Bottoming in the Phase of the Next Move
Nintendo CFD not only rebounded from the lows but also moved above a higher resistance band on Oct 14. This is a notable change that can be seen as a sign of potential bottoming.
Will the 8,275 area that was broken turn into support?
And can the area around 8,316 be surpassed even further?
Confirming these two points would help determine whether this breakout is a temporary rebound or a move toward a structural shift.
This article provides an analysis of market structure using FUKAN and is not investment advice nor a trading recommendation. A “sign of bottom” is an analytical hypothesis and does not guarantee future price moves, profits, or win rate.