
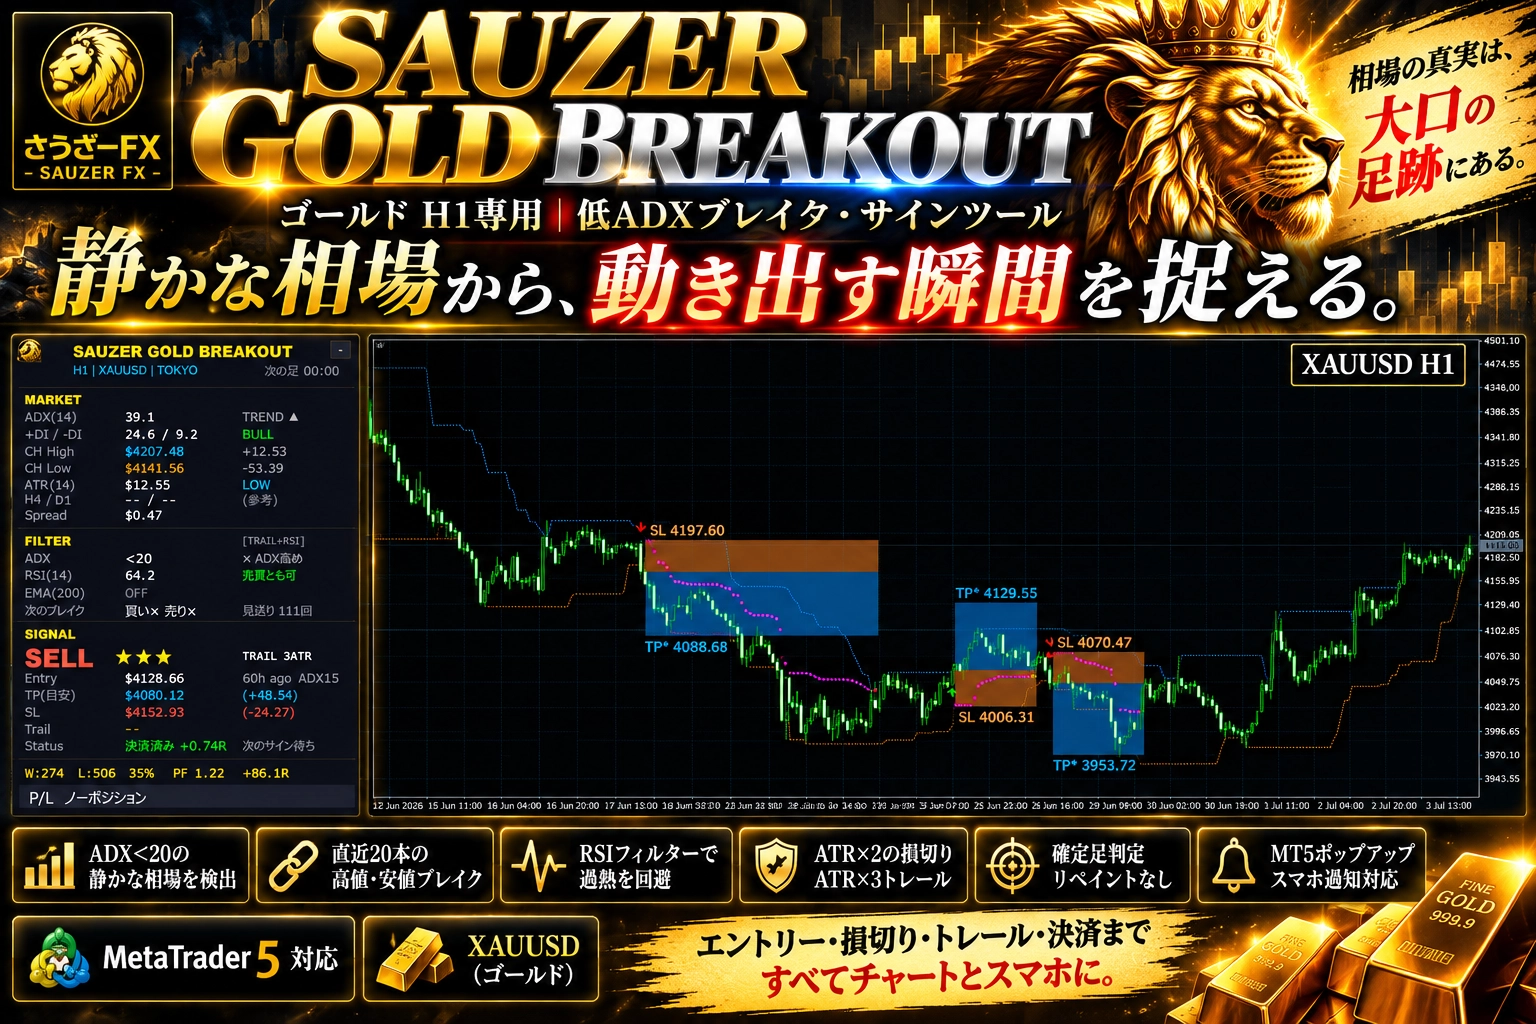
What happens if you only take the breakout of Gold H1 when ADX is low? 7 years 9 months tested on MT5
Hello, this is Sauzer.
When looking at a gold chart, you may feel that “the longer the quiet time, the bigger the move afterward.” What happens when you verify this with numbers? This article summarizes the results of that verification.

1. What was examined
“Quietness” was measured by ADX (a measure of market momentum). The lower the ADX, the less directional the market.
The verification rules are as follows.
Condition ①: ADX below 20 (quiet state)
Condition ②: In that state, the price breaks above (below) the recent 20 highs (lows) by the close
Pass: Do not enter when RSI is overbought at 70 or oversold at 30 (to avoid buying at the high or selling at the low)
Entry: The candle where the conditions align confirms, at the open of the next candle
Stop loss: 2 times ATR
Exit: Do not set a take profit; instead, trail the stop loss up to 3 times ATR from the highest high (or lowest low for a short), and exit when touched
Verification conditions: MT5 Strategy Tester (realistic with all ticks), XAUUSD H1, January 2019–October 2026, initial capital 1,000,000 yen, 1% risk per trade compounded, including spreads and swaps.
2. Results: The lower the ADX, the better the breakout performance
When dividing by the ADX value at breakout into three groups, the results clearly differed.
Breakouts with ADX below 15, i.e., from a particularly quiet state, performed the best. ADX 15–18 had a PF of 1.00, effectively break-even.
The feeling of “moving after a quiet period” is confirmed numerically only when ADX is sufficiently low.
3. Overall performance
If you restrict to ADX below 15, trading drops to about 30 times per year, yet the profit and loss stay roughly the same, PF rises, and max DD decreases.
What stands out here is the win rate. Both are in the 30% range. The reason this remains profitable, and the years with losses, as well as trying the same rules on the Nikkei 225, will be described later.
4. Why the 30% win rate can still be profitable
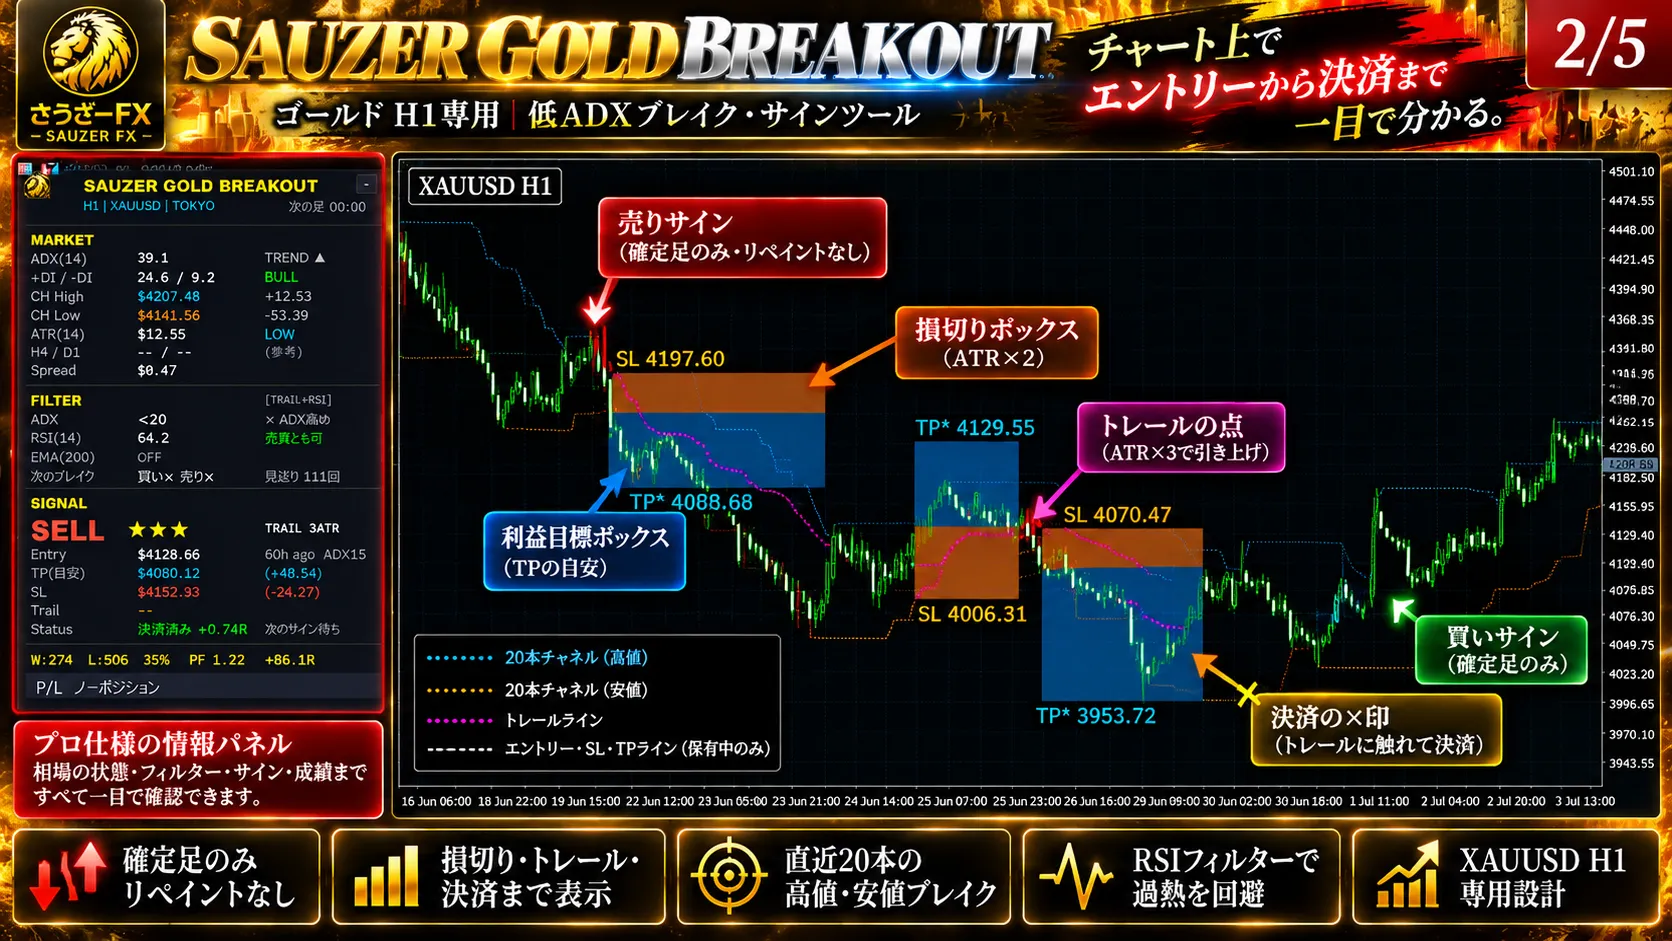
The reason is the difference in the size of wins and losses (ADX < 20 all, RSI filter setting).
Average winning trade: +1.56R (R is the distance of the stop; 1R risk with 1.56x reward)
Average losing trade: −0.72R
Largest win: about +10.9R
The average loss is smaller than 1R because there are cases where the stop is trailed and then exited. Most profits come from occasional large trends. By not locking in profits early, we avoid missing those rare big moves.
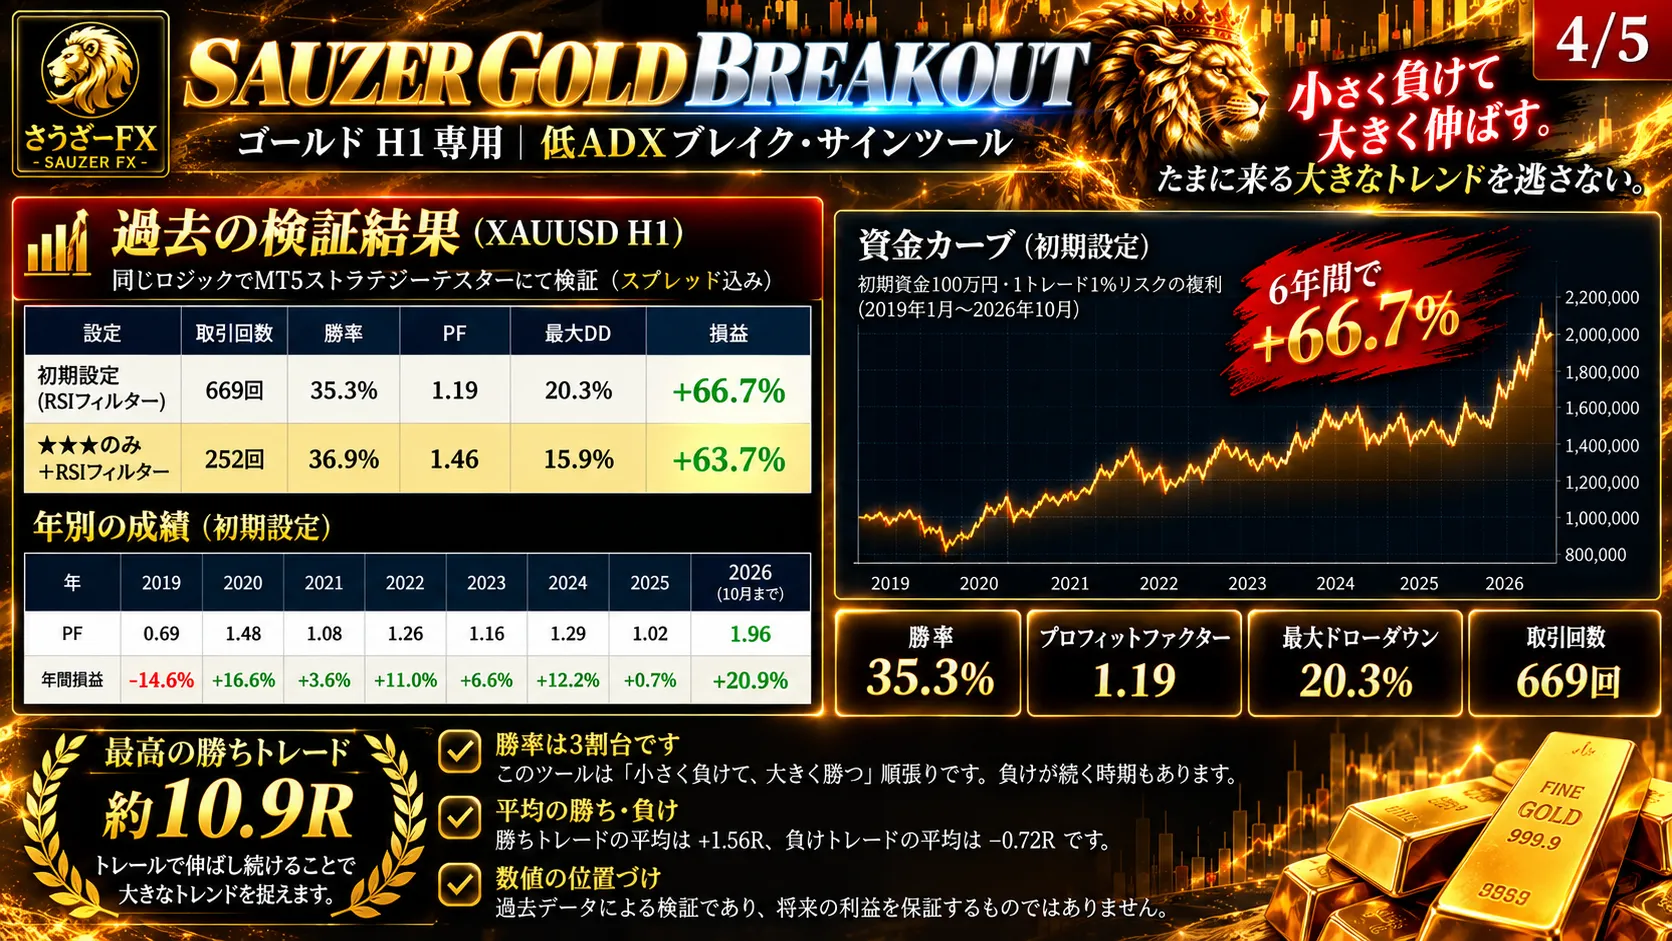
[Image: 2/5 Chart explanation (trail point and exit cross)]
(Panel performance column is calculated for the period shown on the chart, which may differ from the verification results above)
5. Yearly performance: some years were losses
(All ADX < 20 with RSI filter)
[Image: 4/5 Verification results and capital curve]
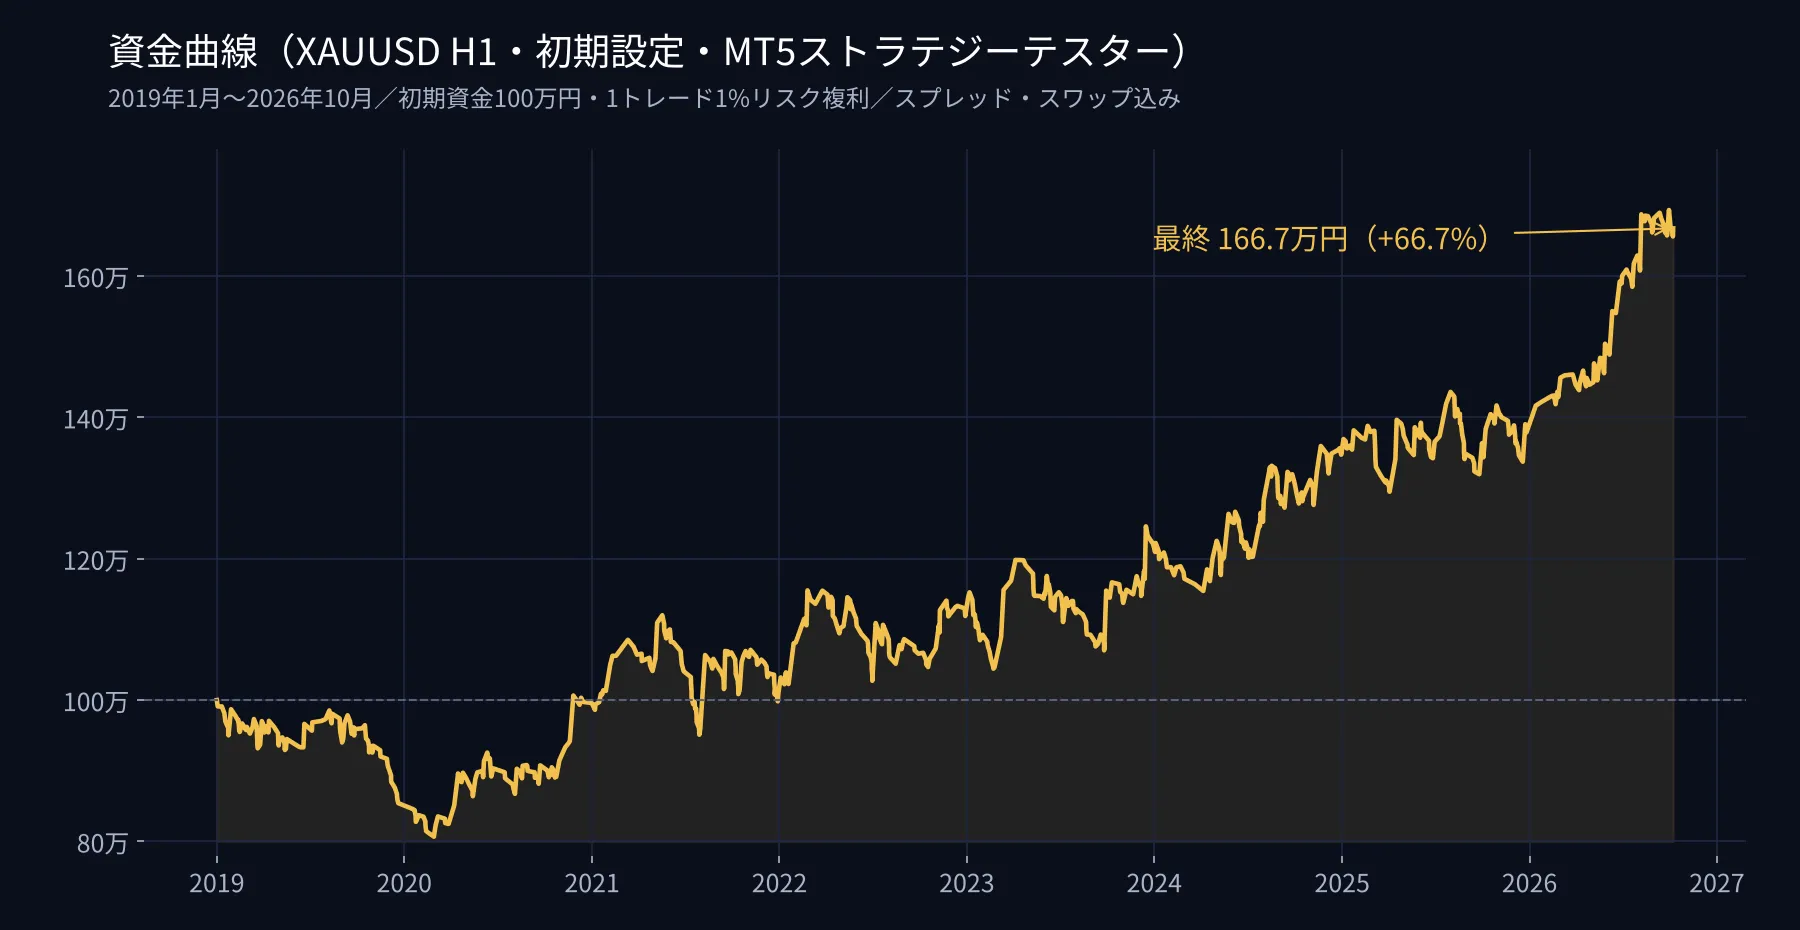
2019 was a losing year, and 2025 was roughly flat. Since this is a trend-following rule, small losses accumulate during long consolidation phases.
Also, a separate Python replication of the same rule showed a PF of 1.23 for 2019–2022 and 1.33 for 2023–2026, i.e., positive in both halves. This is to verify that the trend holds when shifting the period.
6. How to handle losing streaks
Maximum 15 consecutive losses happened in real life. Even with 1% risk per trade, 15 straight losses would shrink the capital by about 14%. The actual maximum DD was 20.3%.
If you use this rule,
Keep an individual trade risk small (verification uses 1%)
Do not increase lot size during a losing streak
The premise is not “every month is profitable,” but to evaluate by year
7. Tried the same rules on Nikkei 225
Applying the gold rules to Nikkei 225 (H1) with only breakout signals below ADX 15, using MT5 Strategy Tester, January 2019–October 2026, including swaps.
297 trades, win rate 42.4%, PF 1.51, max consecutive losses 7, max DD 13.6%, profit +101.4%
Yearly PF: 2019 0.83 (loss), 2020 1.69, 2021 1.88, 2022 1.40, 2023 1.72, 2024 2.27, 2025 1.15, 2026 1.18
No parameter tuning was done for Nikkei 225. Seven out of eight years were positive. However, performance declined if we do not restrict to ADX < 15.
8. Summary
Breakouts after consolidation performed best when ADX was sufficiently low (below 15)
Win rate is in the 30% range. Losses are small and occasionally recovered by large trends
Years with losses and long losing streaks can occur. Capital management is essential
This rule is now a signal tool (PR)
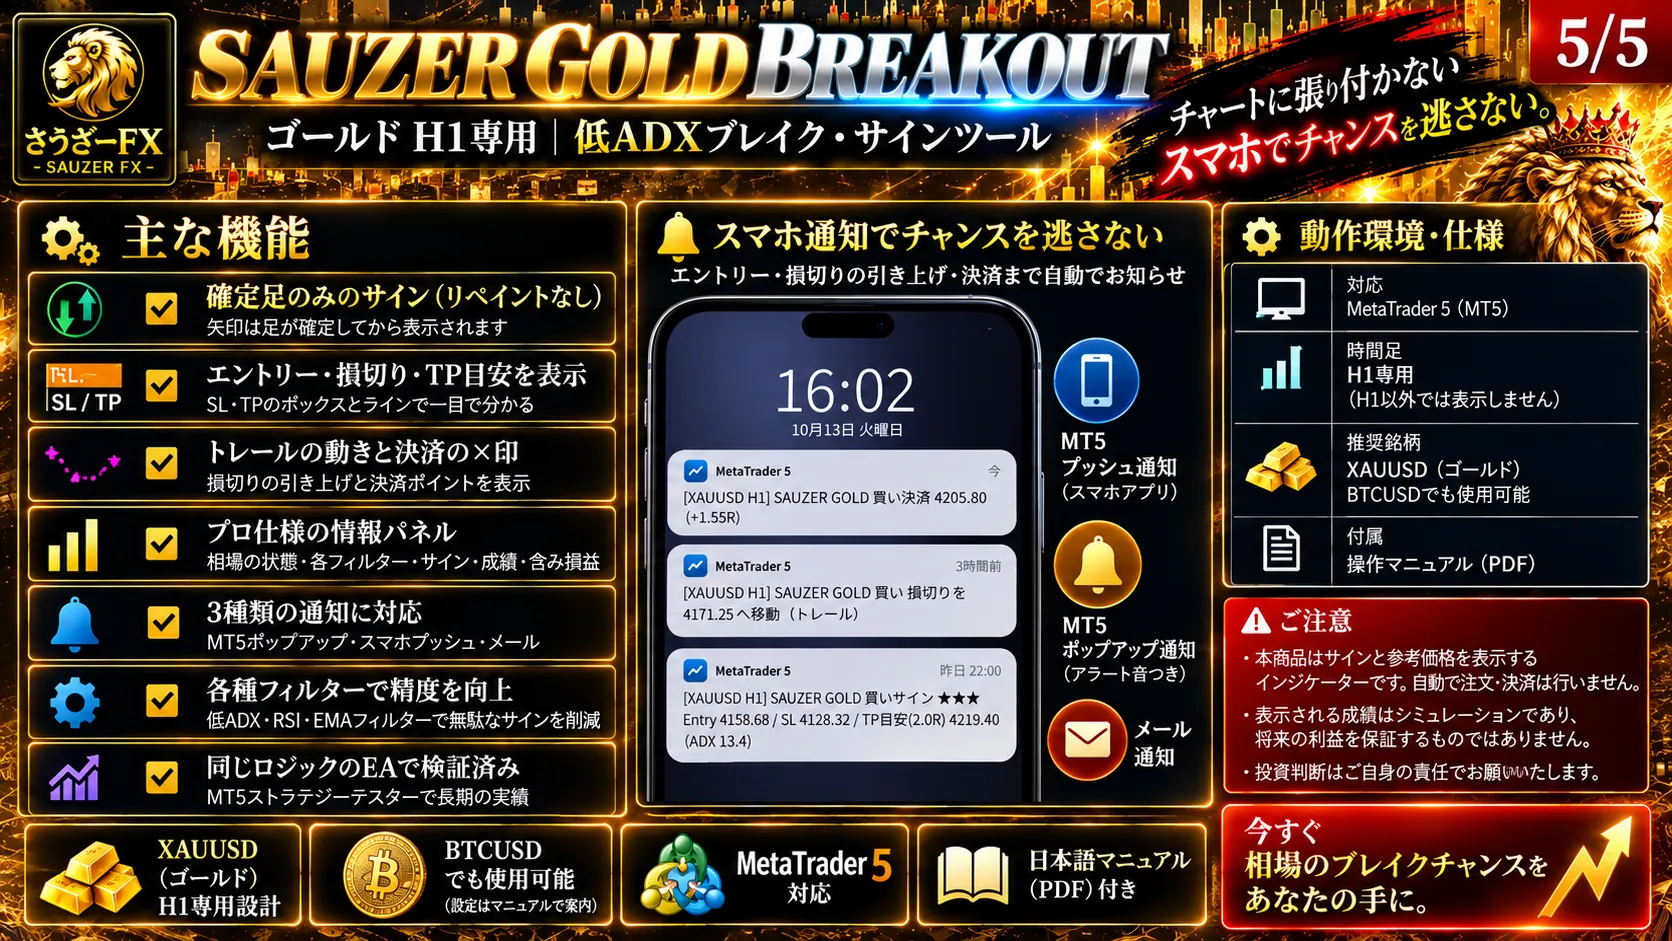
The verification rules have been implemented as an MT5 signal tool for Gold, “SAUZER GOLD BREAKOUT.”
Breakout signals (confirmed candles only, no repaint) displayed with ▲▼
Stop loss, trailing stop, and exit marked with × on the chart
ADX strength shown by star count (★★★ = ADX < 15). An option to show only ★★★
Entry and exit notified to the MT5 mobile app
[Image: Notification image (phone and panel)]

[Image: 5/5 Main features and operating environment]
The first 20 trades cost ¥12,800, and thereafter ¥19,800.https://www.gogojungle.co.jp/tools/indicators/87892
Questions can be asked on the product page community.
Note: The results in this article are based on historical data and do not guarantee future profits. They do not constitute investment advice to buy or sell any particular instrument. Investment decisions are yours to make.