

[BB Mechanism III] Where to protect the extended profit? See the contraction of the intermediate legs and the next resistance
BB Watch's developer “Namikoro” presents the final installment of a total of three episodes.
The price moved in the direction you were targeting. You want to hold a little longer, but you don’t want to give back the profits you’ve earned. After you buy, the question is how far to push it and where to place your stop.
In the first two installments, we described entering by targeting the 4-hour wave and confirming expansion with a pairing of the 1-hour and 15-minute charts. The time-frame combination is just one example. Please choose the pair you use for entries according to your own method and the wave you are aiming for. The price must be at a point where you can consider a setup such as range breaks or a corrective wave after a trend has faltered. We use the price movement accompanying expansion in the paired chart as the basis for entry rationale.
After entering, we monitor whether the targeted 4-hour wave continues to extend. Even if the daily BB widens, the 4-hour may be contracting. Compare that difference with nearby lows and the next resistance. BB Watch can also be used to decide whether to continue holding or to reduce position size.
If the daily expands and the 4-hour contracts, what will price do?
In August 2026, BTC/USD rose further after breaking the June high on the 19th. On Kraken’s daily chart, the closing price on the 21st was 78,327.2 dollars. The BB width was about 59.7% wider than the previous day.
Looking at the 4-hour chart on the 22nd, the change is different. From 12:00 to 16:00, the BB width contracted by about 8.8% compared with the previous 08:00 bar. The upper band moved downward and the lower band moved upward.
As of 16:00 on the 22nd, the latest confirmed daily bar is the 21st. That is, the daily-confirmed value shows expansion, while the most recent 4-hour bar was contracting.
So we also verify the price. The close at the 12:00 bar was $76,966.8. The low was $76,873.7, which did not break the previous 08:00 low of $76,533.1. The range narrowed, but the most recent low was still intact.
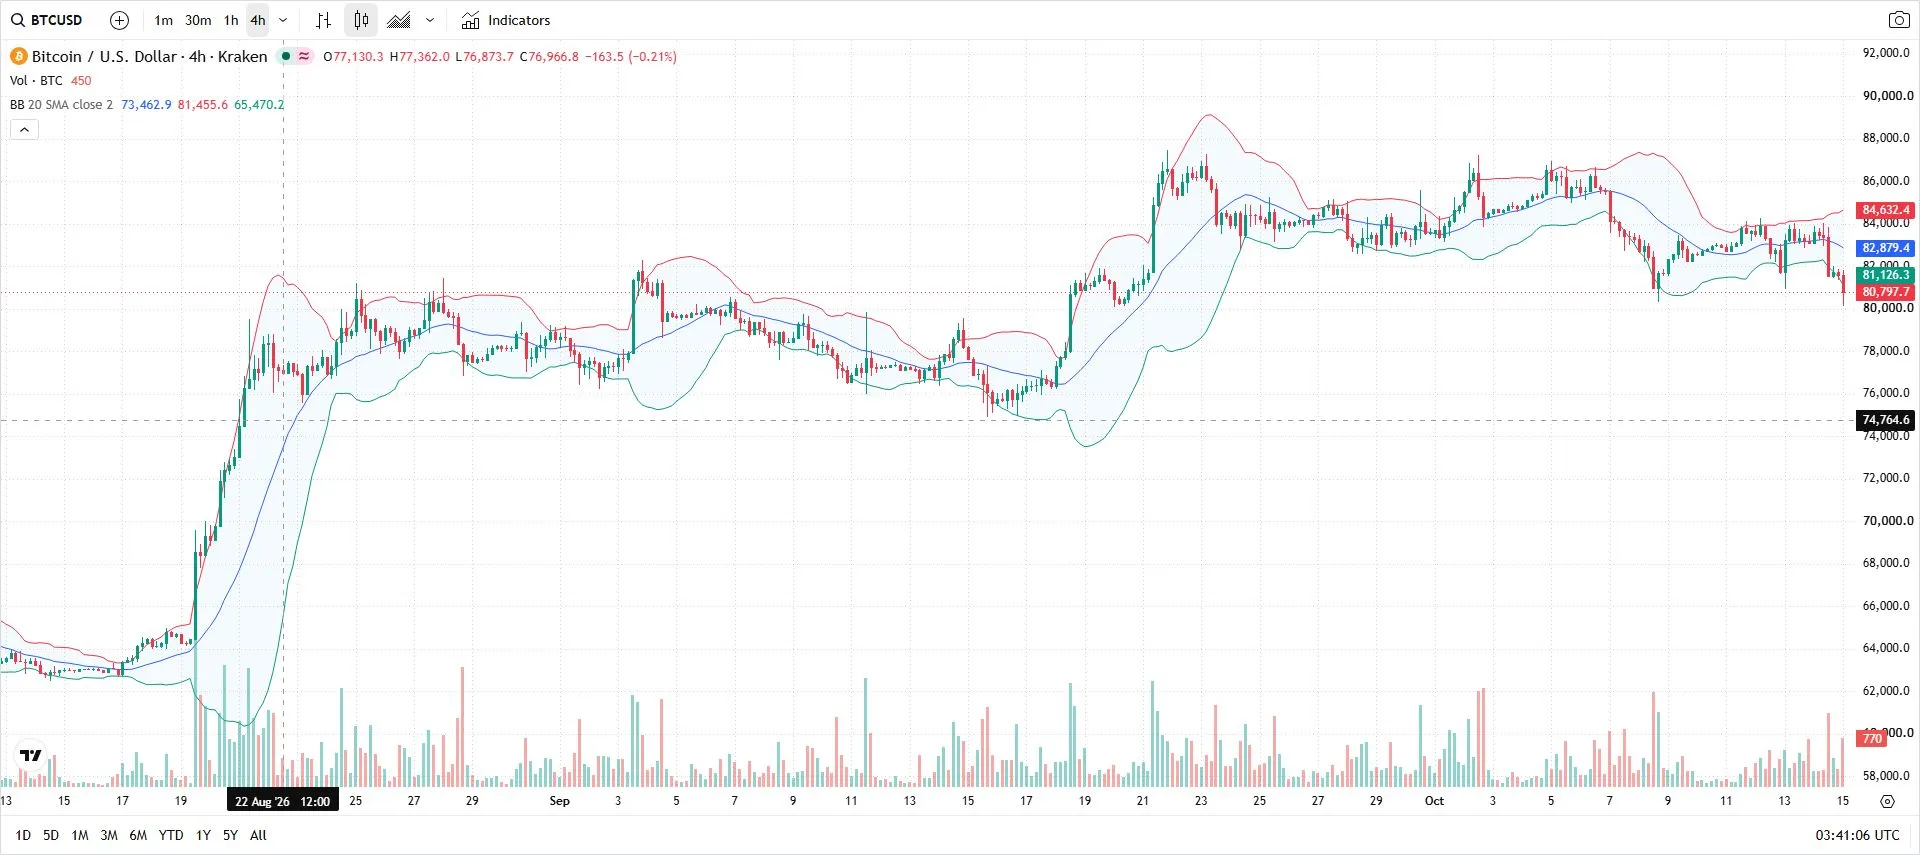
4-hour chart from 12:00 to 16:00 on August 22, 2026. Close 76,966.8, low 76,873.7. The BB width contracted from the previous bar’s 17,524.0 to 15,985.4 dollars by about 8.8%.
KRAKEN:BTCUSD/Charts by TradingView(https://www.tradingview.com/)。UTC time. The vertical lines and date labels are the items of interest.
Confirming near-term highs and the next resistance beyond them
One reference point for attempting to move higher is the previous day's high at 79,511.1 dollars. If you widen the daily view further, above that you can see the zone around 80,000 to 83,000 dollars where price moved in May. The May 10 high was 82,436.6 dollars.
Because there is a history of declines afterward, this past high range can be considered the next resistance candidate. When the 4-hour chart contracts around the vicinity of roughly 77,000 dollars, you should check not only the near-term low but also where you would aim to go above it.
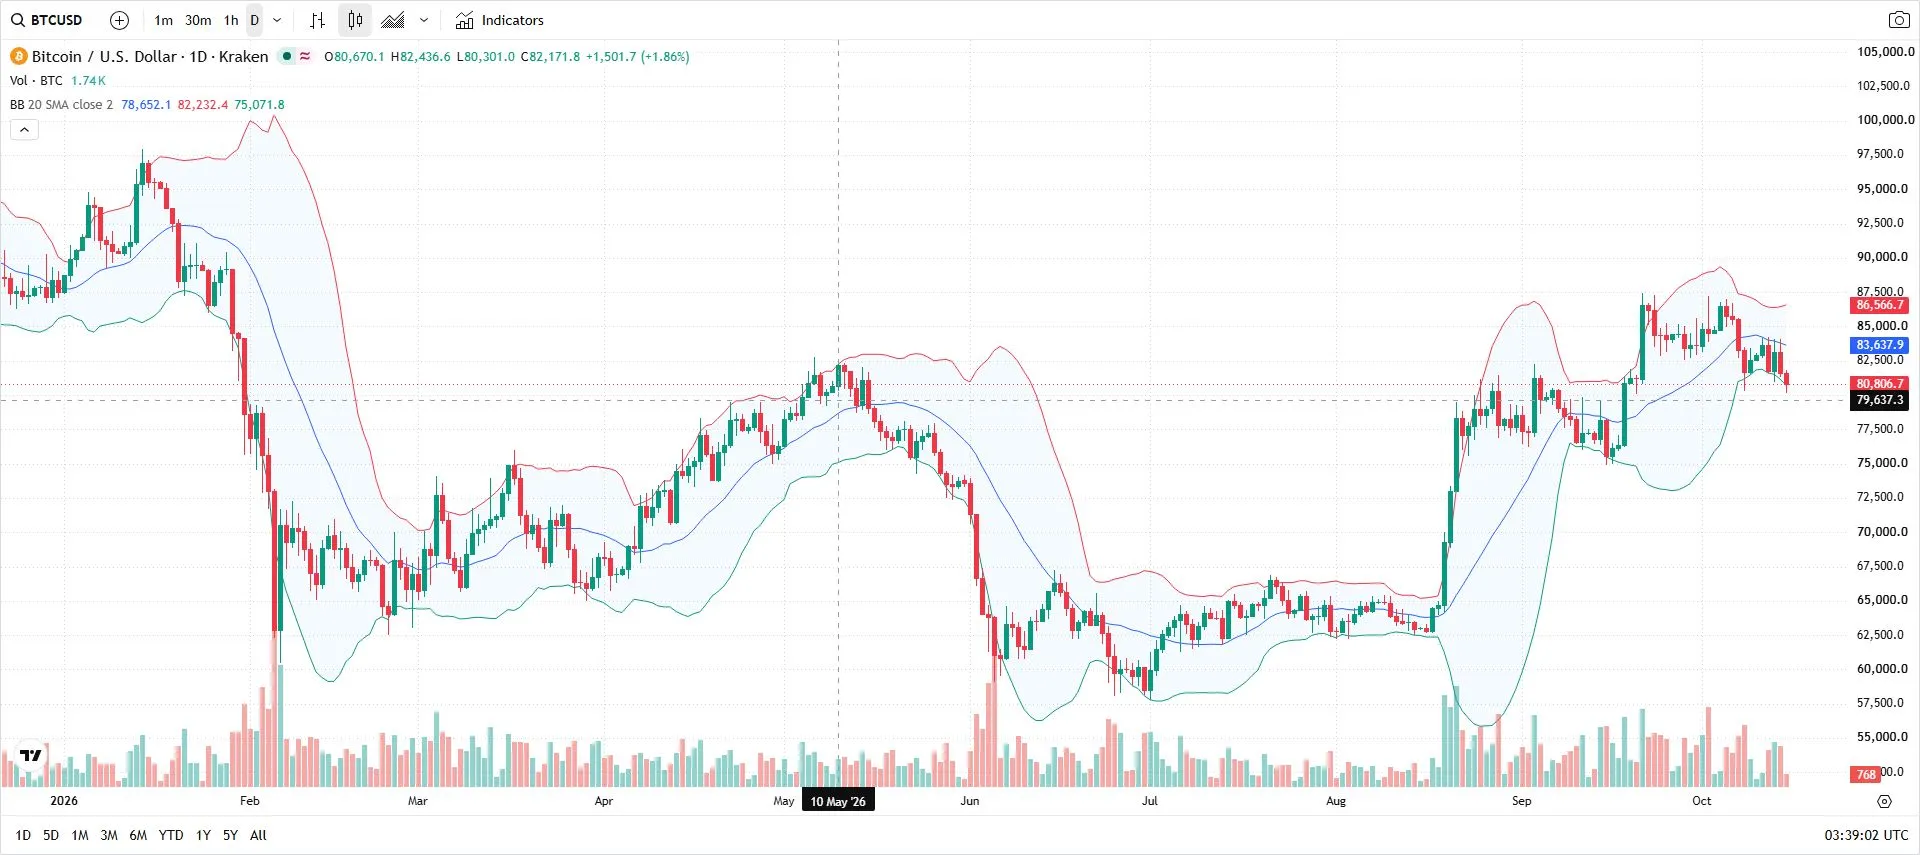
Past daily high-price ranges. The vertical line marks May 10, 2026, with a high of 82,436.6 dollars. The vicinity of 80,000–83,000 dollars is seen as a resistance candidate in the subsequent rise.
KRAKEN:BTCUSD/Charts by TradingView(https://www.tradingview.com/)。UTC time. The vertical lines and date labels are the items of interest.
Resistance candidates are based on past price movements. Whether price actually stalls at that level is judged by price movement and BB changes as price approaches that level.
Protect a portion and wait for the next rise with the rest
From here, the example considers decisions assuming you have been holding long since the rise after the 19th. In addition to the 1-hour and 15-minute charts used for entries, we watch the held wave on the daily and 4-hour charts. From the daily view, the 4-hour is an intermediate bar to confirm near-term changes.
If that intermediate bar contracts, do not rush to buy more; review how you hold. The daily expands while the 4-hour price holds the recent low. In such a state, you can consider waiting for a new high with the remaining position.
At the same time, you can also choose to lock in part of the profits you’ve stretched. There are higher resistance candidates above, and the 4-hour width is not expanding. You can reduce the position size by partially closing and decide how much to hold based on price movement. This is risk management to avoid giving back too much profits while allowing for further upside.
In this scenario you can observe the low of 76,533.1 on the 22nd at 08:00 as one of the reference points. By the time the 12:00 bar closes at 16:00, that price is already known. If the price breaks below this low and cannot recover, it provides another reason to further reduce the remaining quantity.
Conversely, if the price holds the low and tests higher again, and the 4-hour bar expands again, reconsider whether to continue holding. Do not assume the rally has ended simply because the bars contracted; track where price held and how the width changes afterward.
If you enter again, look at the 1-hour and 15-minute pairs once more. When the 4-hour chart forms a structure capable of the next rise, an expansion emerges as price tests higher. Use that movement as the basis for the next entry argument. Confirm both the decision to continue holding and the conditions for a new entry.
If price breaks the high but only the 15-minute bar widens while the 1-hour bar also expands, do not chase additional buys; wait. Be wary of a false breakout that returns, and check whether the price can stay above the breakout level with the confirmation that both timeframe expansions align. BB Watch’s “Support for avoiding false breakouts” can also be used for re-entries after securing profits.
Where exactly you exit is set according to your own rules. 76,533.1 dollars is the observation point used in this example and does not imply an execution at that price.
Is it still wide, or is it widening right now?
The BB width at 12:00 on August 22 remained at 15,985.4 dollars even after contraction. Although the chart may appear wide, the width is smaller than the previous bar.
When you separate width and changes with BB Watch, you can confirm this difference. The daily chart still shows expansion, but the 4-hour chart contracted. Use such changes while holding to reassess price.
There is also a way to adjust management when contraction appears during formation. In that case, later numbers may change as well. The approximate 8.8% change is a comparison of confirmed bars after 16:00. Whether to wait for confirmation depends on your own trading rules.
For those who want to compare timeframes after entry
In this example, entries were made using the 4-hour timeframe, with expansion in the 1-hour and 15-minute charts as the basis. When profits extend, watch the 4-hour contraction, the lows you want to hold, and the next resistance. If you re-enter, check the pair against the next 4-hour wave you aim for. Align it with your own method to follow the same procedure from entry to hold management using BB Watch.
When you want to both “extend further” and “protect today’s profits,” BB Watch lets you arrange and compare the width and changes of the timeframes you chose. Please check the product page for how to combine and use your monitoring timeframes.
BB Watch product page
https://www.gogojungle.co.jp/tools/indicators/87496
About sources and data
The horizontal dashed line in the chart is a crosshair. It is not a drawn resistance line for the text. The bars to the right of the target bar and the current value at that time are not included in the 판단 for the resistance.
TradingView’s KRAKEN:BTCUSD historical chart. Time is UTC, price in USD, BB with 20 periods, SMA, close, and upper/lower 2σ. The rate of width change is a rough estimate comparing the difference of the upper and lower bands to the preceding bar and is not a measure of price movement or profit rate.
https://www.tradingview.com/widget-docs/widgets/charts/advanced-chart/
The confirmed value obtained later is not part of BB Watch’s records at that time. Values may differ depending on the MT5 data source. The entry using the 1-hour and 15-minute pairs is an example of usage; the BB of both bars at that time was not measured. Buying and profit-taking are hypothetical decision examples and do not guarantee actual results or profits. Actual trading should be judged according to your loss tolerance and your own rules.