
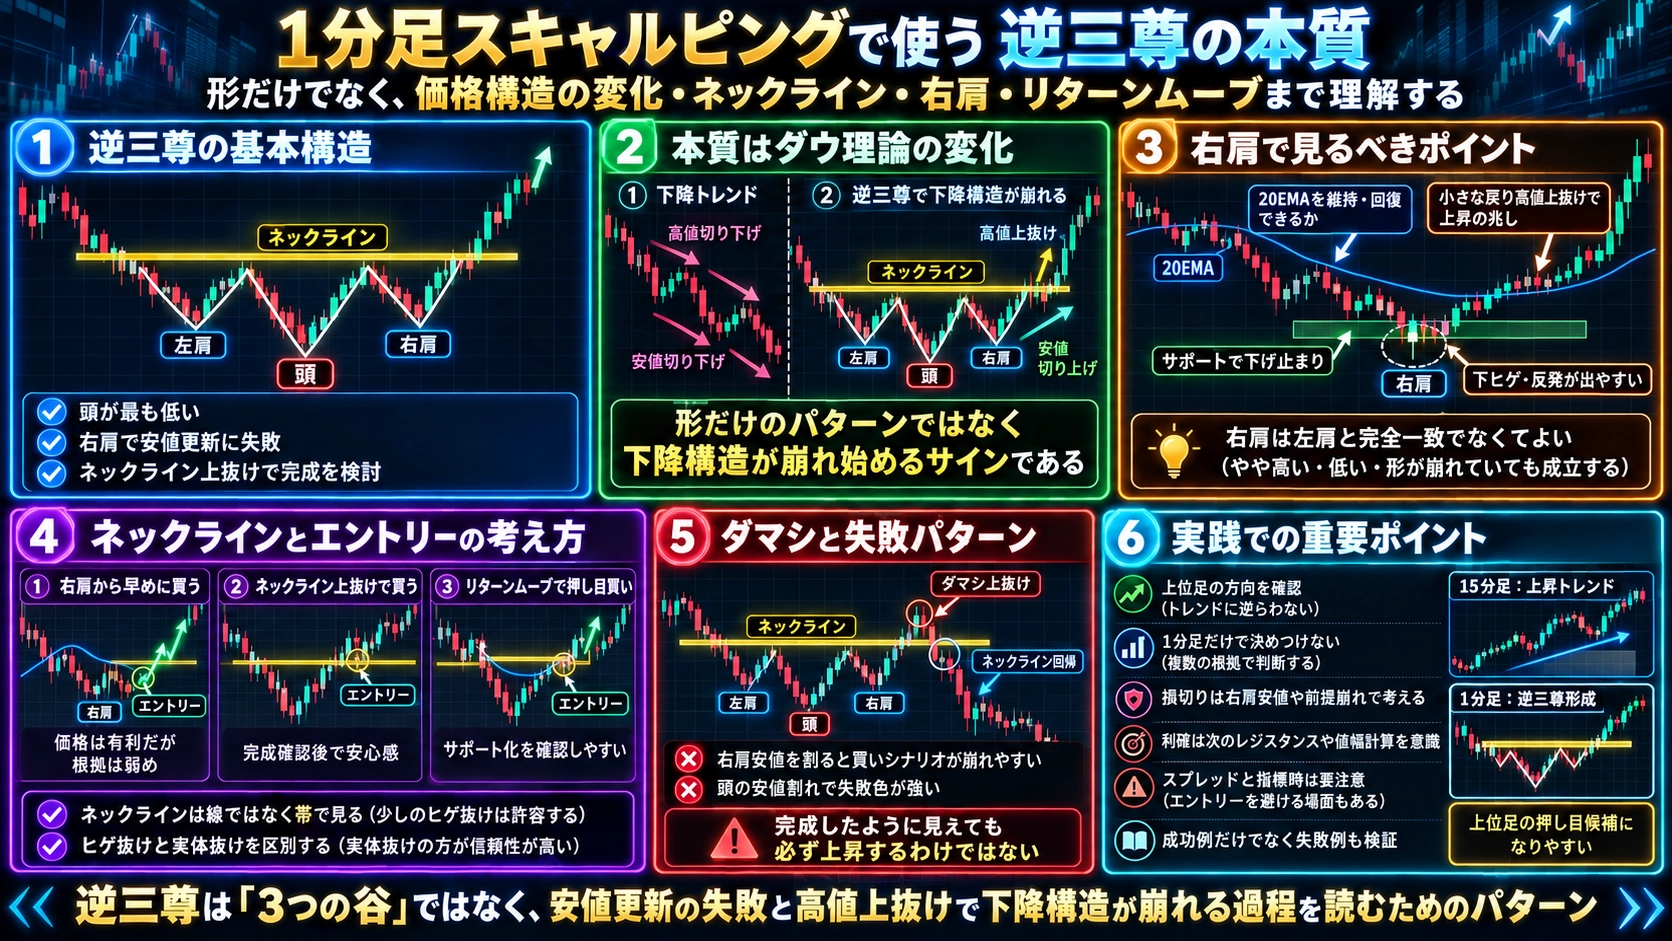
【FX】1-Minute Scalping Ironclad Trading Method. The essence of the Inverted Head and Shoulders explained clearly by the pro trader Shohta, a multi-millionaire, recommended for beginners who have suffered big losses: an introductory course on technical anal
In FX 1-minute scalping, the inverse head and shoulders is one of the most profound chart patterns.
Generally formed toward the end of a downtrend and known to suggest a reversal to an uptrend.
However, the real value of the inverse head and shoulders is not simply finding three troughs and entering a long position.
What matters is understanding why the market, which had been dominated by sellers, stops renewing the lows and how the buyers gain the upper hand through what processes.
Especially in 1-minute scalping, by analyzing this price structure’s changes in detail, you can think concretely about entry timing, stop-loss placement, and profit targets.
First, let us understand the basic structure of the inverse head and shoulders.
The inverse head and shoulders consists of three troughs called the left shoulder, the head, and the right shoulder.
Price falls in the middle of a downtrend, forming the first trough, the left shoulder.
After that, price rallies briefly, then falls again, creating a new low lower than the left shoulder; that is the head.
Further price rallies, then another fall, but it cannot break the head’s low and rallies again.
This is the right shoulder.
Then, a neckline is drawn by connecting the highs formed between the left shoulder and head, and between the head and right shoulder.
Generally, the inverse head and shoulders is considered complete when the price breaks above the neckline after forming the right shoulder.
However, just because three troughs have formed does not guarantee an uptrend will follow.
Even after the pattern appears complete, price may fall again and renew the head’s low.
That is why it is important not only to examine the chart pattern’s shape but also to confirm how candlestick highs and lows have changed during the formation process.
What I consider most important in analyzing the inverse head and shoulders is at what stage the downtrend structure under Dow Theory changes.
In a downtrend, generally both highs and lows are consecutively lower.
When sellers dominate, price may rally temporarily but fail to surpass the previous high, followed by new lows again.
The price action from the left shoulder to the head can be understood as part of this downtrend.
If after forming the left shoulder price rallies but then falls again, breaking below the left shoulder’s low, a sequence of lower lows is occurring.
In other words, at the head-forming stage, the downtrend may still be continuing.
However, if after forming the head the price rises, then falls again but cannot renew the head’s low, the situation changes.
There is now a possibility of a higher low forming, meaning a shift in the downtrend’s structure may be underway.
This is a crucial point when analyzing the right shoulder.
If price moves up from the right shoulder and breaks above the neckline, it could indicate a shift in momentum to the upside.
In some cases, we may observe a rise in lows and a breakout above the neckline, signaling a structural change to the upside.
In other words, the inverse head and shoulders can be understood not as three mere troughs but as a process in which the downtick and downdraft that constituted the downtrend break down and the price structure shifts toward the upside.
However, breaking the neckline does not guarantee an ascent afterward.
What matters is recognizing that the downward-trend structure up to that point has changed.
Further, I want to delve into the moment when the head forms and a temporary low is updated.
For example, in a 1-minute chart, suppose price is in a downtrend and the left shoulder low is 150.000 yen.
Then price rallies once, but falls again to renew a low to 149.980 yen.
At this moment, the left shoulder’s low has been breached by 2 pips.
However, if price then quickly rebounds and returns above 150.000 yen, a very interesting price action occurs.
This is because price could not sustain below the left shoulder’s low, despite breaching it.
Such price action is often analyzed in terms of fake breakouts or liquidity sweeps.
Near the left shoulder’s low, there may be buy stop orders and sells that aim for a new low, which may get triggered if price breaks below the left shoulder’s low.
If, however, selling pressure does not continue and price returns above the left shoulder low, then the subsequent fall did not hold the new low.
This can result in the head forming as a consequence of such dynamics.
What is crucial here is not simply that a new low was made but whether the price could hold that level afterward.
For example, suppose during the head formation a long lower shadow appears on a bullish candle.
This shows that within that candle’s timeframe price fell sharply and then rebounded.
Moreover, if a subsequent candle breaks above the latest high, it can serve as evidence of a short-term bullish shift.
However, because a long lower shadow does not automatically prove that large investors have forced a stop-out, you cannot conclude that selling pressure vanished based solely on candlestick shadows.
Normal candlestick charts cannot precisely show how much order interest exists at which price levels.
What matters is not to assign intent to unseen market participants, but to focus on the observable fact that the price did not sustain the low after the low was breached.
Moreover, even if the head forms and price rebounds, it does not guarantee a sustained uptrend.
Price may fall again after rising from the head.
Therefore, the formation of the right shoulder becomes critical.
For example, if the price, after rebounding from the head, rises toward the vicinity of the neckline and then falls again, the right shoulder’s formation is not yet certain.
But if the price then approaches the head’s low but cannot renew it, and a candle shows a halt in the decline, you can consider the possibility of the right shoulder forming.
Furthermore, if afterward the price breaks above a small retest high, the short-term downward structure may be breaking down.
Here’s what to understand: the formation of the right shoulder is not simply a price rebound phenomenon.
If the right shoulder forms higher than the head, the sequence of lower lows may stop and a higher low may emerge.
This is a very important change in the inverse head and shoulders.
However, do not assume from the outset that the right shoulder will inevitably form just because price initially reverses near the head.
Even if there is a temporary rebound above the head, price might fall again and renew the head’s low.
Hence, you need to distinguish between stages where the right shoulder might form and where you can declare that the right shoulder has formed.
In particular, 1-minute scalping requires understanding how this distinction affects entry speed and stop-loss width.
Moreover, it is less well known that the left and right shoulders do not need to be perfectly equal in height.
For example, the right shoulder can form higher than the left shoulder.
In this case, the right shoulder’s low will not only be lower than the head’s low, but also lower than the left shoulder’s low.
Thus, a clear higher-low formation may be present.
On the other hand, the right shoulder can form a little lower than the left shoulder.
Even in that case, if the head’s low is not updated and the neckline is broken above, it can be analyzed as an inverse head and shoulders.
In other words, what matters more than perfect symmetry of the shoulders is that the head is the lowest point and whether the rebound from the right shoulder leads to a neckline breakout.
Also, a higher right shoulder does not automatically imply easier upside movement.
Even with a higher right shoulder, a strong resistance line above it could prevent price from rising.
Conversely, even if the shoulders are uneven, if the price forms the inverse head and shoulders near an important higher-timeframe support, it may still be noteworthy.
Thus, it is essential to check not only the pattern’s shape but also the price zone where the pattern forms.
Additionally, when analyzing the inverse head and shoulders’ right shoulder, pay attention to the speed of candlestick declines within the right shoulder.
For example, if from the left shoulder to the head there are long bearish candles, but during the right shoulder the declines are a series of small bearish candles that fail to renew the lows, the momentum may differ between the left–head downtrend and the right shoulder’s decline.
However, simply smaller real bodies do not prove that selling pressure has weakened.
Market-wide volatility may simply be lowering.
Therefore, combine the candlestick bodies, the occurrence of long lower wicks, the success or failure of new lows, and responses to support lines to verify.
For example, if during the right shoulder’s down move you repeatedly fail to make new lows, a long lower wick appears, and subsequently a short-term retest high breaks above, the price-structure toward the downside may be changing.
Thus, in 1-minute scalping, it is important to observe not just a single trough but what happens inside the right shoulder.
Also, a pivotal, indispensable aspect of using the inverse head and shoulders practically is neckline analysis.
The neckline is the reference line connecting the highs between the left shoulder and head and the highs between the head and right shoulder.
In other words, it’s the line connecting the levels where price previously faced selling pressure.
If price rises from the right shoulder and nears the neckline, selling pressure may resume to push it back down.
But if price breaks clearly above the neckline, it has breached a price zone that previously could not be surpassed.
Here you can consider the completion of the inverse head and shoulders.
However, in 1-minute scalping, do not hastily conclude an uptrend merely because of a slight neckline breakout.
For example, suppose the neckline is 150.100 yen.
If the candle briefly rises to 150.105 yen but then falls to 150.090 yen, the price zone above the neckline has not been sustained.
Such movement suggests a failed breakout to the upside.
On the other hand, if the candle closes above the neckline and continues to trade above it, you can confirm price maintenance after the breakout.
Yet, even if the candle’s body breaks out above the neckline, it does not guarantee further gains.
What matters is not the breakout itself but how price behaves after the breakout.
Moreover, the neckline does not have to be horizontal; in inverse head and shoulders, the neckline can slope upward or downward.
What is particularly interesting is that the slope of the neckline alters the meaning of the price structure.
For example, if the high between the left shoulder and head is lower than the high between the head and right shoulder, the neckline will slope upward to the right.
In this case, an uptick in highs has occurred even before the right shoulder completes.
Moreover, if the right shoulder forms at a higher position than the head, a rising low is also present.
That means price structure may already be shifting upward even before the inverse head and shoulders are completed.
Conversely, if the high formed between the head and right shoulder is lower than the high between the left shoulder and head, the neckline slopes downward to the right.
In this case, even if price rebounds from the head, it has not updated the previous retracement high.
Thus, in the stage when the right shoulder forms, a continuing lower-high structure may still be present.
Subsequently, if price rises from the right shoulder and breaks through the neckline and key retracement high, a change in the downtrend structure can be inferred more easily.
However, simply having an upward-sloping neckline does not guarantee easier rise, nor does a downward-sloping neckline guarantee a harder rise.
In particular, with a downward-sloping neckline, price can break above it even during a flat market because a breakout threshold can be reached over time.
Therefore, do not enter on a breakout of a sloped neckline alone; check whether price has also broken recent highs or important horizontal levels.
What I especially want to emphasize in analyzing inverse head and shoulders is to treat sloped neckline and horizontal levels as separate components.
For example, even if you break above a downward-sloping neckline, you may not have yet surpassed a retracement high formed from the head’s rebound.
In this case, a broken diagonal neckline may occur without a corresponding breach of a major high, indicating that a meaningful structural change has not yet occurred.
Conversely, if both the retracement high and the neckline break, price structure changes become clearer.
Thus, sometimes neckline breakout and major retracement highs’ break happen as same event, sometimes at different times, which is particularly helpful in 1-minute scalping to avoid deception.
Additionally, in the inverse head and shoulders, pay attention to a small double bottom that can appear inside the right shoulder.
This is a highly practical concept in 1-minute scalping.
For example, after forming the head, price may rise toward the neckline and then fall again.
During forming the right shoulder, price may decline and stop twice, rebounding from nearly the same low.
In other words, a small double bottom can form inside the right shoulder of the large inverse head and shoulders.
If the small double bottom’s neckline breaks above, the internal short-term downward structure of the right shoulder may have collapsed.
Moreover, if there is a larger inverse head and shoulders neckline above, the small double bottom’s completion can develop into the large inverse head and shoulders completion.
In such a structure, you can distinguish between the small double bottom neckline and the large inverse head and shoulders neckline as different scales of price structure for analysis.
For example, there is a method to enter after the right shoulder’s internal double bottom completes.
On the other hand, you may wait for the large inverse head and shoulders neckline breakout.
The former allows relatively early entry, but since the large inverse head and shoulders is not yet complete, further downside risk remains.
The latter lets you confirm a larger structural change but, since price has already risen, the risk-reward relationship can become less favorable.
In short, entering early does not necessarily yield a higher quality trade.
Moreover, in 1-minute scalping, a downward trendline inside the right shoulder may form.
For example, after rebounding from the head, price may again fall and head toward the right shoulder while the lower retracement high keeps getting lower.
In this case, you can draw a short-term downward trendline inside the right shoulder by connecting the right shoulder’s retracement highs.
If price rebounds after the right shoulder forms and breaks above this downward trendline, the internal downward structure of the right shoulder may be breaking down.
Moreover, if the most recent small retracement high breaks to the upside, it can indicate a short-term shift to upside momentum.
Thus, understanding that the formation of the right shoulder is not simply price rebounding but a potential shift in price structure is important.
If the large inverse head and shoulders neckline is broken, and price then breaks above the neckline’s upper side, it signals a more significant price-structure change.
This suggests that even before the large inverse head and shoulders completes, a minor internal trend reversal could be occurring.
However, breaking the downward trendline inside the right shoulder does not guarantee the large inverse head and shoulders will complete.
After a brief rebound, price may fall again and renew the head’s low.
Therefore, you must clearly decide before entry whether you are targeting a brief internal rebound within the right shoulder or the larger upside move after the inverse head and shoulders completes.
Depending on this distinction, entry price, stop-loss location, and profit target will differ.
Furthermore, there is also a method of aiming for the price’s move from the right shoulder up to the neckline itself.
For example, if the right shoulder forms near an important support line and breaks a short-term downward trendline, you can regard the neckline as the profit-taking target.
This approach targets the ascent before the large inverse head and shoulders completes.
Therefore, you must distinctly differentiate strategies aimed at early upside within the inverse head and shoulders from those aiming at additional upside after completion.
For instance, if you enter on the right shoulder and take profit near the neckline, and then clearly breakout above the neckline, you can consider a separate upside scenario.
However, increasing the number of entries does not automatically increase profit.
In particular in 1-minute scalping, repeatedly trading in a short time can magnify costs such as spreads.
Thus, it is important to enter only under conditions that have been proven to provide an edge, rather than focusing on quantity of trades.
Now, let us consider a concrete example of inverse head and shoulders formation.
For instance, in USD/JPY on a 1-minute chart, price falls and forms the left shoulder around 150.100 yen.
It then rebounds to 150.170 yen, but falls again to form the head at 150.050 yen.
After a further rebound to 150.180 yen, price falls again and finds support near 150.120 yen, forming the right shoulder.
Here, the left shoulder is 150.100 yen, the head is 150.050 yen, and the right shoulder is 150.120 yen.
The highs between the left shoulder and head is 150.170 yen, and the highs between the head and right shoulder is 150.180 yen, giving a neckline that slopes slightly upward.
If price then clearly breaks above the neckline, consider the inverse head and shoulders complete.
But importantly, do not enter simply because the neckline was breached.
For example, if the breakout occurs at 150.190 yen, and you set your stop below the right shoulder low at 150.120 yen, the stop distance would be more than 7 pips.
Meanwhile, if the next major resistance line sits near 150.230 yen, the distance to it is about 4 pips.
Therefore, completing the inverse head and shoulders does not automatically mean you must buy at that price.
You can consider waiting for a return move or base your entry on a new minor higher low after the neckline breakout.
Of course, these are hypothetical price figures and do not guarantee the same price action in actual markets.
The important point is to specifically set stop-loss and profit targets after confirming the pattern’s completion.
Moreover, in 1-minute scalping, even the same inverse head and shoulders can exhibit different price-movement characteristics depending on the time of formation.
For example, in Tokyo time the pattern may form with relatively small moves; in London or New York, when activity is higher, a larger move may occur.
However, there is no guarantee that a particular time window will produce a trend.
What matters is the actual price action and the volatility observed.
For instance, when breaking above the neckline, if a long bullish candle appears repeatedly, short-term upside momentum may be strengthening.
But right after, prices may drop sharply again.
In high volatility scenarios, the distance between entry and stop-loss tends to widen.
Therefore, when considering how much upside remains after neckline breakout, base it on actual entry and exit prices rather than assume theoretical gains.
Additionally, if the inverse head and shoulders forms during a high-volatility period around an economic release, spreads can widen significantly despite a clean pattern.
In such cases, even if the pattern looks perfect, trading conditions may be unfavorable.
Thus, it is crucial to assess not only the pattern’s shape but also actual price moves and trading costs.
Another important aspect is the height of the right shoulder’s formation compared to the head, i.e., how much the low has been raised as the right shoulder forms.
For example, if the head’s low is 150.000 yen and the right shoulder’s low is 150.010 yen, the right shoulder forms 1 pip above the head.
If the right shoulder’s low is 150.050 yen, it is 5 pips above the head.
Both are higher lows, but the magnitude differs.
Here, do not judge simply by how many pips higher the right shoulder is above the head.
If overall market volatility is very low, even a 1-pip higher-low can be a relatively large move for that period.
Conversely, in high volatility, a 5-pip higher-low might fall well within normal price variation.
Hence, when evaluating the right shoulder’s higher-low breadth, consider the overall market volatility as well.
For example, using ATR can help gauge the average range over a period.
However, a large ATR does not always mean a strong trend.
ATR measures the magnitude of price movement, not the direction.
The key is to understand how large the right shoulder’s higher-low breadth is relative to the current market environment.
Furthermore, after forming the head, sometimes the right shoulder forms at a very shallow level.
For example, after a strong initial rebound, price may dip only slightly before rising again.
In this case, the right shoulder’s low will be significantly higher than the head’s low.
This suggests a relatively small correction following the head’s ascent.
Nevertheless, a shallow right shoulder does not automatically lead to strong upside moves.
Determining whether a shallow correction should be called a right shoulder can sometimes be ambiguous.
What matters is which high from the head’s rise was broken, which low from the right shoulder was held, and whether the neckline could then be broken.
In other words, it’s important to assess price structure across the sequence rather than judging only the right shoulder’s shallowness.
Additionally, combining the inverse head and shoulders with Fibonacci retracement is another approach.
For example, draw Fibonacci retracement from the head’s low to near the neckline, and observe whether the right shoulder’s decline halts near 38.2%, 50%, or 61.8%.
If price stalls near those levels and coincides with horizontal lines or moving averages, you can analyze them as potential pullback entries.
However, a Fibonacci ratio alone does not guarantee completion of the inverse head and shoulders.
The crucial factor is whether the right shoulder’s low is sustained and whether the price breaks a short-term higher retracement high afterward.
Also, the levels of 38.2% and 61.8% do not guarantee a bounce; they serve only as reference for the depth of a pullback within a range.
Thus, the right shoulder’s decline can be viewed as a pullback to the head’s ascent, rather than a simple price drop.
Moreover, combining the inverse head and shoulders with Wolfe waves is another analytic option.
For instance, as price repeatedly renews lows toward the end of a downtrend, the momentum of the descent may gradually change, forming patterns reminiscent of an inverse head and shoulders.
However, the Wolfe wave and inverse head and shoulders are different chart patterns.
In inverse head and shoulders, the head is the lowest point, and the ascent from the right shoulder and the neckline breakout are crucial.
Meanwhile, Wolfe waves analyze the position relationships of multiple waves, convergence/divergence structures, and certain geometric conditions.
Therefore, merely noting a resemblance to inverse head and shoulders does not make Wolfe waves applicable.
Nonetheless, in situations where both conditions may be satisfied, you can treat the bases of each as distinct and evaluate them accordingly.
The important thing is not to name several chart patterns but to explain price structure in a coherent way.
Further, a particularly interesting aspect of inverse head and shoulders is the occurrence of the pattern during an uptrend.
Inverse head and shoulders is generally known as a reversal pattern from downtrend to uptrend.
But in actual markets, it can form during an uptrend, for example during a clear uptrend on the 15-minute chart while a 1-minute chart shows a temporary downtrend forming the inverse head and shoulders.
In such a case, the 1-minute inverse head and shoulders suggests a shift from downtrend to uptrend, while the 15-minute chart may view it as a pullback within a larger uptrend.
Thus, the inverse head and shoulders is not only a pattern for catching a bottom in a downtrend, but can also be used to evaluate whether a minor downtrend may end within a larger uptrend.
This perspective can be especially useful in 1-minute scalping, where you can align a short-term countertrend with the larger uptrend on the higher timeframe.
For instance, confirm the 15-minute uptrend by higher highs and higher lows on that timeframe.
Then observe the 5-minute chart for a pullback toward an important support line and check whether the 1-minute inverse head and shoulders forms and breaks the neckline, combining with the higher timeframe support and the lower timeframe price-structure changes.
This approach helps you consider trading direction on higher timeframes and timing on lower timeframes.
However, just because the 15-minute chart is in an uptrend does not guarantee the 1-minute inverse head and shoulders will succeed.
There is also a possibility that the 15-minute uptrend ends and gives way to a downtrend.
Hence, you must also verify whether a crucial supporting low on the higher timeframe remains intact.
Conversely, if the 15-minute chart forms a clear downtrend, the appearance of an inverse head and shoulders on the 1-minute chart may lead to a short-term rebound that ends quickly.
For example, if the 1-minute inverse head and shoulders completes and price rises, but the 15-minute chart shows a strong resistance nearby, price may reverse here.
In such cases, the 1-minute signal may be a short-lived breakout within a broader downtrend on the 15-minute chart.
Therefore, there is no universal best method; the key is to clarify what price levels or conditions underlie each entry method, where to place stops, and where to take profits.
Additionally, you can pursue the larger move from the right shoulder up to the neckline as an entry strategy, or you can target the break of the neckline after forming the right shoulder as a different approach.
Entering on the right shoulder and exiting near the neckline can be one path, and waiting for a neckline breakout for a separate upside scenario is another.
However, increasing the number of entries does not guarantee greater profits, especially in 1-minute scalping where spreads and costs accumulate with frequent trades.
Therefore, it is more important to enter under conditions that demonstrate an edge than to maximize trade count.
Now, let us consider a concrete inverse head and shoulders formation example.
For instance, in USD/JPY on a 1-minute chart, price declines and forms the left shoulder around 150.100 yen.
It then rebounds to 150.170 yen, but falls again to form the head at 150.050 yen.
After another rebound to 150.180 yen, price declines again and finds support near 150.120 yen, forming the right shoulder.
Here, the left shoulder is 150.100 yen, the head is 150.050 yen, and the right shoulder is 150.120 yen.
The highs between the left shoulder and head are 150.170 yen, and the highs between the head and right shoulder are 150.180 yen, so the neckline slopes gently upward.
If price then clearly breaks above the neckline, consider the inverse head and shoulders complete.
Yet, it is crucial not to enter just because the neckline was broken.
For example, if the breakout price is 150.190 yen, and you place your stop a little below the right shoulder low at 150.120 yen, the stop distance would be more than 7 pips.
Meanwhile, if the next major resistance line sits near 150.230 yen, the range to it is about 4 pips.
In such a case, the potential profit might be smaller than the risk.
Therefore, completing the inverse head and shoulders does not imply you must buy at that price.
You can consider waiting for a return move or basis an entry on a new minor higher low after the neckline breakout.
Of course, these are hypothetical figures and do not guarantee the same price action in real markets.
The important point is to explicitly set stop-loss and profit targets after confirming the pattern’s completion.
Additionally, in 1-minute scalping, even the same inverse head and shoulders can exhibit different price-movement characteristics depending on the formation time.
For example, on Tokyo time the pattern may form with relatively small moves.
Conversely, during London or New York sessions, activity increases and the pattern may form with larger moves.
Nevertheless, there is no guarantee that a particular time window will produce a trend.
What matters is actual price action and observed volatility.
For instance, when breaking above the neckline, if a long bullish candle appears repeatedly, short-term upside momentum may be strengthening.
However, prices can suddenly reverse and fall sharply again afterward.
In high volatility scenarios, the distance between entry and stop-loss can widen.
Thus, when considering how much upside remains after neckline breakout, base it on actual entry and exit prices rather than assume theoretical gains.
Additionally, if an inverse head and shoulders forms around an economic release, spreads can widen significantly due to large price moves.
In such cases, even if the pattern is visually perfect, trading conditions may be unfavorable.
Therefore, it is crucial to assess not only the pattern’s shape but also actual trading costs and price volatility.
Another important consideration in analyzing the inverse head and shoulders is the width by which the head’s low is raised into the right shoulder, i.e., the amplitude of the increase in the right shoulder’s low as the pattern forms.
For example, if the head’s low is 150.000 yen and the right shoulder’s low is 150.010 yen, the right shoulder is formed 1 pip above the head.
If instead the right shoulder’s low is 150.050 yen, it is 5 pips higher than the head.
Both are higher lows, but the magnitudes differ.
It is important not to judge only by how many pips higher the right shoulder is than the head.
For instance, in a market with very low volatility, even a 1-pip higher-low can represent a relatively large change for that time frame.
On the other hand, in high volatility, a 5-pip higher-low may still fall within a normal price variation range.
Therefore, when evaluating the right shoulder’s higher-low breadth, you should also consider overall market volatility.
Using tools such as ATR can help gauge the average price range over a period.
However, a large ATR does not automatically indicate a strong trend.
ATR reflects the magnitude of price movement and does not directly indicate direction.
The key is to understand how large the right shoulder’s higher-low breadth is relative to the current market environment.
Additionally, sometimes the right shoulder forms at a very shallow level after the head.
For example, after a big rebound from the head, price may dip only slightly before rising again.
In such a case, the right shoulder’s low is significantly higher than the head’s low.
This indicates the subsequent adjustment after the head’s rise was relatively small.
Nevertheless, a shallow right shoulder does not guarantee a strong ascent.
Determining whether a small pullback should count as a right shoulder can be tricky.
What matters is which high from the head’s ascent was breached, which lows from the right shoulder were held, and whether the neckline could then be breached.
In other words, avoid judging only the right shoulder’s shallowness; evaluate the surrounding price structure as well.
Furthermore, combining inverse head and shoulders with Fibonacci retracement is another analytical approach.
For example, draw a Fibonacci retracement from the head’s low to the neckline region, and observe whether the right shoulder’s decline halts around 38.2%, 50%, or 61.8%.
If that price area coincides with a horizontal line or moving average, you can analyze it as a potential pullback entry.
However, a Fibonacci ratio alone does not guarantee completion of the inverse head and shoulders.
What matters is whether the right shoulder’s low is held and whether a short-term retracement high is broken afterward.
Also, there is no guarantee that numbers like 38.2% or 61.8% will always prompt a bounce.
They serve only as reference levels to gauge pullback depth within a range.
Thus, the right shoulder’s decline can be interpreted as a pullback to the head’s ascent rather than a simple drop.
Additionally, you can consider combining inverse head and shoulders with Wolfe waves as another analytical method.
For example, when price repeatedly renews lows toward the end of a downtrend, it may form patterns reminiscent of an inverse head and shoulders.
However, inverse head and shoulders and Wolfe waves are distinct chart patterns.
In inverse head and shoulders, the head is the lowest point, and the ascent from the right shoulder and the neckline breakout are crucial.
In Wolfe waves, you analyze the relative positions of multiple waves, convergence/divergence structures, and certain geometric conditions.
Therefore, simply noting a resemblance to inverse head and shoulders does not validate Wolfe waves.
Nevertheless, in situations where both conditions could be satisfied, you can evaluate their bases separately.
The key is not to force a label on multiple patterns but to explain price structure coherently.
Moreover, an especially interesting aspect of inverse head and shoulders is when the pattern appears during an uptrend.
Inverse head and shoulders is typically viewed as a reversal pattern from downtrend to uptrend.
Yet in real markets it can form during an uptrend, for example when the 15-minute chart shows an ongoing strong uptrend while the 1-minute chart shows a temporary downtrend forming the inverse head and shoulders.
In such a case, the 1-minute inverse head and shoulders suggests a shift to the upside, while the 15-minute chart may interpret it as a pullback within a larger uptrend.
Thus, the inverse head and shoulders is not only a bottom-catching pattern in a downtrend, but can also be used to analyze whether a minor downtrend may end within a larger uptrend.
This approach can be particularly useful in 1-minute scalping, where you can align a short-term trend change on the lower timeframe with the uptrend on higher timeframes.
For example, confirm on the 15-minute chart that highs and lows are rising.
Then observe whether the 1-minute chart forms an inverse head and shoulders and breaks the neckline, combining that with the higher-timeframe support and the lower-timeframe price-structure changes for analysis.
This approach helps you consider the direction of trades on higher timeframes and seek entry timing on lower timeframes.
However, just because the 15-minute chart is in an uptrend does not guarantee success for the 1-minute inverse head and shoulders.
There is a possibility that the 15-minute uptrend ends and the price moves into a downtrend.
Therefore, you must verify not only the higher timeframe direction but also whether crucial pullback lows remain intact.
On the other hand, if the 15-minute timeframe forms a clear downtrend, the appearance of the inverse head and shoulders on the 1-minute chart may lead to a short-term rebound that ends quickly.
For example, if the 1-minute inverse head and shoulders completes and price rises, but the 15-minute chart shows a strong resistance nearby, the price could fall at that price zone.
In other words, on the 1-minute chart the setup may suggest a shift to an uptrend, while on the 15-minute chart it remains a retracement within a downtrend.
What matters is that trends on different timeframes do not always align in the same direction.
On the 1-minute chart you may observe an uptrend, while on the 5-minute chart you may see a ranging market, and on the 15-minute chart, a downtrend.
Thus, once you discover the inverse head and shoulders on the 1-minute chart, always also check the relationship of the higher-timeframe highs and lows.
Additionally, combining the inverse head and shoulders with moving averages is another approach.
For example, display 20-period EMA and 80-period EMA on the 1-minute chart.
In a clear downtrend, the 20-EMA may lie below the 80-EMA, with candles trading below the 20-EMA.
If the left shoulder and head form and price shifts to the right shoulder’s decline, the right shoulder’s decline may stall near the 20-EMA and turn upward again.
In such a case, the 20-EMA which had been a short-term resistance may begin to act as support.
However, breaking above the 20-EMA does not automatically end the downtrend.
Especially when the 80-EMA sits above, price may rise but be stopped near the 80-EMA.
Therefore, it is necessary to check not only the relative positions of the 20-EMA and 80-EMA, but also whether candles have broken important retracement highs.
Furthermore, even with the 20-EMA below the 80-EMA, price structure can change upward earlier than the EMAs suggest.
EMA is calculated from past prices, so it inherently lags during sharp price moves.
Hence, when using the 1-minute inverse head and shoulders, you do not necessarily need to wait for a golden cross of moving averages to confirm a breakout.
For instance, at the breakout moment, the 20-EMA might still be below the 80-EMA, but later price action could turn the 20-EMA upward toward the 80-EMA, indicating a change in price structure.
In such cases, the change in price structure and the moving averages’ position changes do not always occur at the same time.
Moreover, there is also a method to combine inverse head and shoulders with MACD divergence.
For example, after forming the left shoulder, price declines and the head’s low becomes lower than the left shoulder’s, yet the MACD line’s lows may be higher than during the left shoulder.
This suggests that although prices are making new lows, the MACD momentum to the downside may be weakening compared to before.
This condition is called a bullish divergence.
What’s interesting here is that momentum can change even while the price continues to decline, indicating a potential shift in dynamics.
However, a divergence does not mandate buying entries immediately.
Prices may still push lower, and the downtrend may continue.
Therefore, after a divergence, observe whether a right shoulder forms in the subsequent price action.
For example, if price rebounds from the head but then declines again and fails to renew the head’s low, a right shoulder is forming, and the candlestick lows are rising.
If the price then breaks above the neckline from the right shoulder, indicating a structural upside movement, you can consider a bullish entry.
If a divergence persists but a breakout from the neckline occurs, you may still be able to participate in an upside move later.
But the turning point is to compare momentum changes (MACD divergence) with price-structure changes (inverse head and shoulders) to determine entries more reliably.
However, since MACD is also calculated from historical prices, a divergence alone cannot predict market reversals.
In particular on the 1-minute timeframe, smaller divergences appear frequently.
Thus, it’s important to consider not only MACD changes but also whether price actually breaks essential retracement highs.
Additionally, around the right shoulder there are times when MACD histogram contracts from negative territory and approaches the zero line.
This indicates the MACD line and the signal line are converging toward a bullish cross.
Nevertheless, a histogram turning positive and a MACD golden cross are the same phenomenon, so they should not be counted as two independent buy signals.
What matters is correlating MACD momentum changes with candlestick price-structure changes.
Furthermore, when analyzing the inverse head and shoulders, pay attention to the time it takes for the right shoulder to form.
For example, the head-to-head formation may be quick, while the head-to-right shoulder period may take a long time, during which price moves sideways near the top or range.
In such cases, a consolidation may be forming during the right shoulder formation.Why did the decline stop at the right shoulder?
If the consolidation’s upper bound is breached, it can lead to a short-term upside advance.Why did it become possible to break through the neckline?
However, a prolonged consolidation does not guarantee an upside breakout, and a break below the consolidation’s lower bound can resume the downtrend.After breaking through the neckline, why does that price range sometimes serve as a support?
Thus, judge not only by the length of consolidation but also by which direction price ultimately breaks through.And, despite breaking through the neckline, why can there be cases where the rise fails?
Moreover, if the time to form the right shoulder is long, the neckline’s position and angle may change over time.It is important to analyze such changes in price action from multiple angles using candlesticks, horizontal lines, trend lines, Dow Theory, moving averages, MACD, and multiple time frame analysis.
Particularly when using a sloped neckline, the breakout level can shift as time passes.In particular, for 1-minute scalp trading, because one aims for tiny price moves, the entry price range and the cutoff line position become extremely important.
Therefore, focusing only on the neckline may mislead you into thinking a real high was broken when it has not.No matter how clean a head-and-shoulders bottom forms, if the distance to the next resistance line is short or the stop-loss range is too wide, there are times when you should refrain from trading.
In such situations, combining horizontal lines and Dow Theory is important.Conversely, if an inverse head-and-shoulders forms in a pullback aligned with the higher-timeframe uptrend, and the right shoulder completes near an important support line and the neckline is broken to the upside, there are multiple factors that support considering a long entry.
Additionally, a key aspect of inverse head and shoulders analysis is the characteristics of candlestick bodies and wicks formed at the shoulders.However, even if there are multiple supporting factors, it does not guarantee a win.
For example, at the left shoulder, a series of long bearish candles with long lower wicks forming rebounds may occur.What matters is understanding what each fundamental implies and making buy/sell decisions aligned with the actual market environment.
Later, during the head formation, the lows might be renewed, but bullish candles with long lower wicks could appear and rebound again.The left shoulder of an inverse head-and-shoulders can form as part of a prior downtrend.
In the right shoulder, the head’s low may not be renewed, and small bearish candles followed by bullish candles may appear, signaling a different pattern of rebounds at each trough.In the head, the price may make new lows, but a rebound then occurs.
In this case, the rebound patterns across troughs differ.In the right shoulder, the price may fail to make a new low and find support.
Nevertheless, a small bearish candle in the right shoulder does not automatically mean buyers have the upper hand; volatility may simply be lower.Then, with a breakout above the neckline, there is movement that breaches previously unreachable highs.
Thus, you should analyze the location of the lower wicks, candle close prices, latest highs, and responses at support lines.Once you understand this price structure change, you can use the inverse head-and-shoulders not merely as a memorized chart pattern, but as practical discretionary analysis material.
Particularly in 1-minute scalping, the price zone where the candle forms is more important than the candle’s shape alone.The essence of the inverse head-and-shoulders is not the shape of the three valleys itself.
For example, if the right shoulder forms near a major higher-timeframe support line and a bullish candle with a long lower wick appears, you can observe the support line response and the right shoulder formation simultaneously.It is about how the sequence of lower highs and lower lows in the prior downtrend breaks down and what process leads to that breakdown.
On the other hand, if such a bullish candle appears in a location without a crucial horizontal line, it may not be a strong buying signal.And it is important to judge from actual price movements whether that change truly develops into an uptrend or ends in a temporary rebound or a whipsaw.
What matters is understanding not only the candle’s shape but the market environment in which it formed.By combining the head, right shoulder, neckline, return move, whipsaw, and the higher-timeframe trend structure, you can organize trading scenarios for 1-minute scalp trading more specifically.
Moreover, using inverse head and shoulders on 1-minute scalping, it is extremely important to confirm upside potential after neckline breakout. Mastering inverse head-and-shoulders is not about finding perfectly shaped patterns.
For example, suppose the inverse head and shoulders forms and clearly breaks above the neckline.From the stage where the downtrend continues to the formation of the head and right shoulder, the breakout of the neckline, and the price movement after the breakout, you should understand how the market price structure is changing.
But if a strong resistance line on the 15-minute timeframe sits just above, price may stall near that zone after the breakout.And by objectively confirming these changes and building entry, stop-loss, and take-profit conditions accordingly.
In that case, do not buy solely because you broke the neckline; assess how much price movement remains to the next resistance line. The inverse head-and-shoulders is not a magic chart pattern to reliably hit market bottoms.
Especially in scalping, a few pips can significantly affect profitability.However, by combining Dow Theory high/low structure, horizontal lines and trend lines, candlestick price action, moving averages, and multi-timeframe analysis, you gain a powerful basis to analyze price structure changes from downward momentum to upward direction.
For example, if the breakout price is above the neckline by only 2 pips and the next resistance line lies 5 pips away, the risk-reward may be unfavorable.And rather than simply jumping on the fact that the inverse head-and-shoulders is complete, it is important to clarify where the current price sits, how far it can rise, and which price level, if broken below, would invalidate your buy scenario.
Conversely, if there is substantial upside potential after the neckline breakout and you can set stops at reasonable levels, you can more easily consider a trading scenario. By thoroughly applying this thinking, you can use inverse head-and-shoulders not as a mere buy signal, but as a practical discretionary analysis focusing on market environment recognition and price action for disciplined 1-minute scalp trading.