
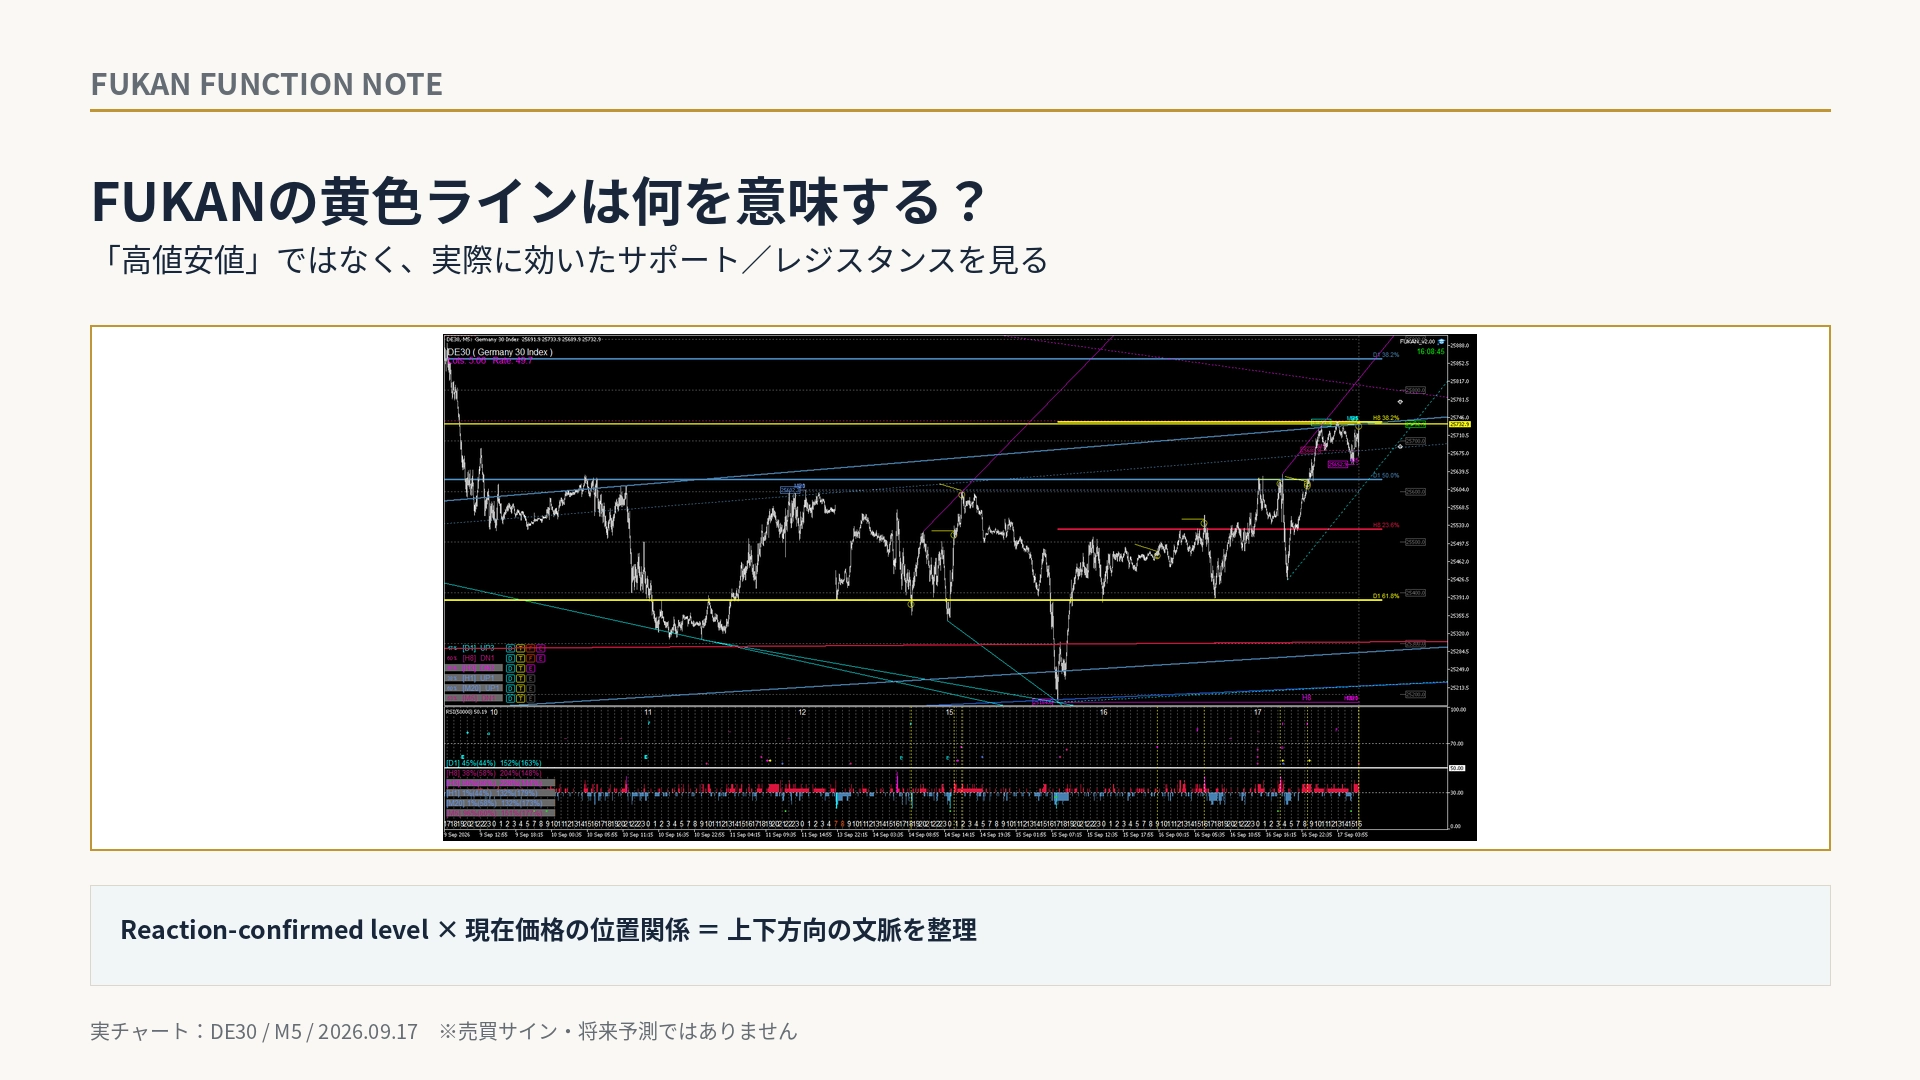
What does FUKAN's yellow line signify? It isn't about "highs and lows"—it's about the actual support/resistance that worked.
What does FUKAN's yellow line mean? — Not just “high/low” but actual supports/resistances that worked
In FUKAN charts, there are lines highlighted in Yellow / Goldenrod and short yellow traces.
If you view this yellow as merely a "reversal mark," the original meaning of why FUKAN leaves yellow behind is not conveyed enough.
The aim of the yellow line is to visualize levels where price was actually supported or resisted, independently from structural turning points like Dow's highs and lows.
In other words, among the lines that exist on the chart, it highlights the levels that have a history of actual market reaction, and displays their relationship to the current price.
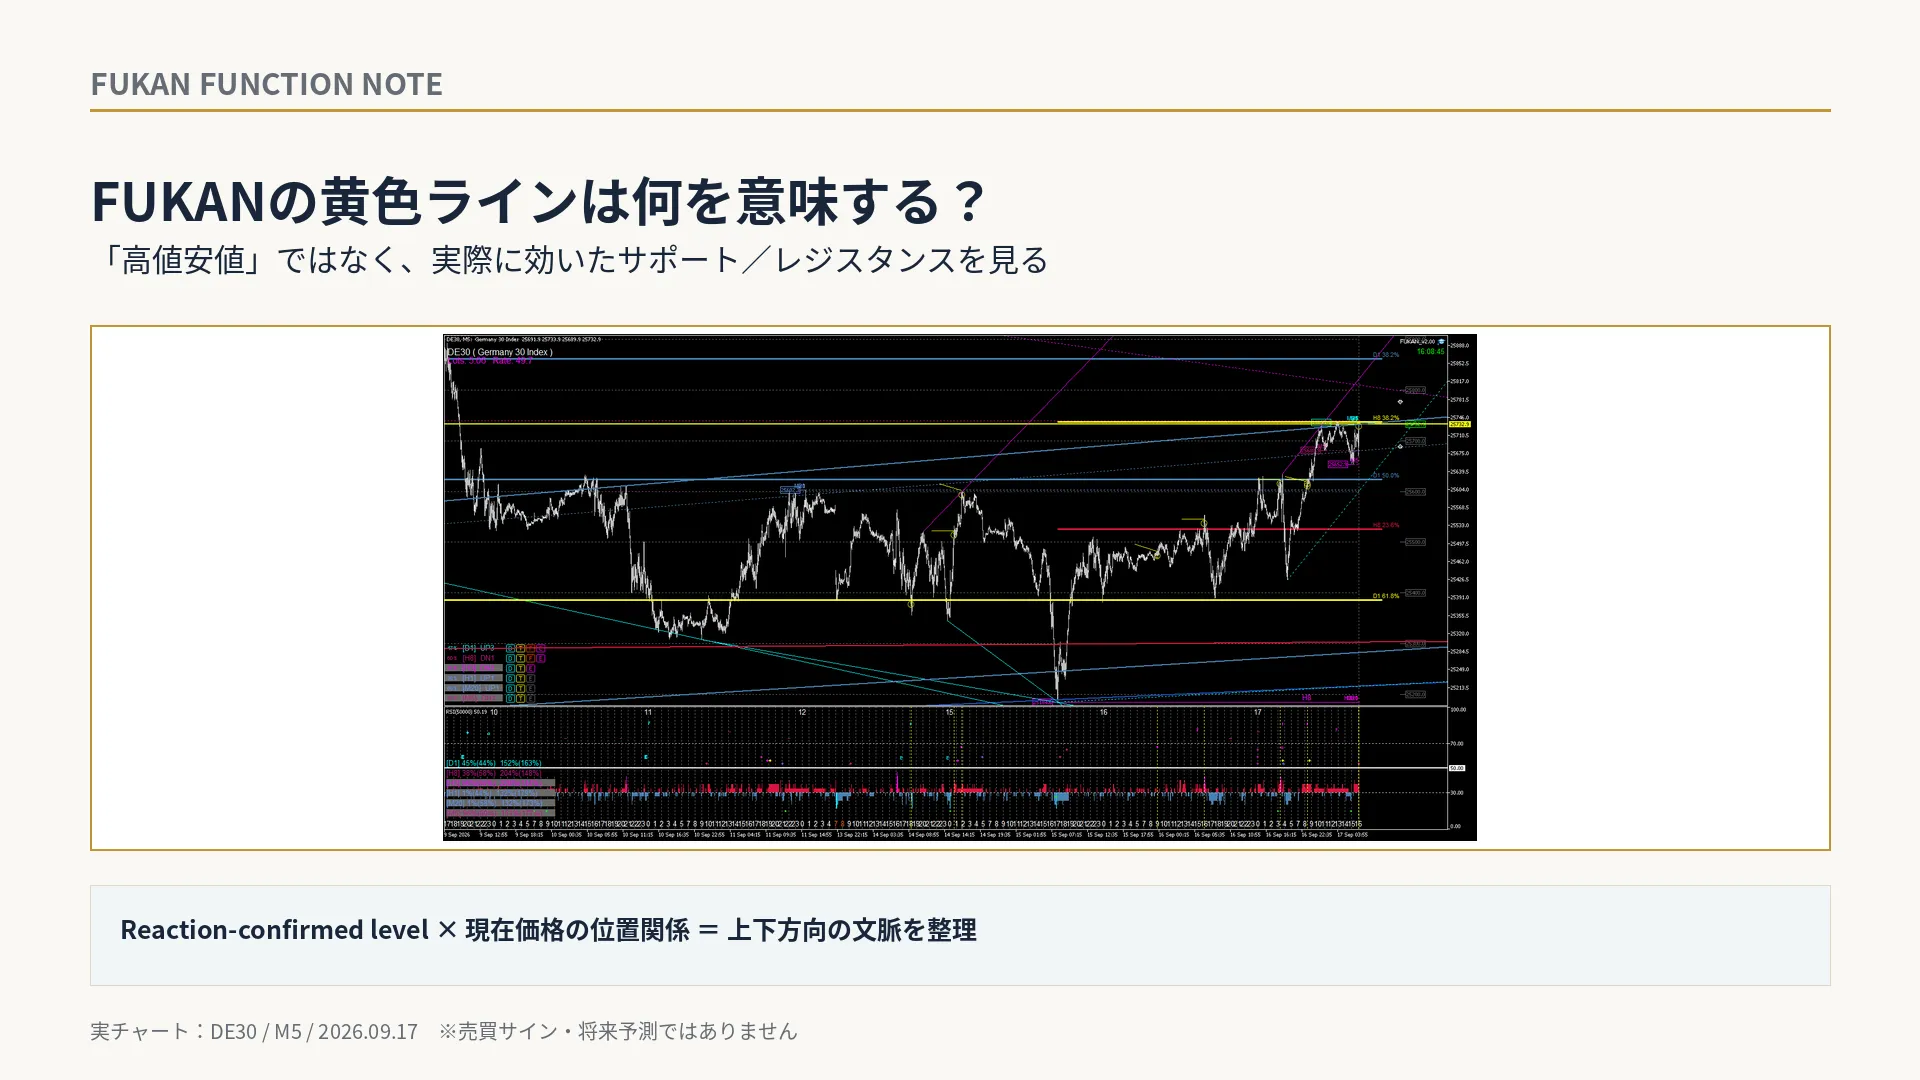
1|Dow highs/lows and the yellow line have different roles
Dow highs/lows are important benchmarks for understanding market structure.
However, it does not mean that “a high will always be resistance” or “a low will always be support.”
In FUKAN, separately from structural lines, lines that have a history of price actually stopping or being supported are emphasized in Yellow / Goldenrod.
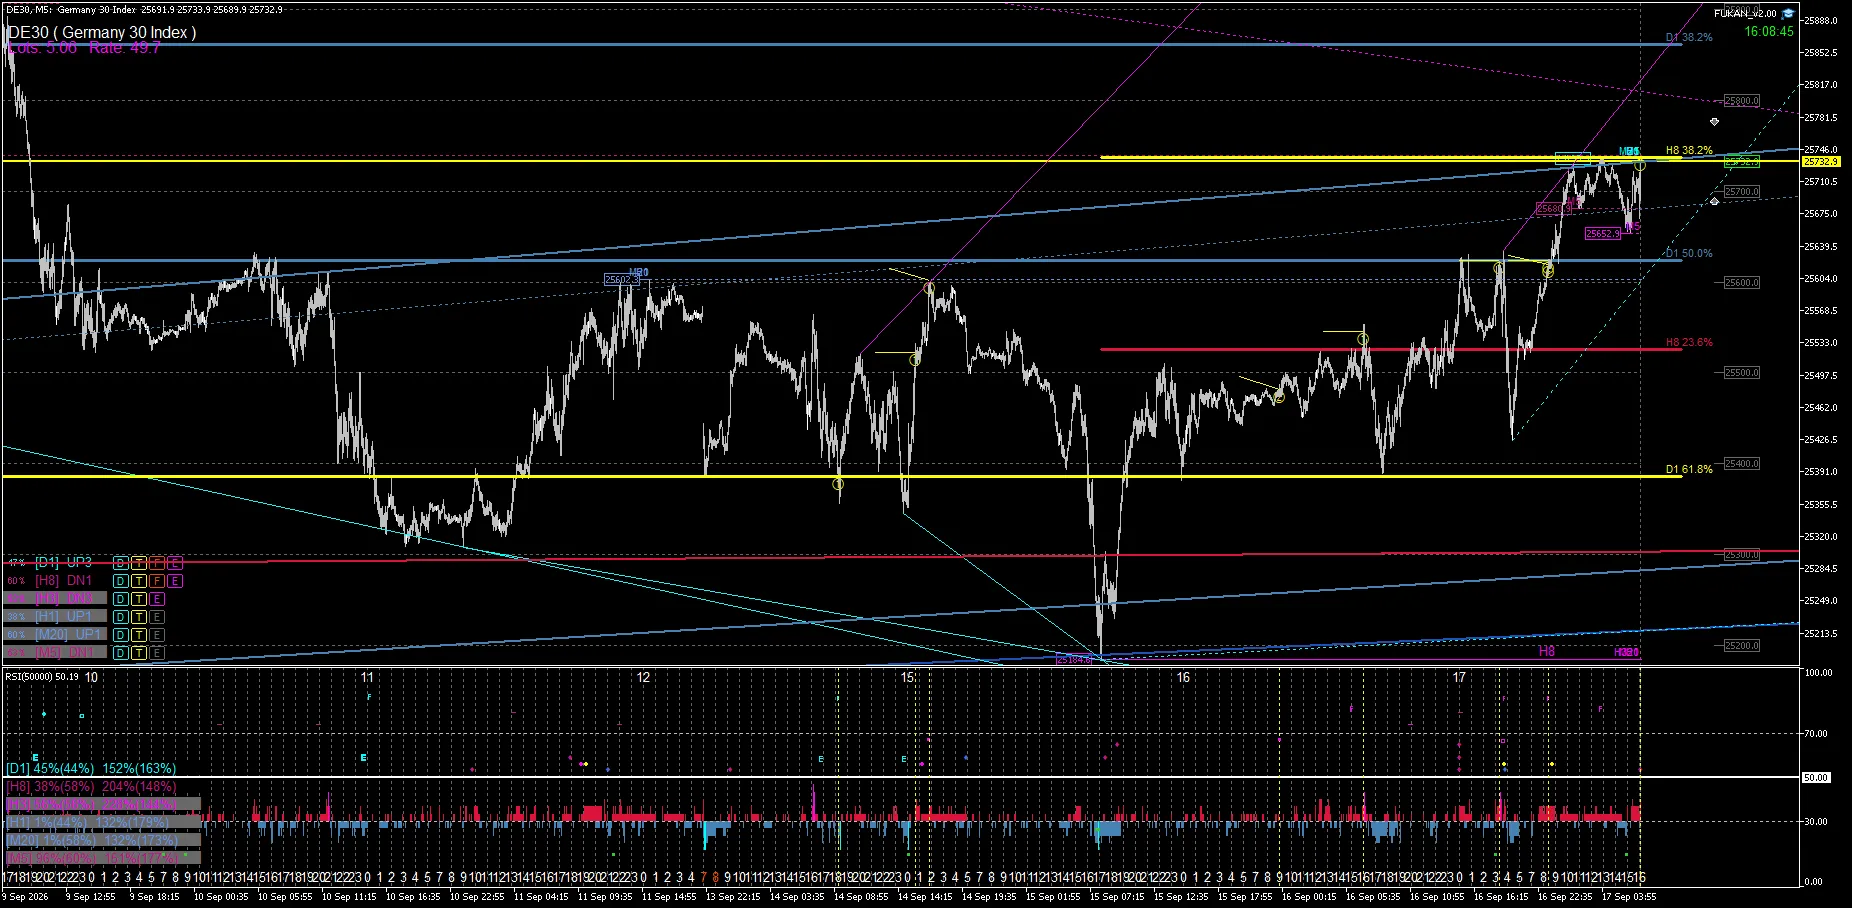
The above DE30 is an actual chart as of September 17, 2026. The short yellow lines and the levels highlighted in yellow indicate that “price reacted at this place in the past.”
What’s important is not that “yellow means the next move will be a rebound.”
Yellow is not a predictive probability; it’s information to help you not lose track of price levels that have actually worked in the past on the current chart.
2|If resistance stops it, it’s the downward context
Suppose there is a yellow line that actually halted the upside.
If price rises to that line but is stopped again and remains below the line, that level is functioning as resistance.
In this case, in FUKAN, you can view the relationship as a downward context:
“the price is below a resistance with actual reaction history”
as the downward context.
This does not mean that the yellow line is issuing a SELL signal.
It simply organizes the relationship between a level that actually stopped the price in the past and the current price.
3|If it breaks support and stays below the yellow line, it’s the downward context
Another downward pattern is a break of support.
If the yellow line that had been supporting price is broken to the downside and price remains below the line,
it can be seen as having “lost a level that actually supported.”
The key is not merely whether the low was updated, but whether a level that truly served as support in the past could be maintained.
One reason to keep the yellow line in FUKAN is that it allows you to later verify the relationship between a previously effective level and the current price.
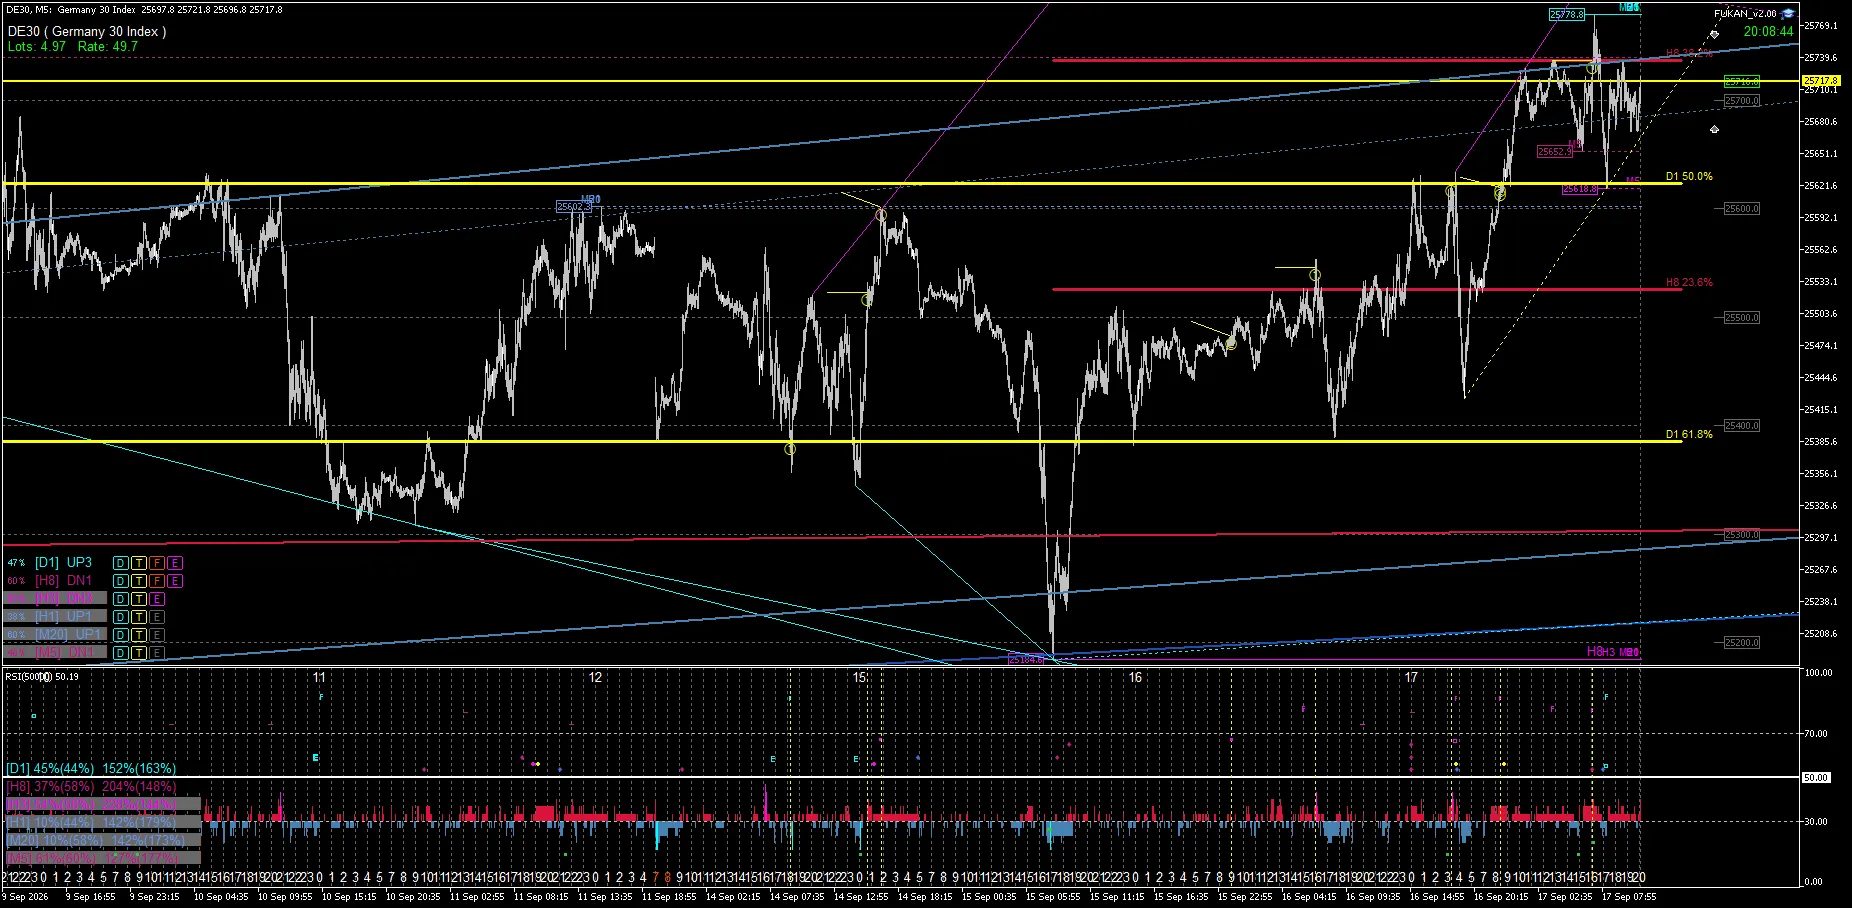
In FUKAN, keeping the yellow line is partly to be able to confirm this kind of past-to-present relationship.
4|If it’s supported by a bottom, it’s the upward context
Conversely, if the yellow line has functioned as support in the past, and price is again stopped at that level and lies above the line, support is being maintained.
In this case, you can view the relationship as an upward context:
“the price is above a support with actual reaction history”
as the upward context.
The key is that it’s based on levels where price really found support, not just on simple lows.
5|If it breaks resistance and is above the yellow line, it’s the upward context
If price breaks above a yellow line that previously stopped upside movement and remains above the line, it becomes an upward context as well.
Because it has broken through what used to be a level that constrained upside, and moved above it.
If price then returns to that line, it may become a target for a return move after the breakout and thus be watched again.
In FUKAN, we don’t just mark a single event like “stopped” or “broke through”; we also examine subsequent position relationships using the same line.
6|Four states make it easy to understand
To summarize how to view the yellow line simply, there are four states:
• Resistance stops the rise and price stays below → downward context
• Break of support and price stays below → downward context
• Support stops the decline and price stays above → upward context
• Break of resistance and price stays above → upward context
What we are looking at here is not the color “yellow” itself.
It’s about how that yellow line was formed by reactions and whether the current price is above or below that level.
7|Yellow trace is a history of re-contact
There are differences between the yellow line and the yellow trace.
Yellow / Goldenrod emphasizes that these lines still have a history of past reactions and are still under observation today.
If the price later recontacts that line effectively, a short yellow trace may appear on the chart.
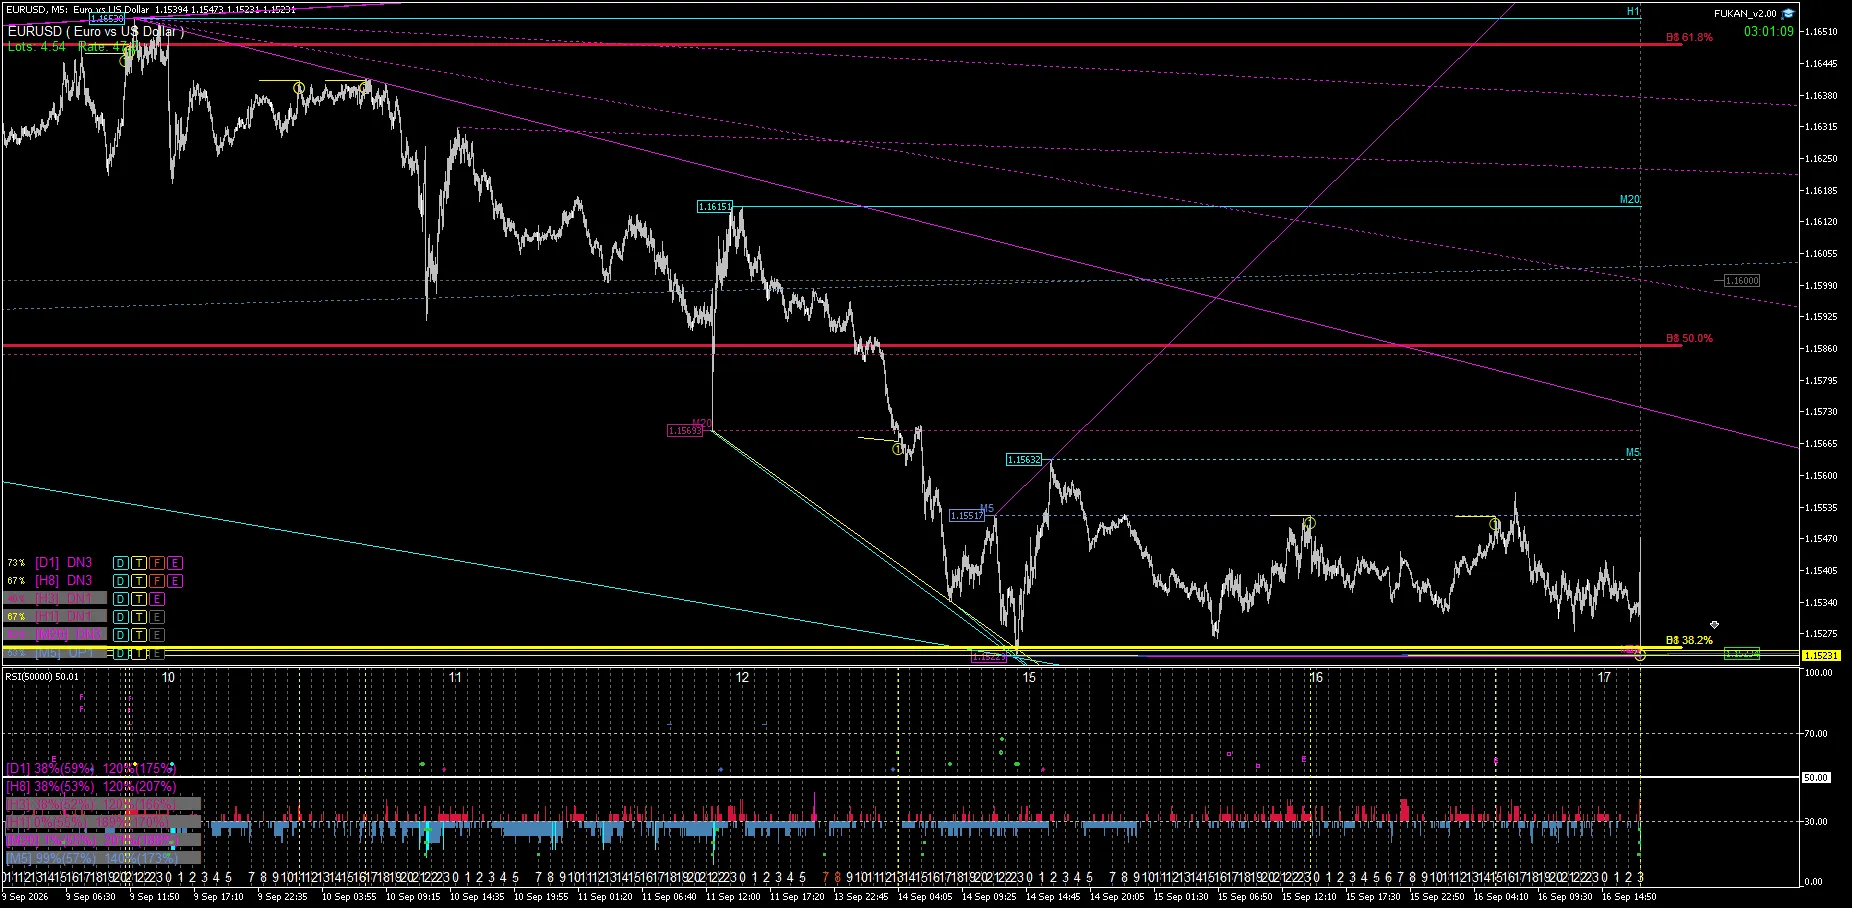
And it does not necessarily mean that it will rebound every time.
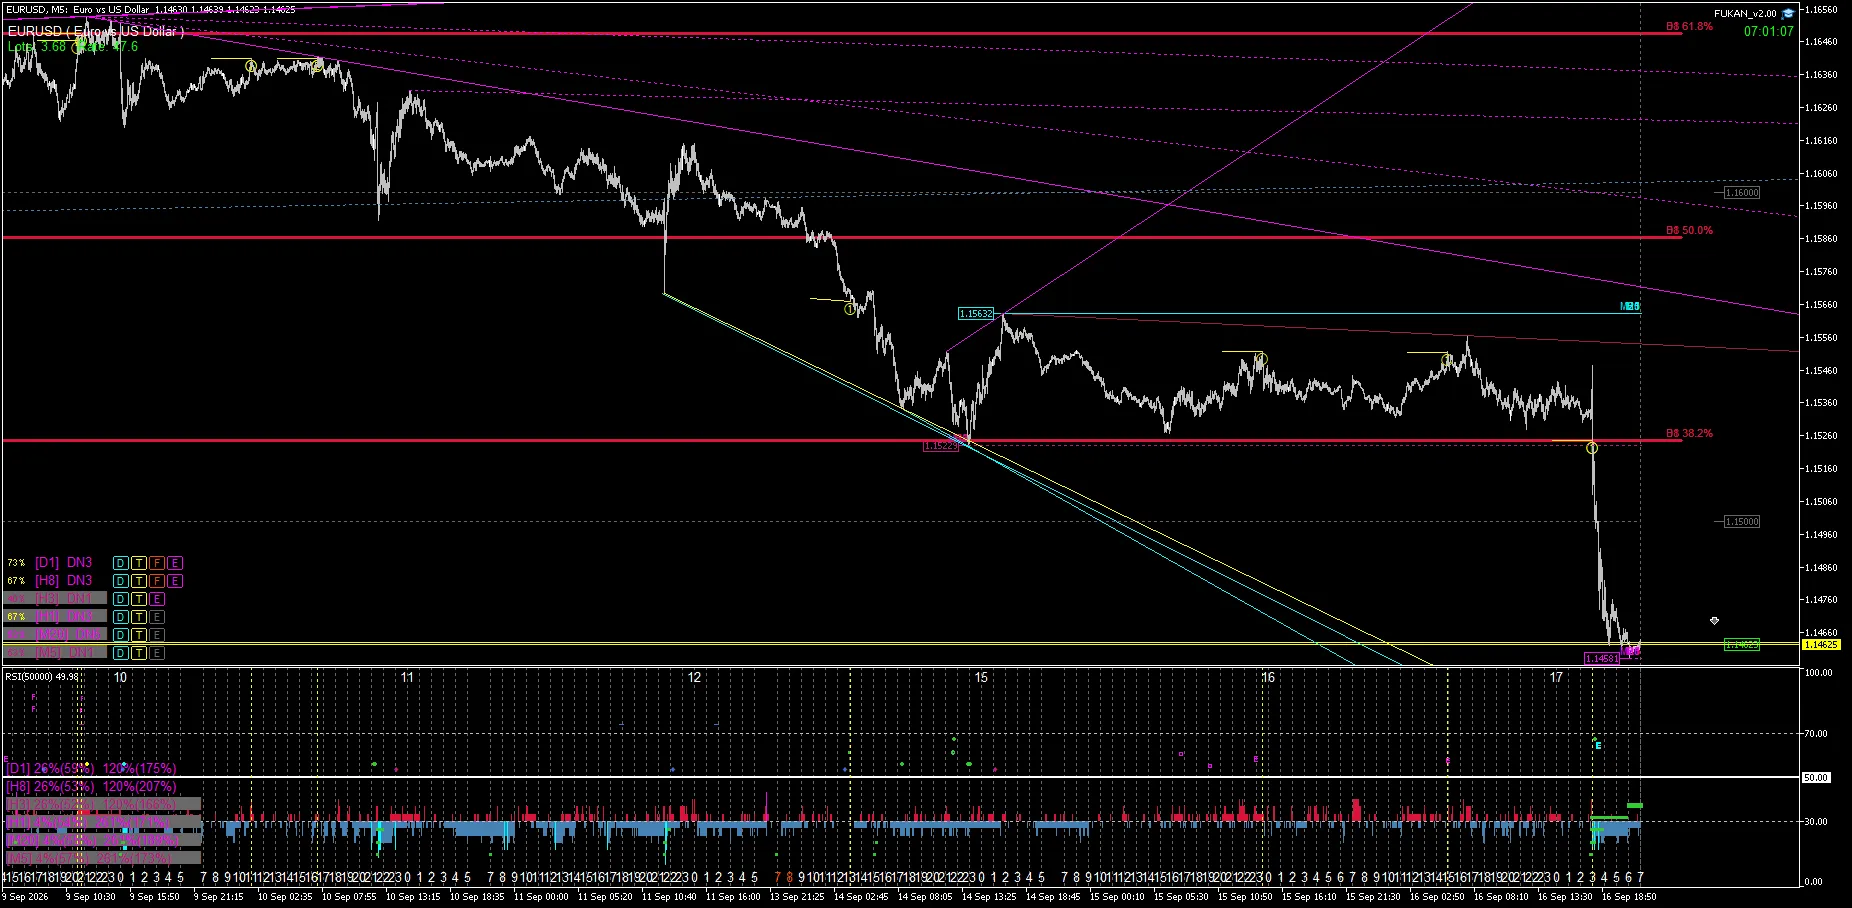
As in the EURUSD above, there are cases where the level is later broken through and moves significantly higher.
The yellow trace is not a buy/sell direction signal by itself; it’s a record of a line that has had a reactive history and where price has re-contacted it.
That is why it also makes sense to leave marks for cases where it is broken, not only those where it rebounded.
8|What FUKAN wants to show with yellow
The role given to the yellow line in creating FUKAN is not merely to increase signals.
Charts contain many structures like Dow, Break High/Low, Trend, Channel, Fibonacci, Elliott, etc.
Among those,
“where is the theoretical turning point”
and,
“among them, where did the market actually react as support/resistance”
are shown separately and can be viewed.
Then, for levels that actually reacted,
whether the current price is above or below, whether it held or broke through.
This is what the yellow line and yellow trace are designed to present as a continuous view.
Summary
FUKAN’s yellow line is not simply a color variation of Dow highs/lows.
It visualizes levels where price was actually supported or resisted.
And when looking at direction,
protecting support / breaking resistance → upward direction
being stopped by resistance / breaking support → downward direction
and confirms the relationship between history of reaction and the current price.
Yellow itself is not a buy/sell signal; it’s information to understand where the market currently sits based on actual price levels that worked.
That’s why the yellow line was created in FUKAN.
※Yellow / Goldenrod is an indication based on past reactions and re-contact history and does not guarantee future rebound probability or profit. Yellow trace and BUY / SELL direction signals are evaluated separately.
※This article explains FUKAN’s functionality and market-structure interpretation and is not investment advice or a buy/sell recommendation.