
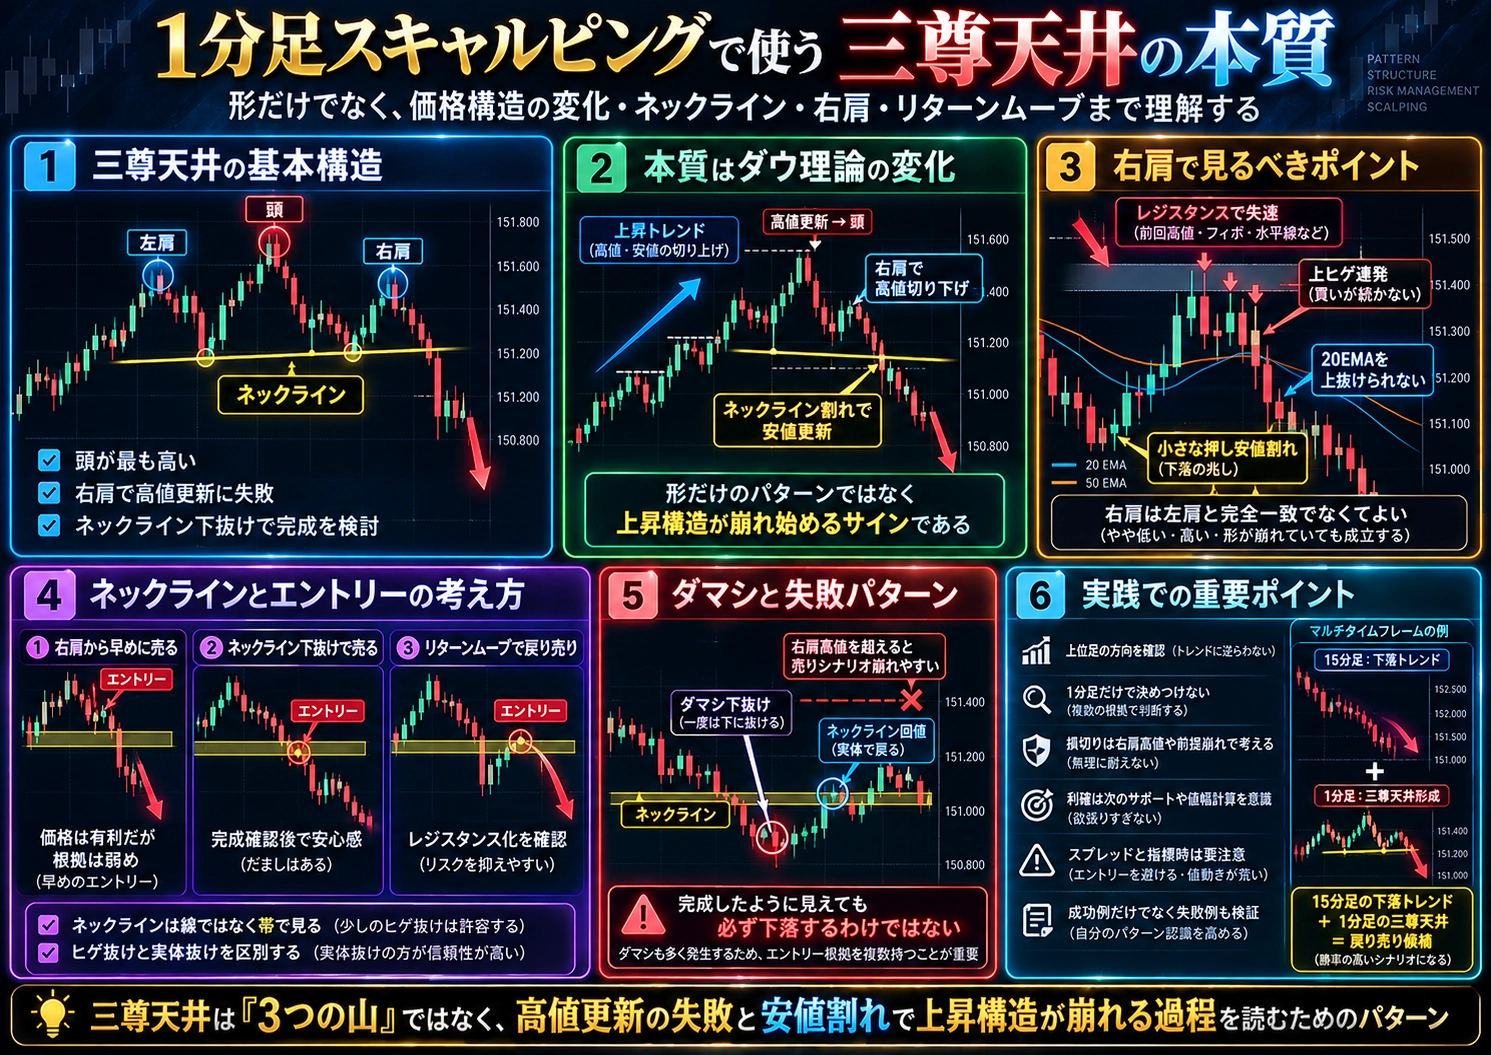
【FX】1-Minute Scalping Ironclad Trade Method. The Ultimate Guide to Head and Shoulders (Triple Top) Explained in an Easy-to-Understand Way by Billionaire Pro Trader Shouta. Recommended for beginners facing big losses: Technical Analysis Introductory Course
In 1-minute scalping of FX, the head and shoulders, also known as the triple top, is one of the highly intricate chart patterns.
Generally, it is known as a chart pattern that appears toward the end of an uptrend and suggests a reversal to a downtrend.
However, the true value of the triple top is not merely finding three peaks and entering a short position.
What matters is understanding how the balance of power between buyers and sellers changes as the triple top forms.
Especially in 1-minute scalp trading, interpreting this shift in power helps determine entry timing.
First, let us understand the basic structure of a triple top.
A triple top consists of three peaks called the left shoulder, head, and right shoulder.
The first peak that rises and forms is the left shoulder.
Then the price falls, rises again, and forms a peak higher than the left shoulder. This is the head.
After another fall, it rises again but fails to exceed the head's high and turns down. This is the right shoulder.
Next, the line connecting the lows between the left shoulder and head, and the low between the head and right shoulder is the neckline.
Generally, the triple top is considered complete when the price breaks below the neckline after the right shoulder forms.
However, just because three peaks have formed does not guarantee a decline will occur.
Even if it appears to be a triple top, the price may subsequently reach new highs again and continue an uptrend.
Therefore, it is important to consider not only the shape but also the background behind the formation of each peak.
What to focus on here is the price structure implied by the left shoulder, head, and right shoulder.
In the stage when the left shoulder forms, the uptrend often continues, with buyers attempting to push to new highs.
Then the price consolidates briefly and again rises, breaking through the left shoulder's high. This is where the head forms.
At this stage, because the candlesticks are updating the left shoulder's high, from a Dow Theory perspective, the uptrend may still be continuing.
However, after forming the head, if the price falls and then rises again yet fails to update the head's high, the situation changes.
The market that had been making higher highs may start making lower highs.
In other words, the formation of the right shoulder indicates a potential change in the uptrend's structure.
Nevertheless, the fact that the neckline has not yet been broken at the right-shoulder stage does not confirm a downtrend.
Only when the price breaks below the neckline to surpass recent lows can a move to a downtrend be confirmed.
This is when the price structure suggesting a shift from higher highs to lower highs and a break of the neckline becomes clearer.
What I personally consider particularly important in analyzing a triple top is the relationship between the lower highs and the lower lows.
I understand the triple top not as a simple geometric figure but as a trend-structure change under Dow Theory.
For example, on a 1-minute chart, suppose the price climbs and forms the left shoulder.
Then it updates the left shoulder high to form the head.
Up to this point, the uptrend’s structure may still be intact.
However, if the subsequent ascent fails to update the head’s high and forms the right shoulder, buyer momentum may be weakening.
And if it breaks below the neckline, the price has failed to maintain the recent high and price may fall.
Understanding this sequence helps you see that the triple top is not just three peaks but a price structure indicating a potential trend reversal.
However, breaking the neckline does not guarantee a downtrend—afterward, the price could rebound and push higher again.
Thus, it is important to observe not only the neckline break but also whether the price continues to move down or whether it sustains a higher low.
Furthermore, in 1-minute scalp trading, paying close attention to the formation of the right shoulder can allow you to consider buy/sell scenarios sooner.
For example, after forming the head, suppose the price falls toward the neckline and then begins to rise again.
At this stage, it is still unknown where the right shoulder will form.
However, when the price approaches a resistance line near the left shoulder, if the upward momentum weakens and a series of candles with upper wicks appears, this provides a clue that the right shoulder may be forming.
Furthermore, if afterward a short-term decline breaks a recent minor low, the right shoulder may be forming.
What is crucial here is not to prematurely decide that the triple top is complete before the right shoulder forms.
A peak you thought would be the right shoulder may continue to rise and update the head’s high.
Therefore, you should separate the stages of predicting the right shoulder from confirming that the right shoulder has formed.
In 1-minute scalp trading, this small difference in judgment can affect entry price and stop-loss width.
And when actually applying the triple top, remember that the height of the right shoulder does not have to match the left shoulder exactly.
Beginners might think it isn’t a triple top unless both shoulders are the same height, but in real markets the left and right shoulders and the peak widths can vary.
For instance, the right shoulder can form lower than the left shoulder.
In that case, price may not reach the left shoulder’s high either.
Thus, if the right shoulder collapses from that point, the lower-high structure may become clearer.
On the other hand, the right shoulder may form slightly higher than the left shoulder as well.
In this case, if it still hasn’t updated the head’s high and breaks the neckline, it can still be analyzed as a triple top.
In short, you don’t have to rely solely on exact shoulder height equality to judge the pattern.
What matters is that the head’s high is higher than both shoulders, and how the price breaks through the neckline after the right shoulder forms.
Additionally, you can observe not only the right shoulder height but also the time required to form the right shoulder.
For example, during the ascent from the left shoulder to the head, there might be many large bullish candles, whereas during the ascent to form the right shoulder, there could be many small bullish candles.
This may indicate a slower rate of price increase.
However, slower rising speed does not necessarily mean stronger selling pressure.
Sometimes volatility simply decreases.
Therefore, combine the time required for the ascent, the body size of candles, the occurrence of upper wicks, and the proximity to recent highs to confirm.
For example, if during the ascent to form the right shoulder there are repeated failures to make new highs and continual upper wicks around resistance lines, the ascent near the neckline may be being held back by resistance.
Furthermore, if afterward a move breaks a recent minor low, a change in short-term price structure can be inferred.
Thus, observe not only the right shoulder as a single peak but also how the candles move inside it.
Moreover, to effectively use the triple top on a 1-minute chart, it is important to correctly understand the nature of the neckline.
The neckline is not just a slanted line or a horizontal line.
The neckline is a reference line connecting places where price repeatedly found support during the triple top formation.
For example, it can be drawn by linking the price where buyers pushed back the decline from the left shoulder with the price where buyers pushed back the decline from the head.
In other words, near the neckline you can think of spaces where buyers previously prevented the price from falling as support.
Therefore, when the price from the right shoulder approaches and nears the neckline, buyers may again push it back up.
However, if the price does not stop falling and clearly breaks below the neckline, the supported structure may have broken down.
This is when the triple top is considered complete.
Nevertheless, in 1-minute scalping, treating the neckline as a single precise price line is not always appropriate.
On the 1-minute chart, slight movements can temporarily break a horizontal line and then quickly return to the original price range.
Because spreads and short-term volatility influence this, simply saying a break by a few pips does not prove a large downtrend has begun.
A helpful approach is to consider the neckline as a price zone with some width.
For example, if many past lows or horizontal lines cluster around the neckline, you can treat the area around it as a support zone.
Then check whether the price breaks below this support zone using the candle bodies, or only breaks through the lower wick and returns.
On a 1-minute chart, distinguishing between temporary breakouts via wicks and clear breakouts via bodies is crucial.
Of course, breaking the body does not guarantee further decline afterward.
However, if the neckline is breached temporarily or if the price continues to move below the neckline after a test, you can more accurately evaluate a breakout scenario.
Also, there is a unique insight about the neckline: it does not have to be perfectly horizontal.
For instance, if the low between head and right shoulder is higher than the low between left shoulder and head, the neckline will slope upward toward the right shoulder.
Conversely, if the low between head and right shoulder is lower than previous, the neckline slopes downward.
What is interesting is that the slope of the neckline changes the meaning of price structure.
An upward-sloping neckline means that even after the head’s decline, the price may rebound without breaking the previous low.
Thus, at the stage when the right shoulder forms, there remains a possibility of a rising-price structure in the lows.
Therefore, if the neckline is breached downward, one can conclude that the structure of rising lows has started to crumble.
On the other hand, a downward-sloping neckline means that by the time the price declines from the head, it has already fallen below the lows formed between the left shoulder and the head.
In other words, a downward trend in the lows may be evident even before the right shoulder completes.
And when the right shoulder forms below the head, there will begin to be a change indicating a down movement in both highs and lows.
Thus, with the same triple top, the meaning in the Dow Theory sense of its formation process differs depending on the neckline’s slope.
However, it does not follow that a downward-sloping neckline inevitably leads to a drop or that an upward-sloping neckline makes drops unlikely.
On a downward-sloping neckline, prices may have already fallen significantly before the right shoulder forms, and by the time the neckline is breached, selling may already be underway.
Therefore, it is necessary to assess how far the price can fall after the breakout.
Also, with a slanted neckline, as time passes, the basis for the breakout changes.
For example, if you draw a downward-sloping neckline, even a candles’ sideways movement can eventually produce a breakout as time passes.
In such cases, do not rely solely on a neckline break; also check whether the most recent low and any horizontal supports have been breached at the same time.
The triple top neckline can be a slanted line, but analyzing it in conjunction with important horizontal lines makes it easier to grasp changes in price structure.
Furthermore, in 1-minute scalping, pay attention to temporary price updates that occur during the triple top’s formation.
For example, after the left shoulder forms and price rises, if the price slightly breaks the left shoulder high, buyers may be entering on a breakout.
But if the price soon retreats and returns below the breakout level, those traders who bought on the breakout may be at a disadvantage.
These temporary high breaks and retracements are sometimes analyzed as liquidity grabbing or liquidity sweeps.
For example, near the left shoulder high there may be sell-stop orders and buy-stop orders placed by breakout traders, which can be triggered when the price breaches that high.
If the price breaches that high, those orders can be executed.
However, if prices do not sustain the breakout and retrace, the price may fall again.
Thus, a high formed this way can become the head of the triple top.
What matters is that when the head forms, it is not simply a higher high; you should check whether the price could sustain that high after the breakout.
For example, immediately after breaking above the left shoulder high, a strong upper wick may form and the candle may revert to the prior price range, indicating that the price failed to sustain the high.
And if the price falls toward the neckline and then rises again but still fails to update the head’s high, this provides material for considering a triple top formation.
However, it is not possible to know precisely how many orders existed near the high from just regular candlestick charts.
Therefore, do not simply assume that large institutions swept orders; focus on observable facts that the price failed to break through the high.
In particular, on 1-minute scalping, such brief high-breaks and retracements occur frequently.
Thus, whether you enter at the moment the price briefly breaks the high or wait to see if it can sustain the higher price area will significantly affect trading decisions.
Another especially practical concept in triple tops is the small double-top that can form near the right shoulder.
This is a highly practical idea.
For example, after the head declines and the price begins to rise to form the right shoulder, price inside the right shoulder may rise twice and turn down at nearly the same high level.
In other words, a small double-top forms within the larger right shoulder of the triple top.
If the neckline of this small double-top breaks below, the short-term rising structure may be broken.
Furthermore, if there is a large triple-top neckline below that, a short-term decline could lead to a breach of that larger neckline.
In such structures, you can distinguish and analyze the small double-top neckline and the large triple-top neckline as different price structures.
For example, when the small double-top inside the right shoulder completes, you can consider selling entries.
On the other hand, you can wait for the larger triple-top neckline to break below before entering.
The former offers a potential early entry, but because it occurs before the large triple top completes, the uptrend may still resume.
The latter allows confirmation of a larger price structure change, but the price may already have fallen, making risk/reward less favorable.
Here the key is that entering early does not necessarily mean the justification is strong.
Additionally, sometimes an interior rising trendline forms inside the right shoulder.
For example, after the head’s decline, price may rebound and rise toward the right shoulder, with successive higher lows.
In this case you can draw a short-term rising trendline connecting the lows inside the right shoulder.
If, after the right shoulder forms, the price falls and breaks that short-term rising trendline, the internal rising structure within the right shoulder may be breaking down.
If the minor pullback lows break as well, it provides more evidence of a short-term downward shift.
Subsequently, if the price breaks the larger triple-top neckline, it suggests a larger price structure change.
Thus, even before the large triple top completes, there can be a smaller trend reversal inside the right shoulder.
In 1-minute scalping, observing these small trend reversals within the right shoulder helps determine entry timing.
However, breaking the right shoulder’s internal trend line does not guarantee the triple top’s completion.
After a short-term correction, the price may rise again and update the head’s high.
Therefore, before entering, you should clarify whether you are aiming for a short-term retrace within the right shoulder or a large decline after the triple top completes.
This distinction also changes your stop-loss and take-profit targets.
Moreover, when analyzing triple tops, you should also consider how the price moves after a neckline breach.
For example, if price falls from the right shoulder and clearly breaks the neckline, it may rebound and return near the broken neckline.
This is commonly called a return move or a test move.
The neckline that once functioned as support may now act as resistance, and you observe whether price stops rising near the neckline and starts to decline again.
If price is stopped near the neckline by a wick and then falls again, you can consider it a potential short entry near the return move.
However, a return move does not always occur after a neckline break.
In a strong decline, price may continue to fall after breaking the neckline directly.
Conversely, price may rebound after breaking the neckline and move back above it, which would suggest that the neckline break was a false breakout.
In such cases, consider whether the return move was a false breakout and the neckline breach should be treated with caution.
When a return move occurs, it is crucial to observe how price responds near the neckline in terms of the intensity of the move.
For example, if the price breaches the neckline with a strong move and then shows a lot of candles with small bullish bodies on the way back up, the market’s momentum may be different between the decline and the rebound.
But an ascent after a return may be slower, and that alone does not guarantee a further sharp drop in price:
Still, observe whether the price stops rising near the neckline and breaks a recent low, indicating a continuation of the downside structure.
On the other hand, if many bullish candles appear near the neckline and price recovers above the neckline, you should re-evaluate the selling scenario.
In other words, with return moves, observe what happened at the specific location rather than just that price returned to the neckline.
Also, if the price does not return to the neckline after a break, there is no need to chase a sell entry just because of a perceived breakout.
If the price has already dropped significantly, the distance to the most recent high becomes wide, potentially worsening the risk-reward ratio.
In particular, on a 1-minute scale, a few pips of price difference can greatly affect trade outcomes.
Even if the triple top appears perfectly formed, if the entry price is far from the stop-loss, you should consider passing on the trade.
Next, I will introduce another interesting phenomenon that occurs after a neckline break of the triple top.
This is the price movement in the opposite direction following a neckline false break.
For example, after the triple top forms and price breaks below the neckline, many traders may expect further declines.
However, if price rebounds immediately after the break and moves back above the neckline, selling traders may be disadvantaged.
If price then breaches the right shoulder high, the downside scenario created by the triple top is more likely to be invalidated.
In such situations, buybacks from sellers can influence short-term upward movement.
Nevertheless, from chart movements alone, you cannot determine how much buyback occurred.
What matters is that price could not sustain below the neckline after breaking it.
And if price returns above the neckline and begins making higher highs and higher lows again, you can consider a price structure change toward the upside.
In other words, the triple top is not simply about selling when completed; it also allows analysis of movements when it fails after completion.
In 1-minute scalp trading, it is meaningful not only to aim for the triple top’s completion but also to study price structures that occur when the triple top fails.
However, entering a short position merely because the neckline breaks upward can be risky, since there may be important resistance lines above such as the right shoulder high or head high.
If you are considering a long entry, confirm which resistance line was breached, which lows remained, and the overall market environment on higher timeframes.
Furthermore, for improving the accuracy of triple-top analysis, it is important to consider where on the chart this pattern forms.
For example, if a clear uptrend persists and the triple top forms near the high, it can be analyzed as a pattern indicating a potential reversal of the uptrend.
On the other hand, if a temporary rally occurs in the middle of a downtrend and a triple top forms near the rally high, it can be viewed as a retracement-selling pattern aiming to continue the downtrend.
This distinction is very important.
Triple tops are generally known as a trend-reversal chart pattern, but in actual discretionary trading they can be used to align with the trend direction on higher timeframes when considering entries.
For example, suppose the 15-minute chart shows a clear downtrend.
And the 5-minute chart shows a temporary retracement within the downtrend.
At that time, a triple top forms on the 1-minute chart.
In this case, the 1-minute chart may indicate a short-term shift from rising to falling.
But from the 15-minute perspective, the retracement might simply be ending within a larger downtrend.
In other words, the 1-minute triple top suggests a short-term trend reversal, while it can also offer a back-and-forth selling candidate aligned with the 15-minute downtrend.
Conversely, if the 15-minute chart shows a strong uptrend, a triple top on the 1-minute chart may still be followed by a brief pullback that ends quickly.
Especially if a key support line on the 15-minute chart is nearby, the price may rebound near that support even after a 1-minute triple top completes.
Therefore, do not judge the triple top on the 1-minute chart alone; verify high and low structures on the 5-minute and 15-minute timeframes as well.
Furthermore, there is an interesting relationship between the 1-minute triple top and higher-timeframe candlesticks.
It is possible for a triple top formed on the 1-minute chart to appear as only a wick or a candlestick on the 5-minute chart.
For example, while the 5-minute candlestick is forming, the 1-minute chart may show the left shoulder, head, and right shoulder.
If later the neckline is broken and price declines, a long upper-wick candle may appear on the 5-minute chart.
However, a pattern that takes more than one 5-minute candle to complete does not necessarily fit into a single 5-minute bar.
What matters is that complex price moves observable on lower timeframes may be represented as simpler candlestick shapes on higher timeframes.
Understanding this helps you explain why a large upper wick appears on a higher timeframe by examining price structure on the lower timeframe.
Conversely, when price reaches a significant resistance on the higher timeframe, you can observe whether a triple top forms on the lower timeframe.
For example, if there is a resistance line on the 15-minute chart that price repeatedly tests, and a triple top forms on the 1-minute chart as price nears that resistance, you can combine the reaction at the higher timeframe resistance with changes in the lower timeframe price structure for analysis.
However, a higher-timeframe resistance line coinciding with a 1-minute triple top does not guarantee a fall.
What matters is that your reason for selling is supported by price structure across multiple timeframes, not just the shape.
Moreover, combining triple tops with moving averages is also very practical.
For instance, display 20EMA and 80EMA on the 1-minute chart.
In a clear uptrend, the 20EMA may sit above the 80EMA, with candles trading above the 20EMA.
Then, as the triple top’s left shoulder and head form, the price rises to form the right shoulder and fails to clearly break above the 20EMA.
In this case, the 20EMA that previously acted as support during the uptrend may be treated as a short-term resistance.
Furthermore, if price then declines from the right shoulder and breaks below the neckline, with the 20EMA also turning downward, short-term downward momentum may be strengthening.
However, breaking the 20EMA alone does not complete the triple top.
The relationship between moving averages is a supplementary tool to confirm price movement tendencies.
When judging triple tops, prioritize the position of the head and right shoulder, the neckline breakout, and the latest low updates.
Also, if the 80EMA sits just below, the price may pause near the 80EMA after breaking the neckline.
If so, and the distance from your intended selling price to the 80EMA is short, it may be difficult to secure an expected profit.
In other words, moving averages are not only for deciding entry direction but also for considering where price might react on a decline.
Additionally, combining triple tops with MACD divergences is another practical approach.
For example, after forming the left shoulder, price rises and the head’s high exceeds the left shoulder’s high.
Yet the MACD line’s peak may be lower than at the left shoulder.
This indicates that even though price is updating highs, MACD momentum is not as strong as before.
This state is called a bearish divergence.
However, divergence alone does not require an immediate short entry.
Price is still in the process of forming the head, and further upside may remain possible.
Thus, observe whether a right shoulder forms in subsequent price movement.
If price rises again but cannot update the head’s high and turns down, you can consider forming a triple top on the right shoulder.
If the price then breaks below the neckline, price structure has changed.
In other words, use MACD divergence to observe momentum changes and price-action to confirm price-structure changes in the triple top.
But MACD is itself calculated from past price data, so it does not provide information completely independent from price structure.
Also on the 1-minute chart, MACD small fluctuations and divergences can occur frequently.
Therefore, do not treat divergence alone as a strong selling signal; rather, verify what actual candlesticks are forming at highs and lows.
When combining triple tops with candlestick price action, also pay attention to upper wicks near the right shoulder high.
For example, if during the formation of the right shoulder a candlestick with a long upper wick appears, it shows that price rose briefly within that candle’s time frame and was pushed back down.
If the low of that candle is broken by the next candle’s low, it confirms a short-term decline is progressing.
However, just one candlestick with a long upper wick does not guarantee price will fall.
What matters is where that candle formed.
For instance, if near a higher-timeframe resistance line the right shoulder forms and an upper-wick candle appears there, it indicates that different price structures are reacting at the same price level.
Conversely, if there is no important horizontal line nearby and the same candle appears, it does not necessarily provide strong selling evidence.
In other words, you should emphasize where the candlestick appeared and the prior price movement rather than just the candlestick shape.
Additionally, when analyzing a triple top, you can compare the head’s decline with the right shoulder’s decline.
For example, after forming the head, price may fall significantly toward the neckline; then the right shoulder forms, but the rise is smaller and it declines again.
In this case, the right shoulder may fail to return to the price range of the head, unlike the head’s decline.
Moreover, if the right shoulder’s decline produces a long bearish candle and breaches the neckline, the short-term downward movement strengthens.
On the other hand, if head declines are small and price does not drop much from the right shoulder, there may not yet be a clear downward move.
In such a scenario, you may choose to wait for the neckline breach to confirm the triple top’s completion before acting.
Additionally, during the decline from the right shoulder toward the neckline, occasional small pullback highs may break in sequence, indicating a short-term downtrend on the 1-minute chart.
If the price fails to maintain the pullback highs while moving toward the neckline, a short-term downward shift is more likely.
If subsequently the price breaches the neckline and moves toward the next support, you can consider a short-entry or different selling scenario.
Thus, breaking the neckline and observing subsequent price action allow multiple entry possibilities depending on the stage of the triple top’s formation.
Next, when considering a target for the decline after a neckline breach, you can use the triple top’s height as a measure.
Typically, measure the distance from the head’s high to the neckline, and project that distance downward from the neckline breach point as a potential profit target.
For example, if the head-high to neckline distance is 10 pips, you can target 10 pips below the neckline breach as a profit target.
However, this is a general method for measuring the triple top’s range and does not guarantee the price will fall to that exact level.
In reality, there may be a strong support line nearby before that target.
For example, even if your profit target is 10 pips below, there might be a strong 15-minute support line 4 pips above that level, causing price to rebound there.
Therefore, do not rely solely on a range-based target; also check horizontal lines and higher-timeframe support lines.
In particular on 1-minute scalping, since you often seek small price moves in short time, the distance to the target and the stop-loss width are crucial.
For example, if you enter short at the neckline breach but the distance to the right shoulder high is 8 pips while the distance to the next support line is only 3 pips, your risk-reward may be unfavorable.
Thus, do not enter simply because the neckline breached; decide beforehand your stop-loss and profit target to evaluate whether the trade is worth it.
Of course, these are hypothetical price movements and not a guarantee that the same price structure will appear in actual USD/JPY trading.
Important is to consider concrete entry prices, stop-loss prices, and take-profit prices after identifying a triple top.
Additionally, on 1-minute scalping, the time between pattern formation and entry is important.
For example, after confirming the right shoulder, if price starts to fall toward the neckline, and the distance to the neckline is very short, you could enter early to sell, since there is an important support just below that level.
On the other hand, if there is ample distance from the right shoulder to the neckline, you can consider aiming for the neckline’s decline as a short-term take-profit target.
That is, you can consider trades that target the decline from the right shoulder to the neckline, not only trades aiming for the large triple-top completion.
However, this would be a pre-completion trade of the triple top.
Thus, you should separate the selling scenarios before and after the triple top completes.
Also, if you short near the right shoulder, you can take partial profits at the neckline, then, if the neckline clearly breaks lower, consider another selling scenario for continued decline.
By dividing the formation into multiple stages, you can consider different entry methods at each stage.
However, having more entries does not guarantee higher profits.
In fact, trading many times in a short period accrues costs like spreads.
Therefore, distinguish each entry method and choose stages where past testing shows genuine edge.
Also, when testing triple tops, do not only collect successful charts.
For example, seeing a clean triple top that breaks the neckline and declines may give the impression that profits are easy to gain from this pattern.
But in real markets, even when a triple top seems completed, it can rebound after the neckline break.
Also, after forming the right shoulder, prices may rise again and update the head’s high.
Therefore, you need to analyze both successful and failed cases of triple tops.
For instance, collect charts where the right shoulder forms and the head’s high is updated afterward.
Then ask: what trend did the higher timeframe show?
Was the right shoulder formed near an important resistance line?
Did the break below the neckline occur with the price already breaking lower?
Did the candlestick confirming the neckline break finish in the body or did it close near the neckline?
Did the price immediately rebound after breaking the neckline, or did it stay below it?
By comparing these conditions, you can evaluate in which market environments the triple top functioned best.
Also, recording the right shoulder height, neckline slope, and the time needed to pattern formation enables more detailed analysis.
However, over-fitting by combining too many past conditions can lead to over-optimization.
What matters is not creating convenient rules from past moves, but defining conditions that can actually be reproduced in real trading.
For example, decide a condition to determine a neckline breach.
Should it be breached by the candle’s body, or only when the 1-minute close occurs below the neckline, or when price returns after an initial breach and then breaks a recent low?
If these criteria are vague, even charts that previously looked successful may not be reproducible in real trading.
Also, you should unify your stop-loss and take-profit criteria.
In particular on 1-minute scalping, small price moves can significantly affect profits, so ambiguous trading judgments easily alter results.
And the most important thing for me to deeply understand about triple tops is to observe price structure as it forms in real time, rather than calculating backwards from a completed pattern.
If you review past charts, you can sometimes find the left shoulder, head, and neckline easily.
But in actual markets, the right shoulder’s formation is not guaranteed after the head, and the neckline break may not occur or lead to a large downtrend.
Therefore, at each stage of the triple top, you must separate what is currently observable and what remains uncertain.
For example, during the head formation, there is evidence of a price high being updated.
During the right shoulder formation, there is evidence that the head’s high could not be updated.
During the neckline breach stage, there is evidence that the prior low has been breached.
And after the neckline has been breached, the return move can show whether the prior support line becomes resistance again.
Thus, by organizing price structure changes stage by stage, you can think about current market conditions and not assume future price moves that have not yet occurred.
Furthermore, when using triple tops, clearly define the conditions under which a selling scenario would be invalidated.
For example, if you base selling on the right shoulder’s formation and the right shoulder’s high breaks clearly above, you would revise that short-term selling scenario.
Similarly, if you sell based on a neckline breach and price returns above the neckline and then starts making higher highs and higher lows, you should revise the downward continuation scenario.
By predefining such invalidation conditions, you can organize your judgments even when price moves differently than expected.
Additionally, in actual trading, even if you place a stop-loss order, rapid price moves or slippage may prevent you from exiting at your planned price.
Therefore, consider not only the chart’s stop-loss width but also your actual trading environment.
Finally, there is a very important concept to remember about triple tops.
It is that the triple top itself does not cause the price to fall.
The triple top is a chart pattern formed by actual price movements.
During its formation, many moves occur, including success and failure of highs, maintenance and breach of lows, and responses at support and resistance lines.
In other words, what is truly important in analyzing triple tops is not simply the ability to find three peaks.
Why could the head’s high not be updated?
Why did the right shoulder stop rising?
Why did price stop at the neckline instead of dropping?
Why did price rebound back to the prior price range after breaking below the neckline?
Analyzing these changes in price moves using candlesticks, horizontal lines, trendlines, Dow Theory, moving averages, and multiple time-frame analysis is important.
Especially in 1-minute scalping, repeating buy/sell decisions within small price moves can cause you to miss entries or fall for traps if you chase pattern completion alone.
Therefore, understanding the higher-timeframe market environment, observing how a triple top forms on the 1-minute chart, and entering only when price structure truly changes are helpful approaches.
The important thing is not simply to sell because you found a triple top, but to understand what changes occurred due to its formation.
A market that was rising highs may fail to update highs; a market that was maintaining lows may breach lows; a neckline acting as support may be breached; and a breached neckline may then turn into resistance during a retracement.
Understanding this sequence from the perspectives of Dow Theory and price action allows you to use triple tops not as a memorized pattern, but as practical analysis for recognizing market conditions.
The essence of a triple top lies not in the three peaks themselves but in how the price structure changes while the uptrend was in place.
And you must judge whether that change will truly develop into a downtrend or end in a temporary pullback or a false breakout, based on actual price movements.
By combining the right shoulder, neckline, return moves, false breaks, and higher-timeframe trend structure, you can organize your entry rationale and decide when to refrain from trading in 1-minute scalping more precisely.
Mastering the triple top does not mean seeking only a perfect, beautiful triple-top shape.
From before the formation to after completion, you should understand how the market’s price structure changes and build trading scenarios accordingly.
【FX】1-minute scalping ironclad trade technique essence
