

Why does GOLD's support-buying collapse there? Four perspectives comparing the “pre-recovery rise”
Overseas Method Research | As of October 13, 2026
I confirmed the rise. I didn’t jump in; I waited for a pullback. Yet, after buying, it fell just as is. In such a scene, aren’t you just changing the retracement amount by saying “I should have waited deeper”?
What we will look at this time is the ascent before the pullback arrives. Even if the same 20-point move goes up, the facts you can confirm differ between a wave that moved in one direction with a real body, and a wave that reached here after repeatedly moving up and down.
The same half-price pullback. Which would you observe?
The A and B below are schematic diagrams for description, where both rise from a hypothetical price of 100 to 120 and pull back to 110. They are not actual GOLD price or trading results, and do not depict past price movements.
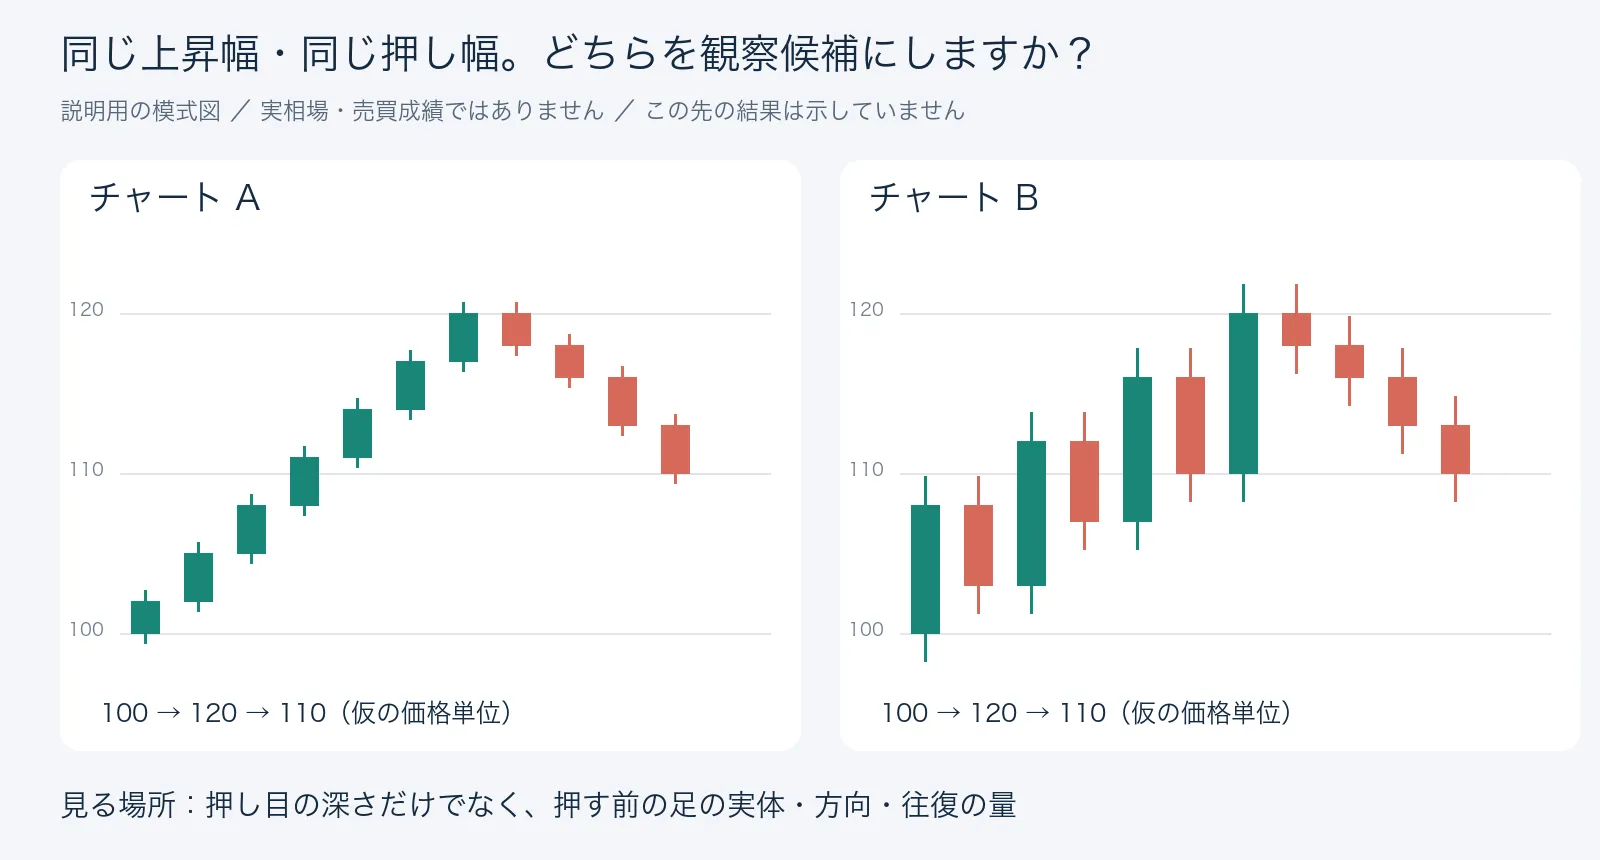
A progresses with a real body, while B is pushed back several times along the way. Up to here, this can be read from the diagram. Then, after choosing A,“Only reached 110,” “upward-confirmation bar confirmed,” “fell below 100 before confirmation”are the three scenarios that you may leave as the same buying candidate. Separate the way you select the waves from the subsequent judgments.
On October 6, 2026, MQL5 published “Swing Extremes and Pullbacks (Part 5): Filtering Weak Swings Using Candle Imbalance.” This is a study example that evaluates the previous wave with four elements. This article introduces that approach and uses a unique schematic example to organize the reading method.
The continuation of this article is available with free viewing registration.
It includes the answers to the three scenarios of “waiting, checking conditions, excluding candidates,” a four-item comparison table, and a filled-in judgment memo. When you next view your own chart,you can state in one sentence what is missing and why you wait.
Please apply for viewing from the below “Read more.”