
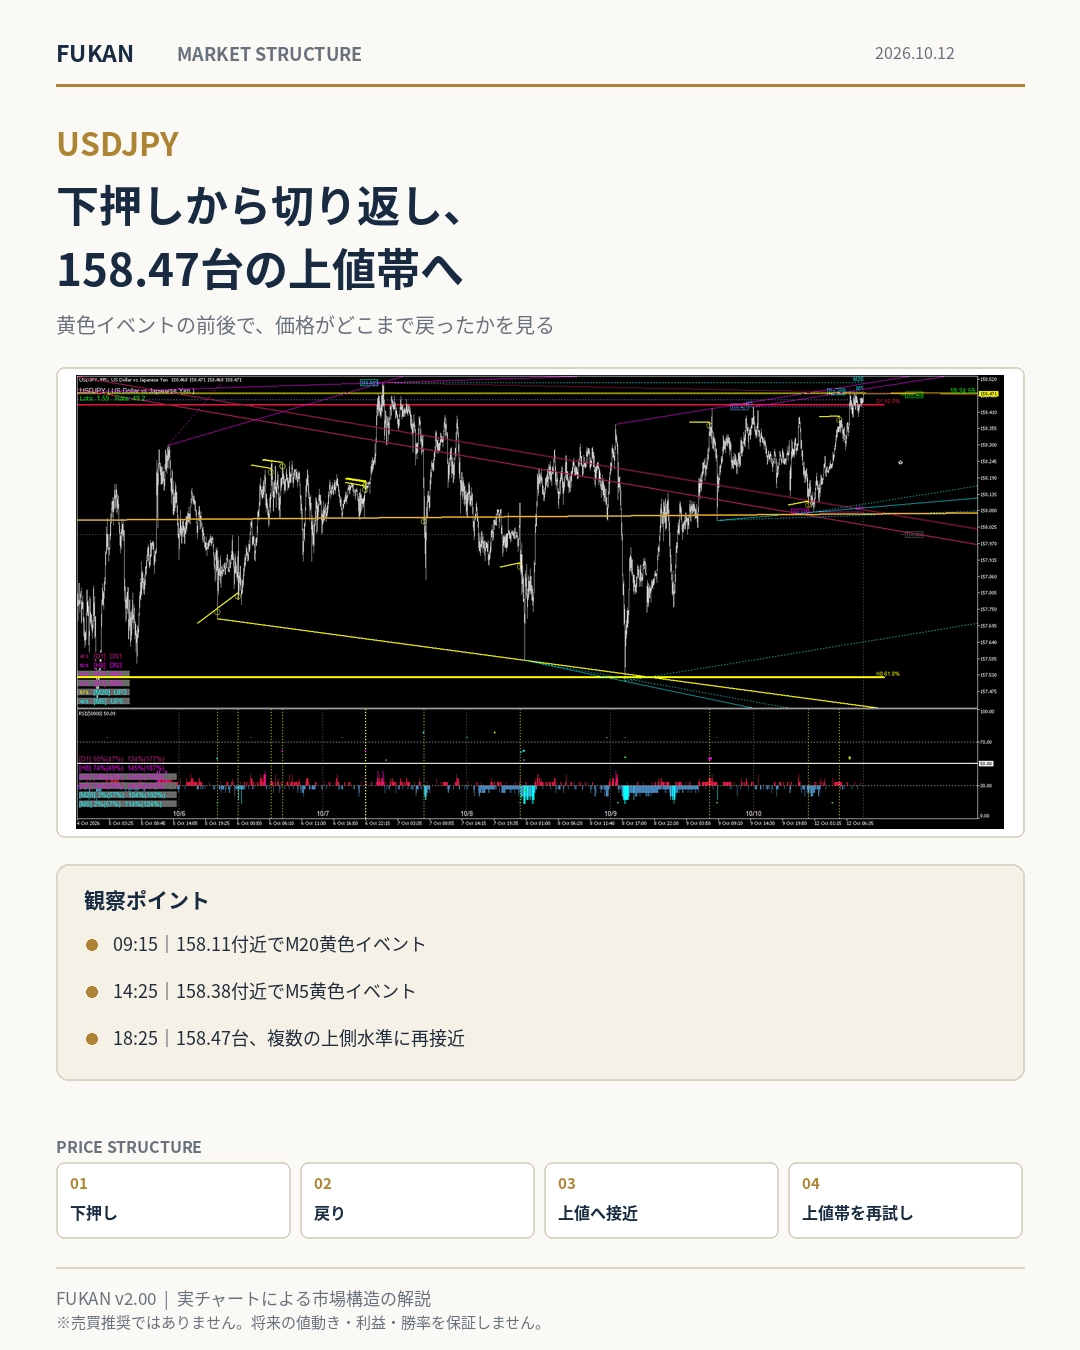
USDJPY, rebounded from around 158.08 — approached again the upside range around the 158.47 area
USDJPY, Rebounding from around 158.08 — Moving closer again to the upper band around 158.47
On October 12, USDJPY dipped to around 158.08 in the morning, then recovered toward the afternoon, and by 18:25 in the saved image it had risen to the 158.47 range.
This time, the focus is not only on whether it went up or down. After approaching the lower level, which line did it cross, and which upper band did it approach again? We compare FUKAN's live chart, including around the yellow event, before and after.
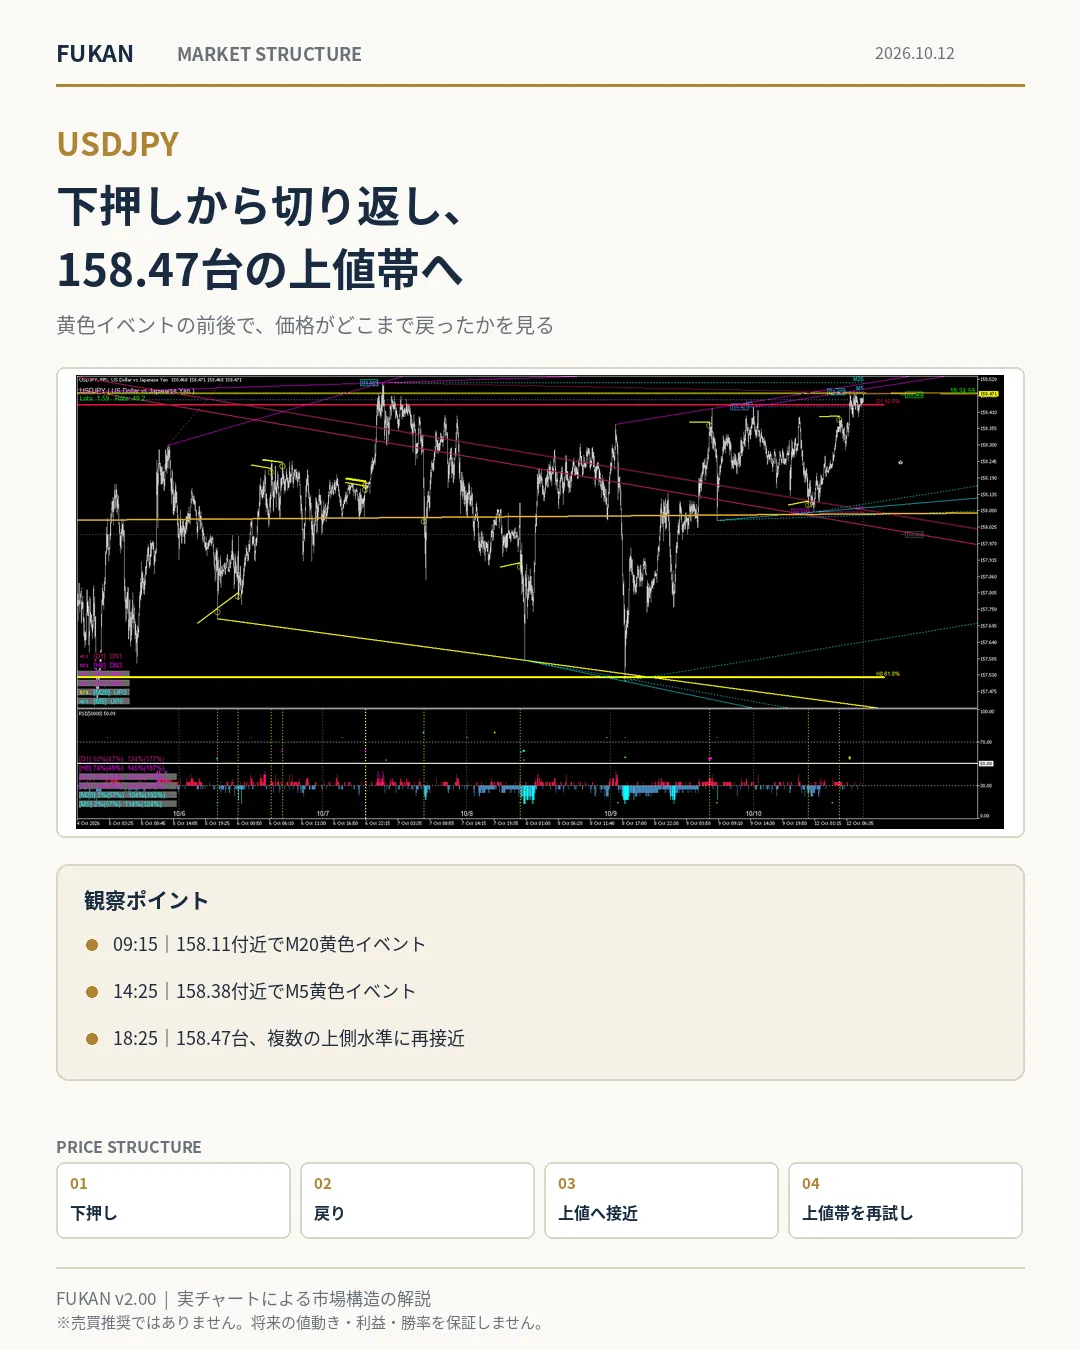
09:15 | Dipped toward around 158.08 — M20 Yellow Event
The saved image at 09:15 shows a display price of about 158.117 yen. After testing the upper around 158.42, it was pushed back, and approached the vicinity of the horizontal line and diagonal line near 158.08.
In the FUKAN_CAPTURE index, this image is taken at the moment the M20 yellow event occurred (YELLOW_EVENT_NOW). However, the yellow event itself cannot be treated as a buy/sell signal or as a guarantee of subsequent rise.
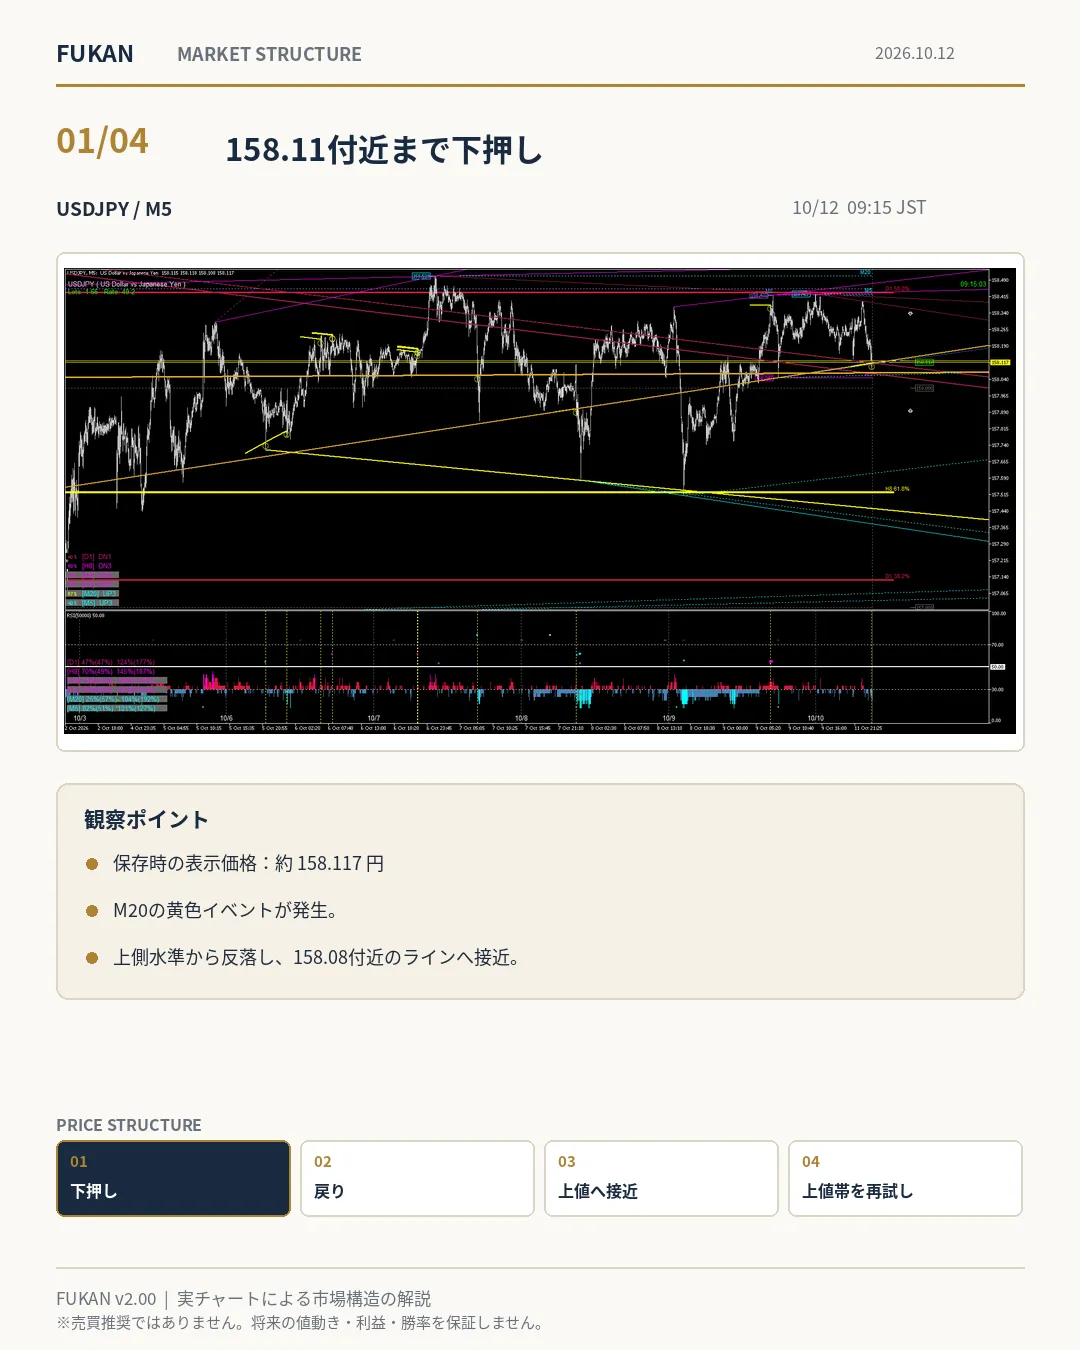
12:00 | Return to around 158.25 — Rebound after a dip
In the noon saved image, the display price is about 158.257 yen. After the morning dip, it recovered and was heading toward the upper level again.
What can be confirmed here is the fact that it “rebounded.” Whether it broke through the upper resistance band remains another matter.
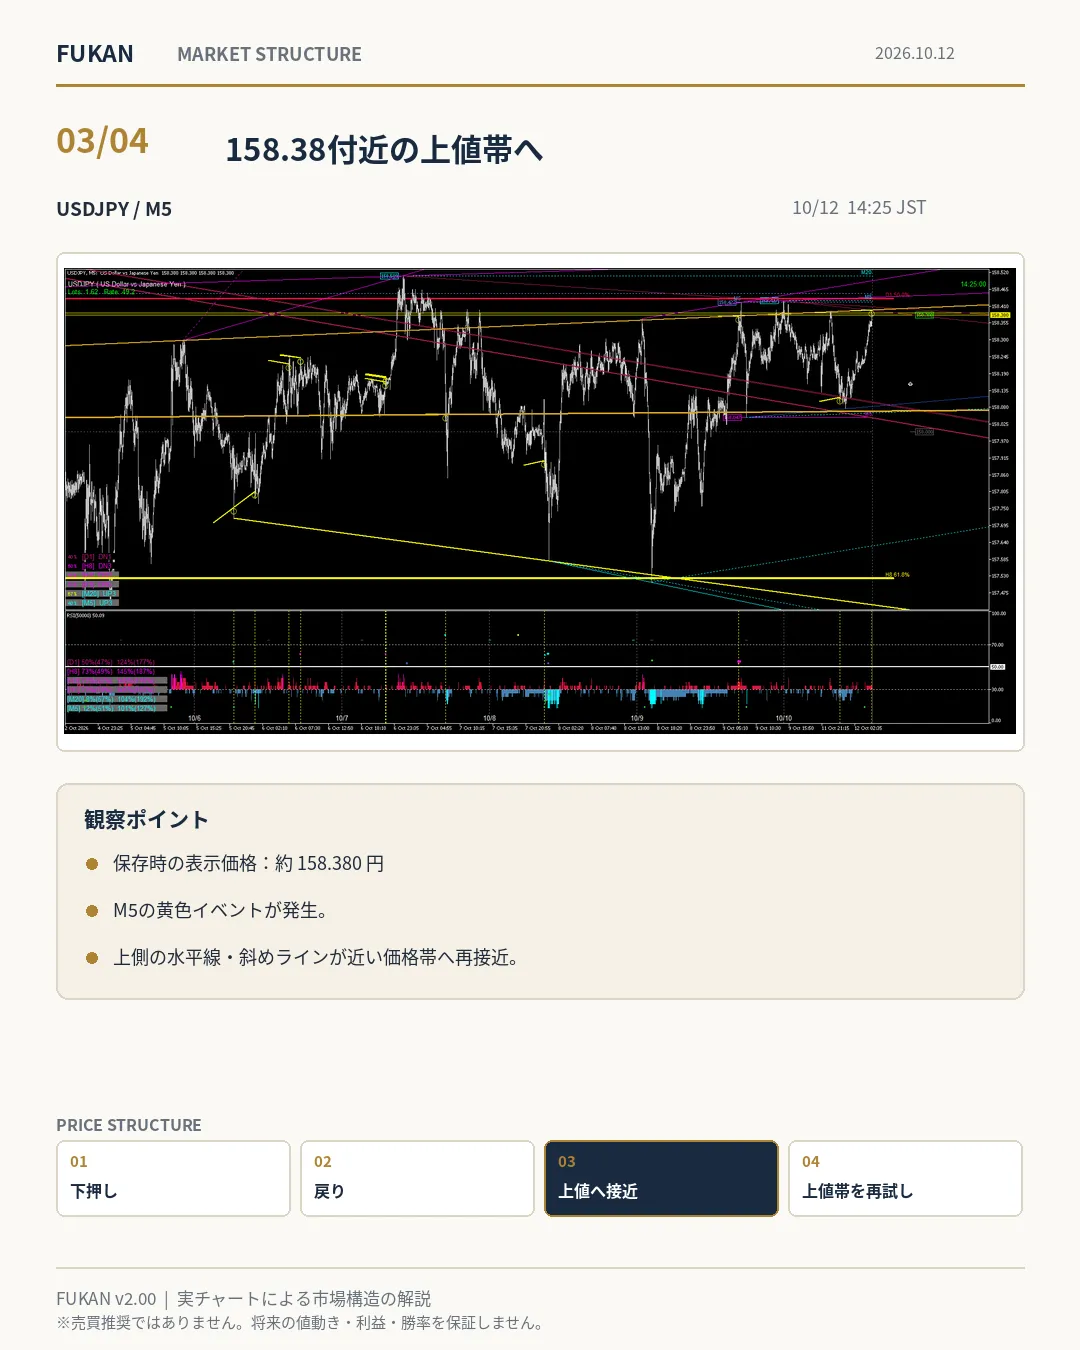
14:25 | Around 158.38 — Now an M5 Yellow Event
The saved image at 14:25 shows about 158.380 yen. The upper horizontal line and diagonal line are approaching again in the vicinity.
This image is the M5 yellow event capture (YELLOW_EVENT_NOW). It is distinguished from the 09:15 M20 event in the index. If the time axis differs, the yellow display on the same screen does not necessarily carry the same background reading.
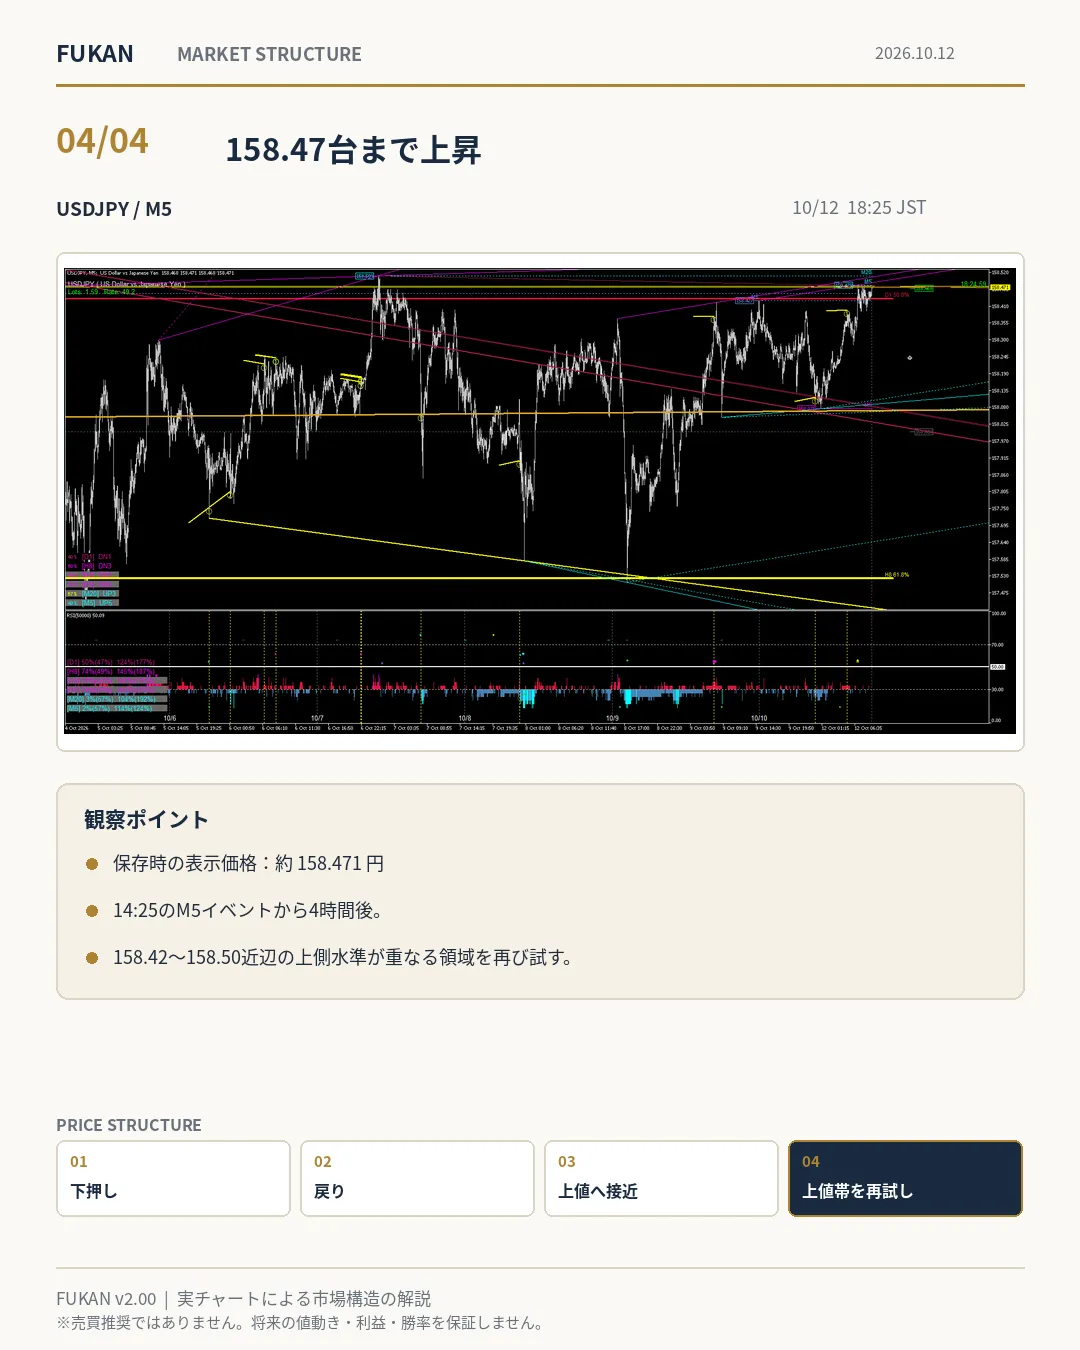
18:25 | Around 158.47 — Where the upper level overlaps
In the 18:25 image, the display price is about 158.471 yen. Around 158.42–158.50, multiple upper lines overlap, and the price rose again toward that vicinity.
However, this image is a 4-hour-late follow-up shot from the 14:25 M5 yellow event (YELLOW_EVENT_4H). It does not indicate that a new yellow event occurred at 18:25.
The market-structure point here is that the price, which rebounded from the lower level, returned to a position where it could test the upper resistance band. Whether the breakout was sustained cannot be determined from this saved image alone.
What FUKAN Reveals — Do Not Confuse “immediate” with “subsequent” yellow events
FUKAN displays multiple-timeframe lines and events on a single chart. This time, we compared the 09:15 M20 event, the 14:25 M5 event, and the image 4 hours later at 18:25.
By separately viewing the moment an event occurred and where the price moved afterward, we can confirm the relationship to support and resistance levels without turning the yellow display into a hindsight “hit.”
You cannot conclude an edge or win rate from a single event. It is necessary to verify not only the examples where it reacted but also those where it did not react or moved in the opposite direction.
Summary
On October 12, USDJPY moved from around 158.117 yen at 09:15, to around 158.257 yen by 12:00, to around 158.380 yen by 14:25, and to around 158.471 yen by 18:25, changing its upper position at each save point.
It was a day where the rebound from a dip toward the upper band could be confirmed by comparing different-timeframe yellow events and the subsequent price positions.
Note: Times are based on local_time (Japan time) in FUKAN_CAPTURE_INDEX.csv. Prices are the broker’s reference values shown on each saved image.
Note: Yellow events do not guarantee trading success or profitability. This is an explanation of market structure, not investment advice or trading recommendations. It does not guarantee future price movements, profits, or win rates.
For information on FUKAN features and the 7-day Trial, please refer to GoGoJungle’s FUKAN product page.