
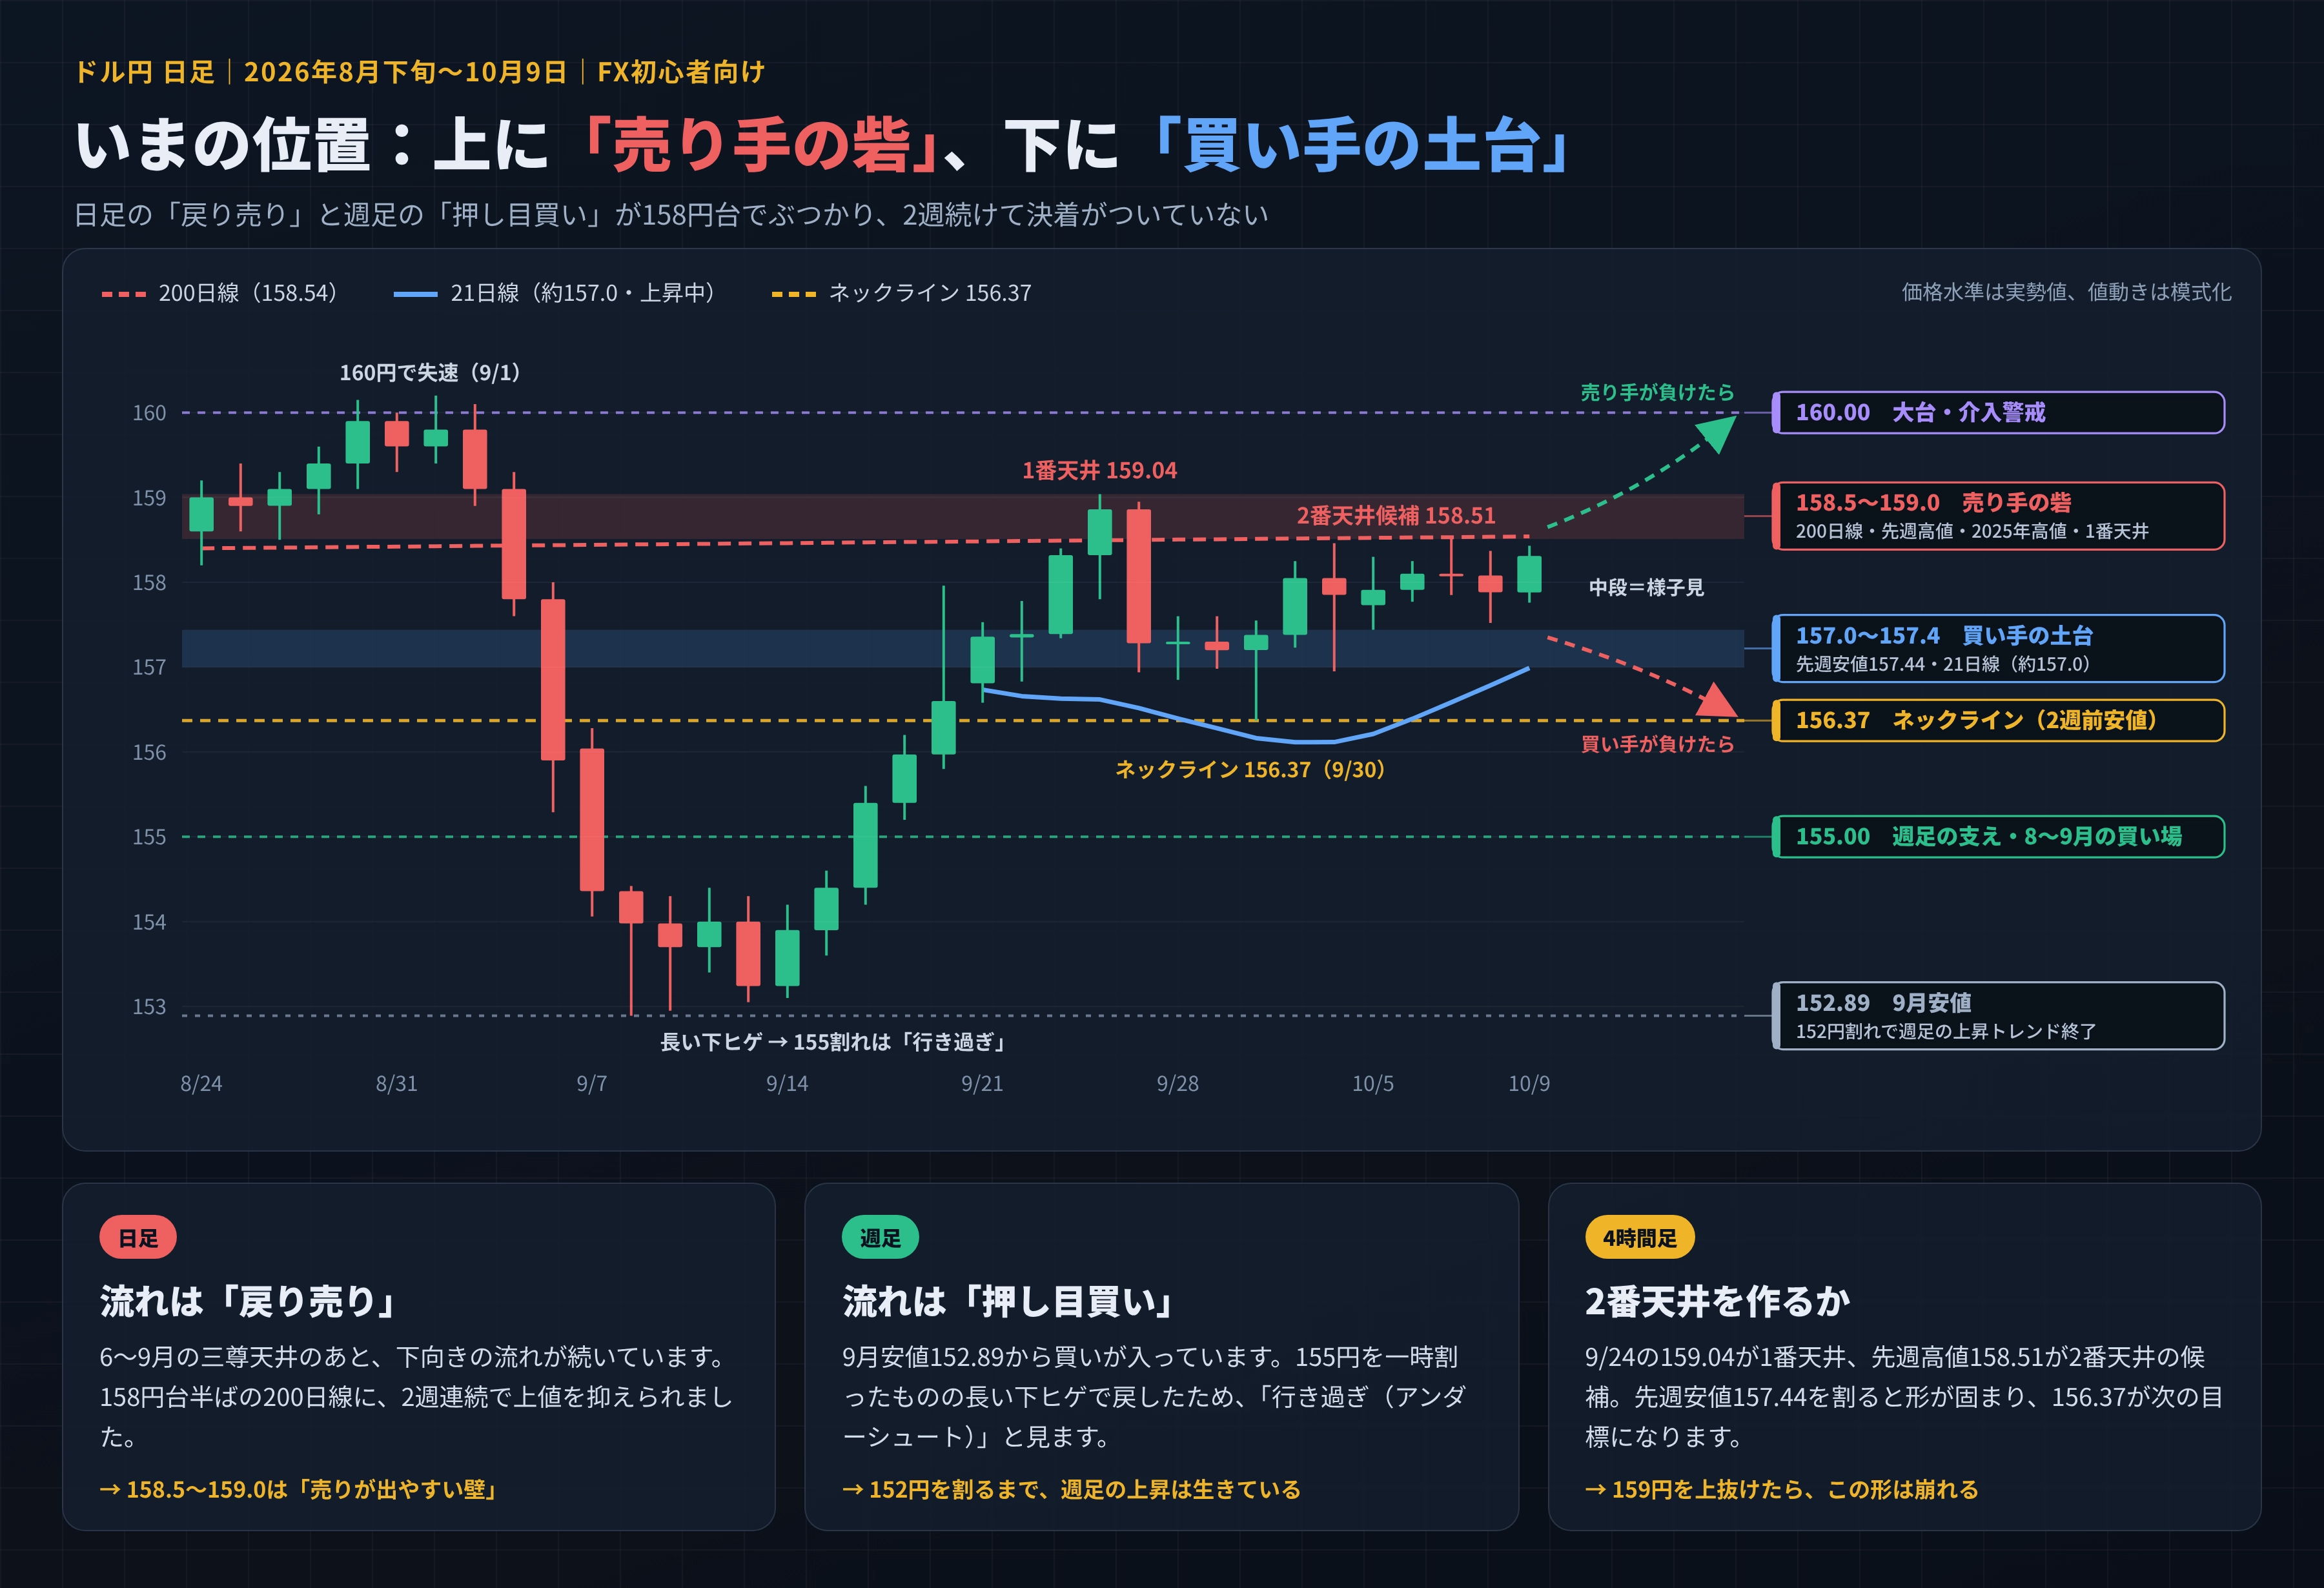
"Sell orders that protect the 200-day line" VS "Buyers supported by the 21-day line".
The daily chart shows a “reversal sell” after the triple top, and the weekly chart shows a “pullback buying” from September’s low.
These two flows collide around the 158 yen level, and have not settled for two weeks in a row.
This week is a watch week to see which side breaks first: the upper wall (158.5–159.0) or the lower base (157.0–157.4).
What happened last week (10/5–10/9)
────────────────────────────────────────
Date Open High Low Close Events
10/5 (Mon) 157.73 158.30 157.44 157.91 Euro plunges on French fiscal concerns. USD/JPY falls to 157.44 and rebounds
10/6 (Tue) 157.91 158.25 157.77 158.10 Ueda's remarks push back expectations for October rate hike, prompting yen selling
10/7 (Wed) 158.10 158.51 157.85 158.08 Weekly high 158.51. Upper resistance near the 200-day moving average
10/8 (Thu) 158.08 158.37 157.52 157.88 Yields fall in the US, yen moves toward mid-157s
10/9 (Fri) 157.88 158.43 157.76 158.31 Prime Minister Kishida: “Watch FX and prices” but yen continues to weaken
Week high 158.51, low 157.44, close 158.31.
Volatility is about 1.1 yen, and the mid- to upper-158s remain capped by the 200-day average, so the week stayed range-bound.
for a week.
Timeframe-wise outlook
────────────────────────────────────────
【Weekly】the trend is “buying on dips”
・Buying has been entering from the September low of 152.89
・In September, briefly fell below 155 but recovered with a long lower wick
→ Not a true break, but an overextension (undershoot)
・In August–September, around 155 has been supported for two months
・Upward weekly trend remains until it breaks below 152
【Daily】the trend is “selling on rallies”
・After the triple top from June–September, the downtrend continued
・Upper resistance around the mid-158s, held for two weeks at the 200-day line
・Near the 2025 high around 158.87 is a place where selling tends to emerge
・Support from below comes from the 21-day moving average (about 157.0) rising
【4-hour】whether a second top forms
・Sept 24 high of 159.04 is the “first top”
・Last week’s high 158.51 is a candidate for the “second top”
・If the last week’s low 157.44 is broken, the pattern tightens,
the prior week’s low 156.37 (neckline) becomes the next target
・Conversely, a breakout above 159 would invalidate this pattern
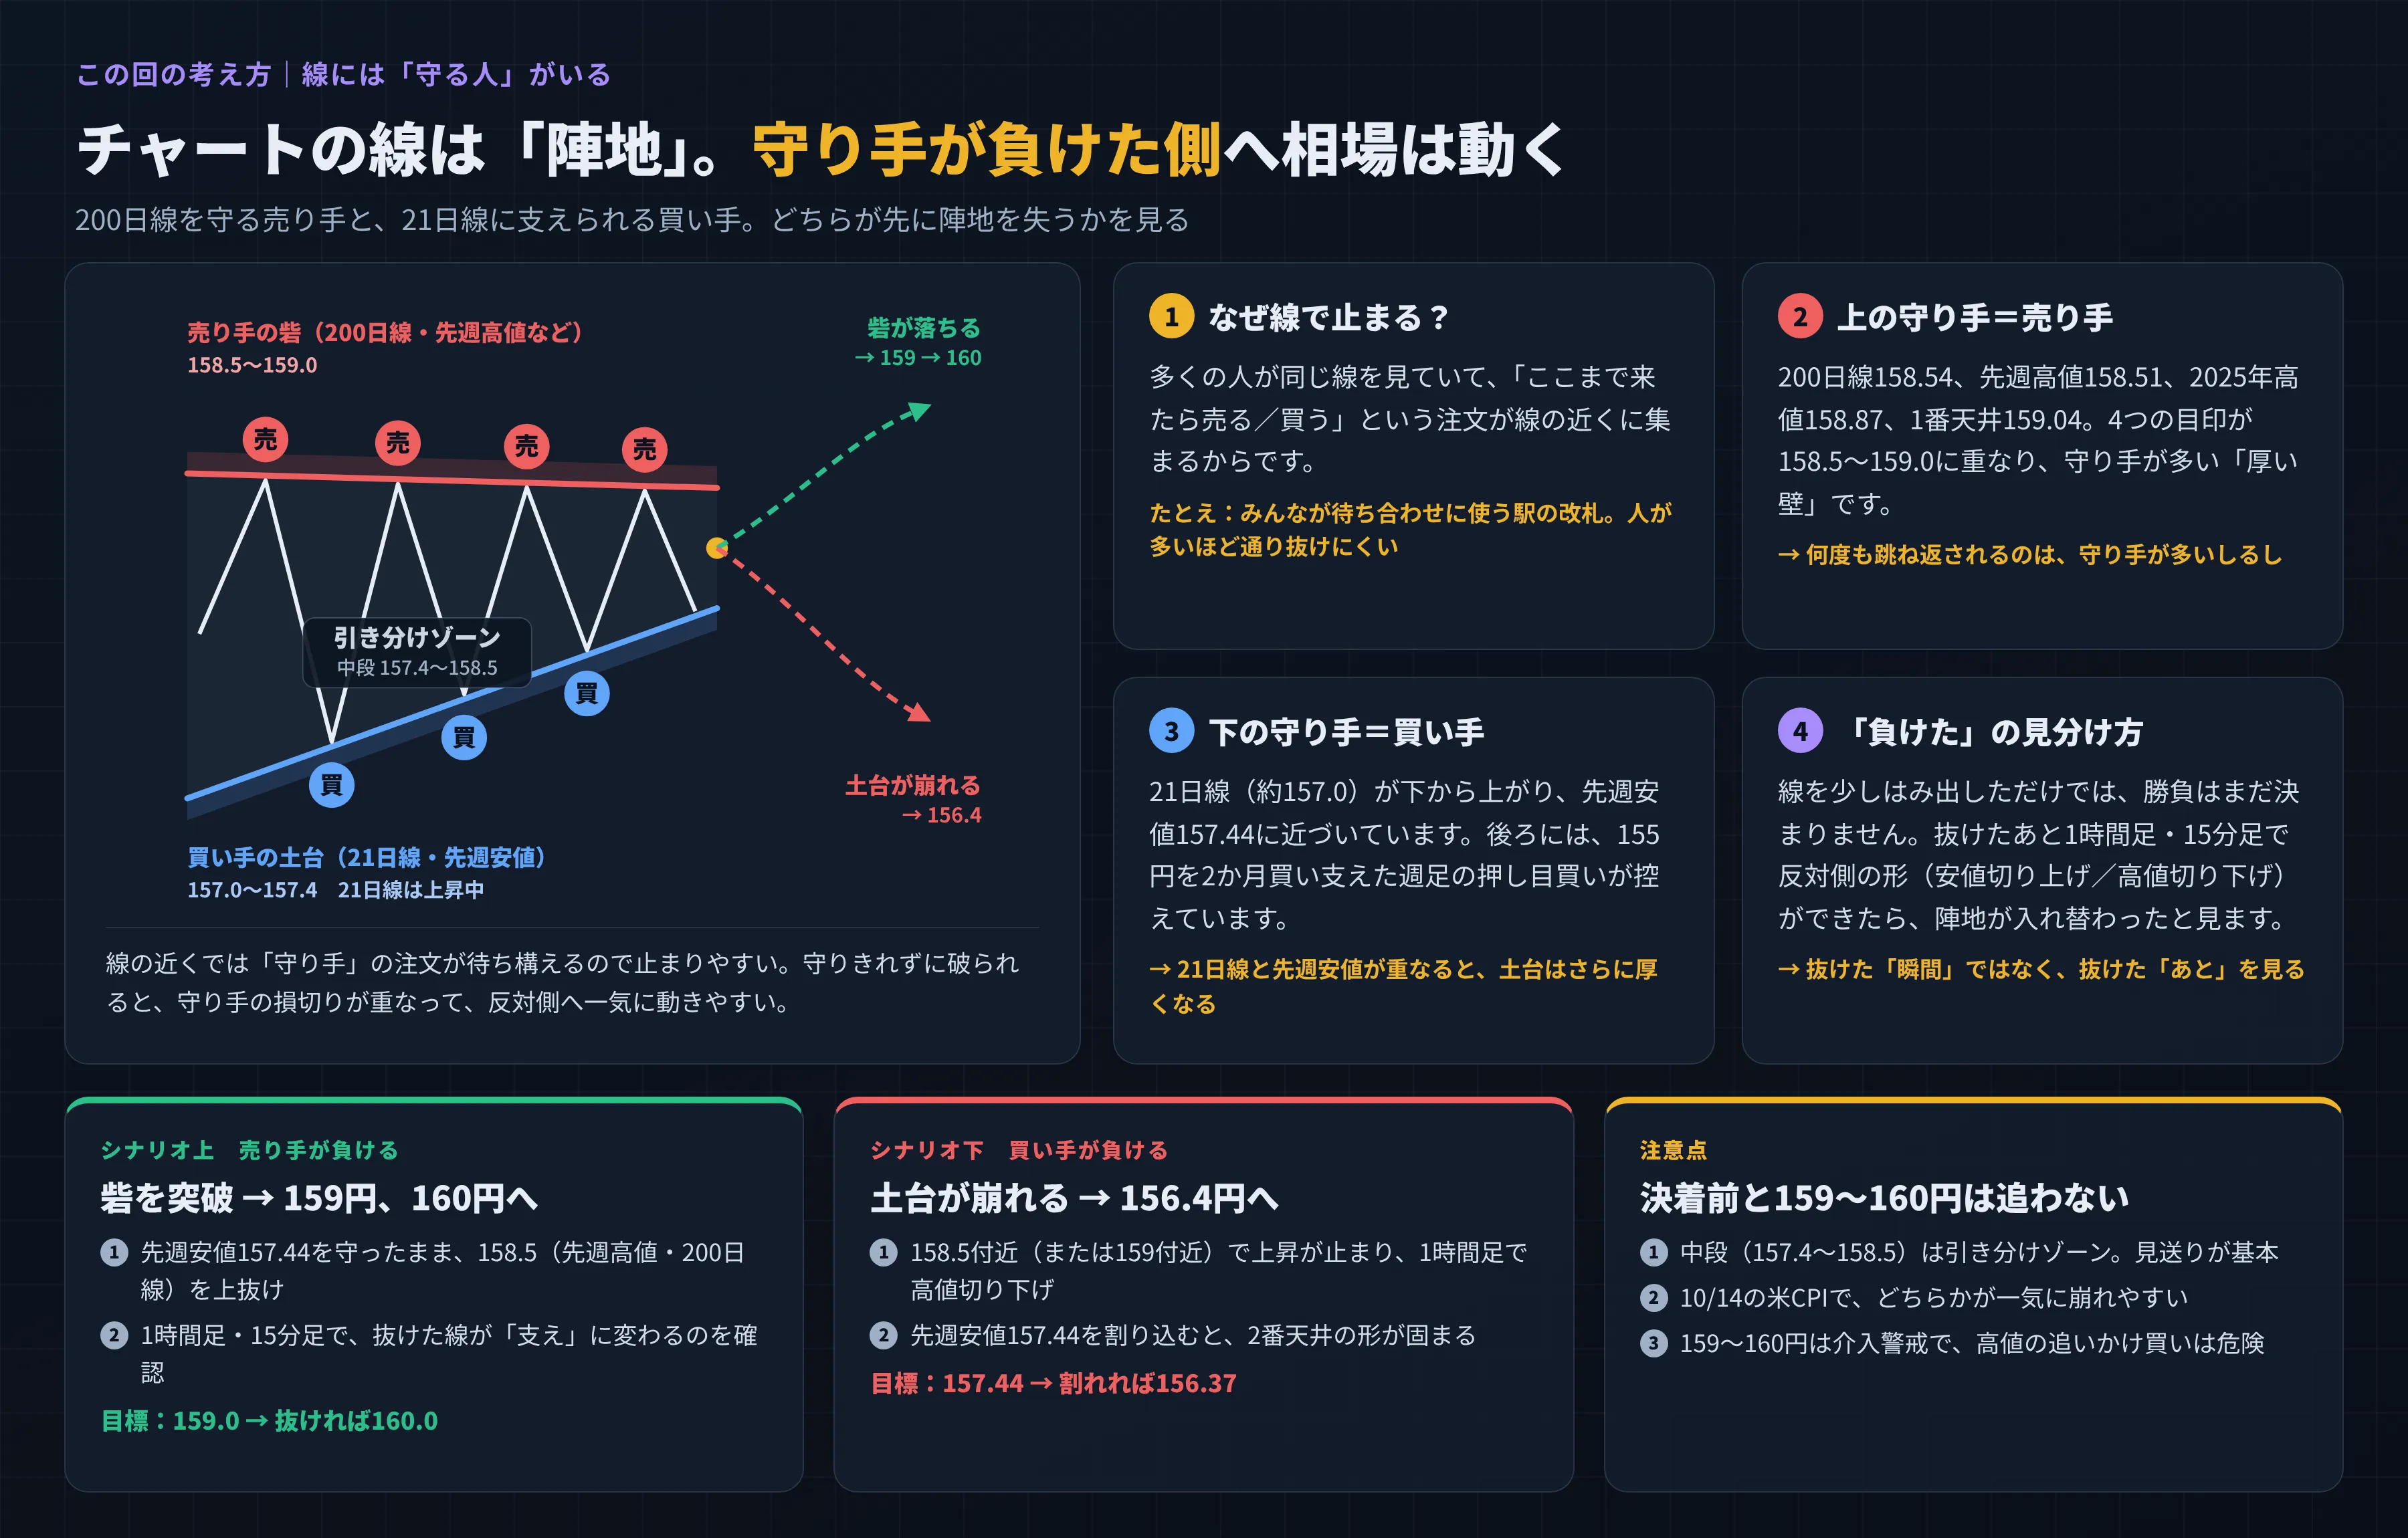
There are people who protect the lines
────────────────────────────────────────
Chart lines (moving averages, prior highs and lows) are the “territory” of sellers and buyers.
Sellers’ stronghold: 158.5–159.0 (200-day line, last week high, 2025 high, first top)
━━━━━━━━━━━━━━━━━━━━━━━━━━
\/\/\/\/ ← Drawn-out stalemate zone (157.4–158.5)
━━━━━━━━━━━━━━━━━━━━━━━━━━
Buyers’ base: 157.0–157.4 (21-day line, last week low)
If the fortress falls → 159 → 160
If the base collapses → 157.44 → 156.37
① Why do prices stop at the line
Many people watch the same line, so orders like “sell at this level” or “buy here” cluster near the line.
Example: station gates where many people gather; the denser the crowd, the harder to pass through.
② Above’s protector = sellers
158.54 on the 200-day line, last week’s high 158.51, 2025 high 158.87, and first top 159.04 align as four markers, forming a thick wall guarded by many sellers.
Repeated rejections signal strong defense.
③ Below’s protector = buyers
The 21-day line (about 157.0) is rising from below and approaching last week’s low 157.44.
Behind it are the two-month of weekly pullback buying around 155()
When the 21-day line meets the last week’s low, the base becomes even thicker.
④ How to tell it’s a “loss”
A slight breach of the line does not conclude the matter.
If there is a counter-move on the hourly and 15-minute charts after the break,
forming a opposite-side shape (lower high if rising, higher low if falling),
then only is it judged that the “territory has switched.”
Look at the moment after the break, not the instant of the break.
Why do protectors move greatly when they lose?
Because those who defended often have stop orders beyond the line (to confirm the loss).
When the line breaks, those stops trigger one after another,
causing price to move rapidly to the opposite side.
This week’s scenarios
────────────────────────────────────────
【Upper】the sellers lose (the fortress is breached)
1. Hold last week’s low 157.44 and break above 158.5 (last week’s high and the 200-day line)
2. Confirm on the hourly/15-minute charts that the breached line becomes support
Target: 159.0 → if breached, 160.0
【Lower】the buyers lose (the base collapses)
1. At around 158.5 or near 159, rising halts and higher-timeframe high gives way to lower highs on hourly
2. If last week’s low 157.44 is broken, the second-top pattern solidifies
Target: 157.44 → if breached, 156.37
【Another pattern】one test lower then sharp rebound
If price falls near last week’s low and reverses on the 15-minute chart,
there is a possibility of buyers aiming for a return to last week’s high.
【Notes】
・Mid-range (157.4–158.5) is a draw zone; generally defer
・On 10/14 (Wed) 21:30, US CPI could cause either side to break rapidly
・159–160 is a high-risk zone for interventions; chasing highs is dangerous
Price level list
────────────────────────────────────────
160.00 Big level; weekly resistance above; intervention alert
159.52 100-day line
159.04 First top (9/24 high)
158.87 2025 high (January 2025)
158.54 200-day line
158.51 Last week's high (10/7) = candidate for second top
158.31 Last week's close (10/9)
157.44 Last week's low (10/5) = this week's turning point
157.0 vicinity 21-day line (rising)
156.63 25-day line
156.37 Two weeks ago low (9/30) = neck line
155.00 Weekly support; buying area in Aug–Sep
152.89 September low
152.00 Weekly uptrend defense line
Supplement
────────────────────────────────────────
・This week’s major schedule (Japan time)
10/12 (Mon) Tokyo market closed (Sports Day), US bond market closed
10/14 (Wed) 21:30 US September CPI
10/15 (Thu) 21:30 US retail sales and PPI, G20 finance ministers and central bank chiefs meeting
10/16 (Fri) Ueda’s remarks (read by Deputy Governor Uchida),
Warsch FRB Chair and IMF's Georgieva discuss
10/17 (Sat) FRB to refrain from speeches (blackout period) begins
This week’s expected range: 156.50–159.50 yen.
・The 21-day line value is an approximate figure calculated from daily closes (publicly released 25-day line is 156.63).
・Terminology
200-day line: average of closing prices over the past 200 days. A common gauge for long-term trend
21-day line: average of closing prices over the past 21 days. A gauge for about a month’s trend
Triple top: three peaks with the middle the highest
Second top: a top pattern where two peaks are at roughly equal heights (double top)
Neck line: the line at the “neck” of the top pattern. If broken, the pattern completes
Undershoot: a momentary move beyond; if it quickly reverts, it isn’t a true break
■ Notes
────────────────────────────────────────
This material is an educational explanation for learning market perspectives.
It does not constitute trading recommendations.
Price levels are verified against public data, but chart movements depicted are stylized. Actual trading should be done at your own judgment and responsibility.