

When EA starts to lose, whether to stop or continue. Reasons that are hard to distinguish from a few months of results, the five patterns of how it collapses, and how to draw the stopping line
I am the director of the Holy Grail Research Institute. I am a 50-year-old systems engineer, keeping a record of verifying automated trading methods that look like they "could win" against past data and dismantling them.
In Paid Article ①, I wrote, "Doubt the discrepancy with real trading." Today, I will categorize where that discrepancy comes from and describe it by your pattern of breakdown.
Paid Article ① "20 items to check before buying an EA, and combinations of dangerous answers":https://www.gogojungle.co.jp/finance/navi/articles/127413
Product pages for EAs (programs that automatically execute FX trades) include test results based on past data. These results can collapse once you buy and run them live.
All numbers in this article are just calculation examples for explanation.They are not my own verification results or performance.
What is contained in the paid portion and what you can do after reading it is listed at the very end of the free portion.
Conclusion
Past data performance is the performance when you operate under fixed conditions for a fixed period. In live trading, conditions and periods differ, so it can break down.
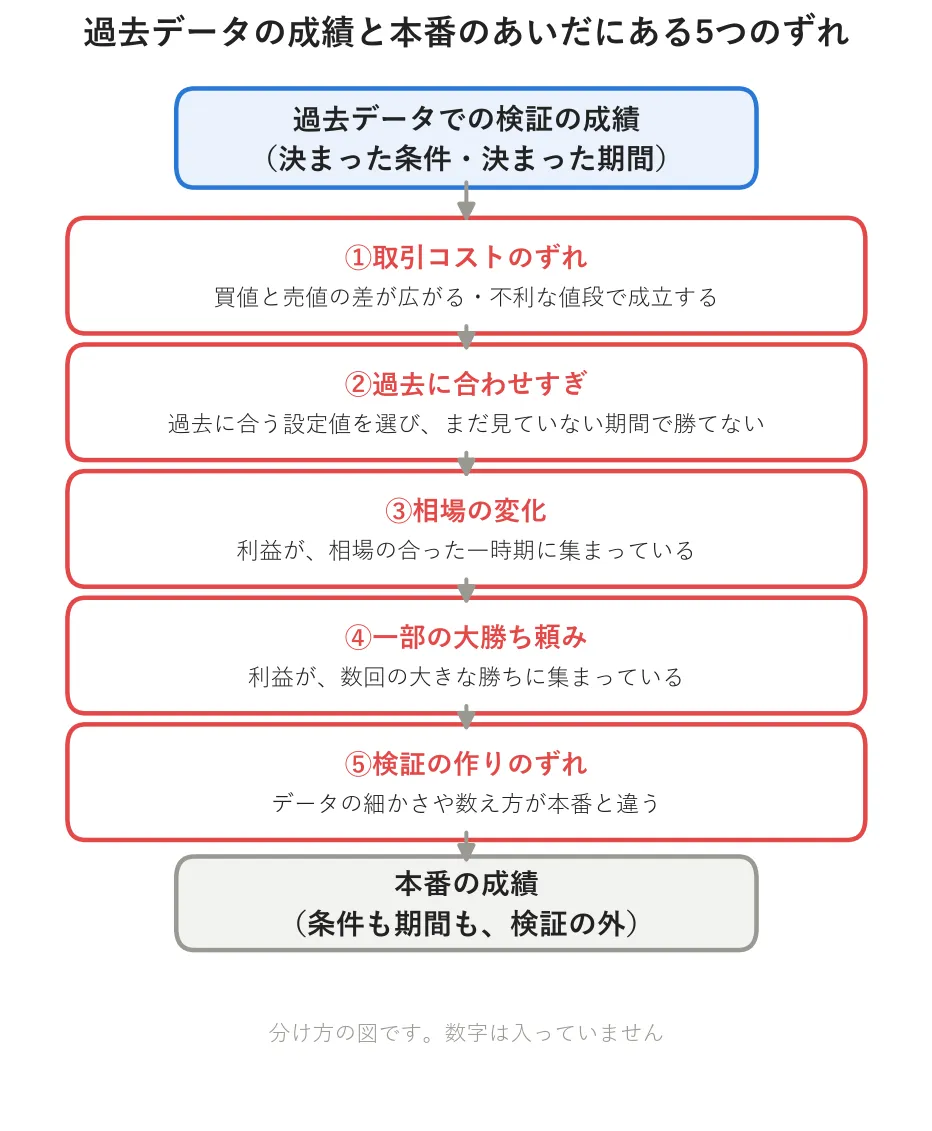
Discrepancies can be divided into five major patterns.
- Discrepancy in trading costs:In live trading, the spread between bid and ask can widen, or orders can be filled at unfavorable prices.
- Overfitting to the past:Settings were chosen to fit historical data, so they may not win in periods not yet observed.
- Market regime change:Profits are concentrated in a period when market characteristics matched.
- Reliance on a few big wins:Profit is concentrated in a few large winning trades.
- Discrepancy in the construction of the test:The granularity or counting method of the data used for testing differs from live conditions.
To identify, use two ways of thinking.
- Set the criteria in advance:Before opening the product page, write the line indicating, "I will doubt a breakdown if this figure is reached."
- Doubt the discrepancy with live conditions:When you look at the performance, first determine which of the five patterns is likely to break down.
The greatest danger isthat, even if it is breaking down, you cannot tell in the first few months of live trading. Calculation examples are written below.
How to verify Pattern III: Exclude the best year
Among the five patterns, I will show one that can be checked immediately from the numbers on the product page. It is Pattern III, the market change.
This is a calculation example. Suppose an EA product page states a profit of 500,000 yen over five years and 500 trades. The amount is after deducting trading costs (the bid-ask spread and fees).
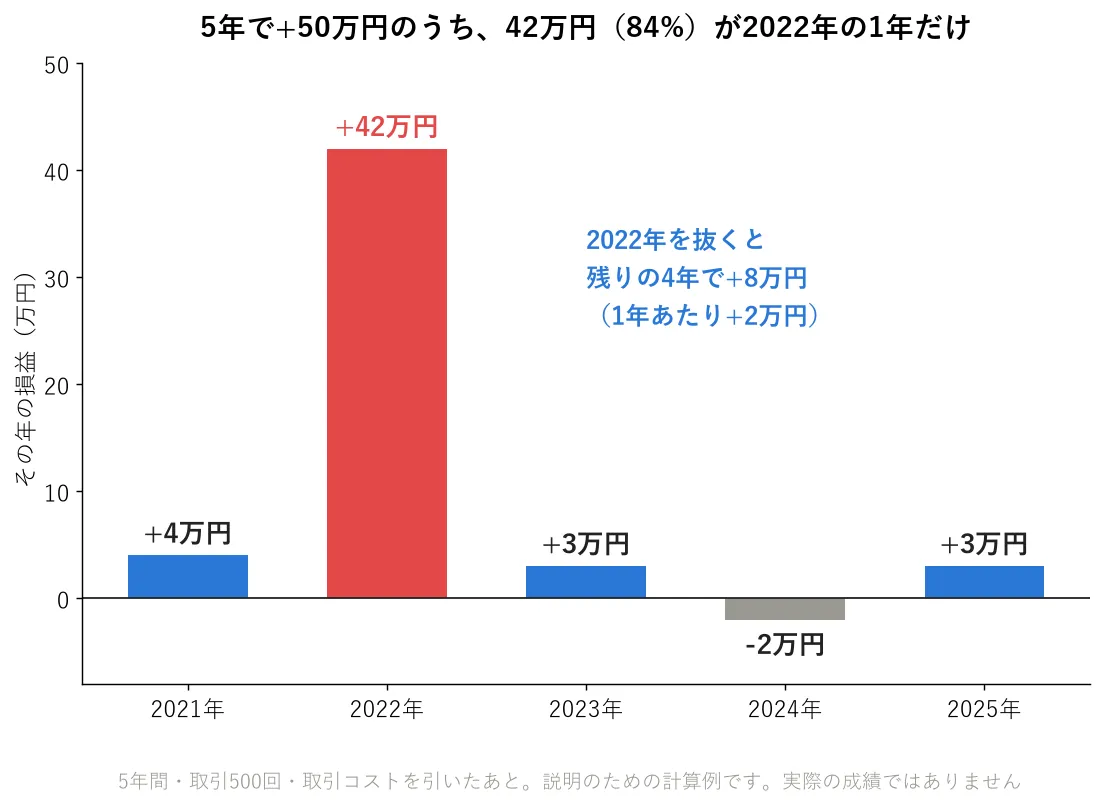
Condition: five years (2021–2025), 500 trades (about 100 per year), and trade size constant each time. This is just an explanation calculation.
If it is 500,000 yen over five years, it might look like 100,000 yen per year. But by year, 2022 alone shows 420,000 yen. 84% of the total concentrates in a single year.
If you exclude 2022, the remaining four years yield 80,000 yen. About 20,000 yen per year. The method suggested by the product page's "five years, 500,000" looks like a different method when viewed year by year.
In the actual market, 2022 was a year where the USD/JPY rose sharply in one direction until October. If the EA in this calculation is designed to win big in one-directional markets, live results lacking such a year may lean toward about 20,000 yen per year.
There are two ways to verify.
- Search for yearly (or monthly) P&L graphs and determine what fraction of the total the best year accounts for
- Even if you exclude the best year, see whether the remaining years stay in the black
Patterns I, II, IV, and V can also be verified using the numbers from the product page. This is written in the paid portion.
The greatest danger: you cannot tell in a few months even if it is breaking down
Then, should you look at the live performance after buying to see whether it degraded? There is a pitfall here.
Calculation example. We compare two methods. For both, one winning trade and one losing trade are 1,000 yen each (after costs).
- Discrepant method: win rate 45%. If continued, it will become negative
- Non-discrepant method: win rate 55%. If continued, it will stay profitable
When these two are run live, the probability that the appearance reverses for each trade count was calculated.
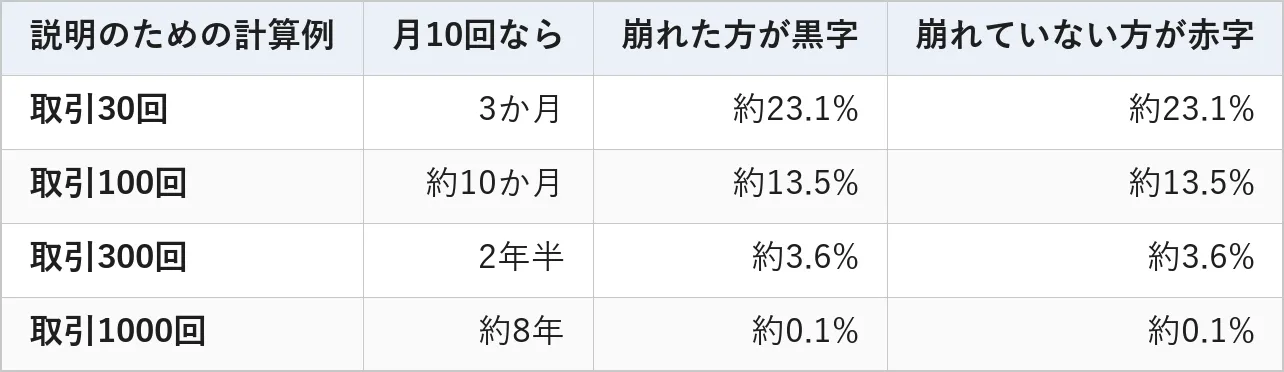
Condition: each trade's win/loss is independent of previous results. If the number of wins and losses is the same, neither is counted. This is a calculation example for explanation.
30 trades equal about 3 months if 10 trades per month. By this point, the probability that the discrepant method appears profitable is about 23.1%. In nearly 1 in 4 cases, it appears profitable even though it is breaking down. The non-discrepant method appears unprofitable with about the same probability of roughly 23.1%.
Even with 100 trades (about 10 months), about 13.5%. Clear distinction usually appears around 300 trades (about 2.5 years if 10 per month).
In other words, judging that it is not breaking down from the first few months of live performance, or panicking and stopping when you see breakdown, are both unreliable.
The reason this is the greatest danger is that you cannot get an answer quickly even by waiting for live performance. For the broken method in this calculation, by the time of about 300 trades, the average loss is 30,000 yen (assuming 1,000 yen per trade win/loss).
In the PF (Profit Factor) article, I wrote that results with few trades are not reliable. The same applies to live results after buying.
PF article "What is PF? Three cases where EA product pages with 'PF 1.5' also show a loss":https://www.gogojungle.co.jp/finance/navi/articles/126730
Two ways of thinking
Set the criteria first.If you cannot distinguish quickly from live results, you must write lines before buying and starting to run. Write lines like "If the best year accounts for more than half of the total, I doubt it," or "When the asset has declined to this point, I stop," before looking at the numbers. If you decide lines after seeing results, they will move to fit the method you like.
Doubt the discrepancy with live conditions.After looking at the product page results, first look for which of the five patterns is likely to break down. The better the numbers, the more important it is to verify which condition produced those numbers. I currently cross-check my own validation program results with the validation features of FX trading software, trade by trade. I don't disclose the numerical results here to avoid misinterpreting Pattern V's "discrepancy in testing construction."
Finally
In today's calculation, of a five-year, 500,000 yen performance, 420,000 yen concentrated in one year. And even a broken method appeared profitable after 30 trades in about 1 in 4 cases.
The calculations and figures in this article were produced using AI, and all numbers are verified by program.
I do not promise a method that guarantees winning. But I am seeking the Holy Grail. The Holy Grail I am pursuing is a trading rule that does not break down even after accounting for trading costs and in periods not yet observed.
Past data performance is the performance under those conditions and that period. If you know the patterns of how it breaks down, you can doubt breakdowns from the product page’s numbers without waiting for months of live results. By recalculating from excluding the best year, you can eliminate one fake grounded in a temporary market phase. Each fake you remove brings you one step closer to the Holy Grail.
- EA: A program that automatically executes FX trades
- Backtesting on past data: Running the EA on historical price data to produce performance
- Trading costs: Money incurred for each trade. The spread between bid and ask and fees
- Settings: The numbers inside the trading rules
- Win rate: The proportion of winning trades among all trades
- Drawdown: How much the assets have fallen from the peak
※This article is not investment advice. All numbers are for explanation and calculation examples only.
What you can obtain in the paid portion (980 yen)
In the free portion, I wrote the names of the five patterns, how to verify Pattern III, and why some things cannot be distinguished in a matter of months. By this point, you can identify Pattern III fakes.
The paid portion contains the verification methods for the remaining four patterns, anda ready-to-use sequence from opening the product page to starting live operationin a usable form.
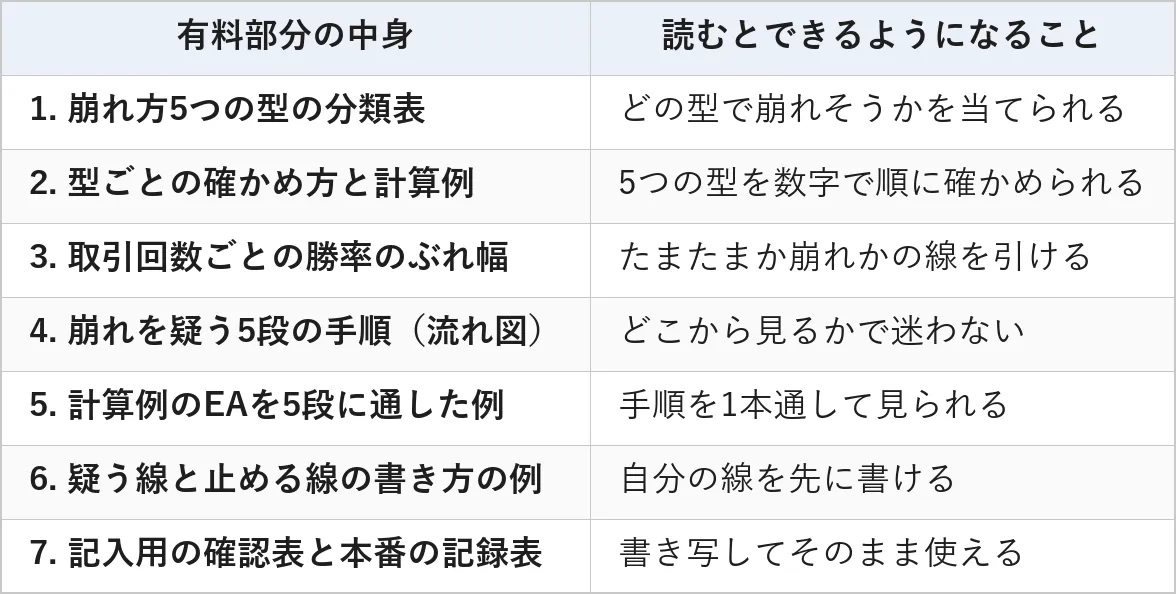
There are three steps to use.
- Before opening the product page, view an example of how to write the lines for doubt and stop, and write your own lines
- Open the product page, copy down the numbers in the five-step procedure in order, and fill out the verification table
- Before starting live trading, write a stop line, and after starting, record monthly results in the live log
Difference from Paid Article ①:Paid Article ① is about finding dangerous answer combinations before buying. This article determines which five-year past data results break down and decides the line that marks a breakdown after starting to run. You can read it even if you haven't read Article ①.
Who it is for:People planning to buy an EA or already running an EA who want to read the product page numbers themselves.
Who it is not for:People who want the name of a recommended EA. The product name is not provided. It does not promise a winning EA.
The numbers in the paid portion are also calculation examples for explanations. My own verification results and performance are not included.
In the free portion, you can exclude one Pattern III fake. If you can verify all five patterns, you can identify five types of fakes before buying. Each fake you remove brings you one more step closer to the Holy Grail.