
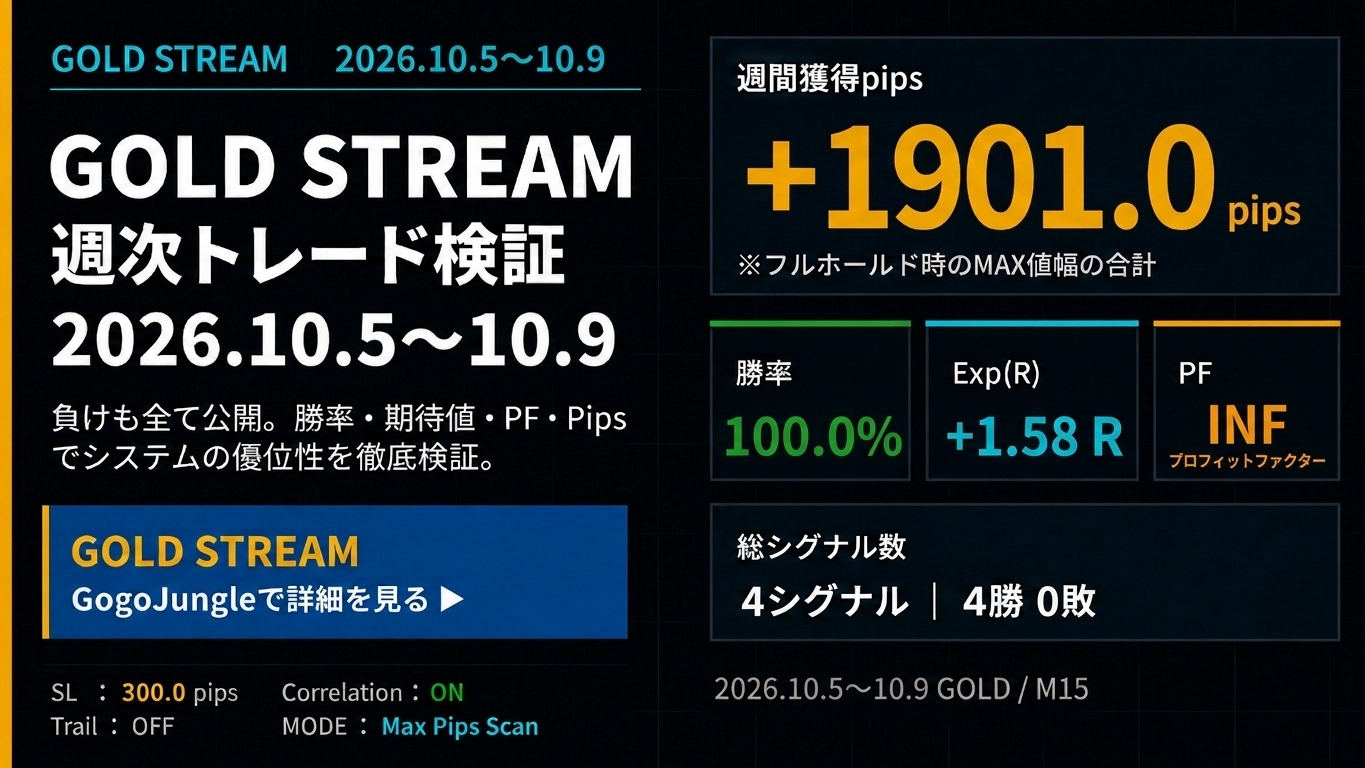
+1901pips【Weekly Trade Verification & Distribution History】GOLD Day Trade Specialization "GOLD STREAMv2" 2026.10.6~10.9
+1901pips【Weekly Trade Verification & Delivery History】
GOLD Day Trading Focused “GOLD STREAM v2” 2026.10.5–10.9
Review GOLD price movement, strength, and correlations, and assess signal accuracy, range, and expectancy weekly. Not only win rate but also PF, Exp(R), and 5-day ADR comparisons are included to evaluate this trading environment.
① GOLD Market Analysis
1. Price Movement
During the week of October 5–9, 2026, GOLD (XAU/USD) traded in a historically volatile manner: a sharp downtrend from the start to the midweek, followed by a solid support area and a rapid rebound that propelled prices back into the high range.
- Early-week decline:The early week saw prices capped at higher levels and trended lower, moving along technical key levels with significant drops.
- Rapid trend reversal:After reaching the midweek low near GOLD PIVOT WS1, strong buying pressure entered, creating a dynamic V-shaped recovery that surpassed thousands of pips in a short time.
- Movement in the high range:Into the weekend, buying momentum remained strong, approaching the resistance band (GOLD PIVOT DR3) and closing the week with robust upside momentum.
5-day ADR was750pipsand the market environment offered exceptional volatility for intraday trading with clear directional shifts.
2. Supply & Demand / Investment Factors
Macro economics and supply-demand dynamics showed that US Treasury yields and the dollar index movements significantly influenced session-to-session fund flows.
- Interest rate and dollar correlation:Ahead of key US economic indicators, interest rates moved intraday, directly triggering gold price sharp declines and surges.
- Central banks and physical demand buying:During pullbacks, central bank medium-to-long-term support was anticipated, and buyers with real demand quickly entered at markedly lower price levels.
- Safe-haven buying:As a hedge against global risk factors, gold spot and futures demand re-accelerated.
There was very strong buying interest at pullbacks after a sell-off concluded.
3. Investment Trend
Market participants showed rapid position adjustments as volatility expanded.
- ETF and futures funds:Speculative selling surged during the drop, but after a bottoming signal, funds aimed at momentum buying flowed back in quickly.
- Day trading activity:With ADR around 750pips, short-term players increased selling and buying activity to follow trends.
- Institutional rebalancing:Early-month portfolio adjustments and large-volume trades around technical key levels triggered rapid price moves.
Given the volatile swings, emotional trading was likely to be weeded out, creating a tense but selective investment environment.
4. Overall Assessment
This week’s GOLD market was a “large-range trend that sharply reversed from an early drop to a late rally.”It was a week characterized by a dramatic change in direction.Although the shift in direction appears challenging, accurately catching pullbacks or retracements can yield substantial profit. This week emphasized eliminating subjective trading in favor of objective signals and filters to follow the market.
⑤ SILVER / COPPER Market
SILVER
SILVER market: silver moved sharply lower following GOLD’s drop, but in the latter half it recovered with momentum that surpassed gold’s gains. Industrial demand and precious metal investment demand intersected, maintaining high volatility with an overall bullish bias.
COPPER
COPPER market: copper displayed resilient movement amid global economic trends and supply concerns from resource-rich countries. While reacting to currency fluctuations and macro indicators, price showed support at lower levels, building energy to break out of a narrow range.
② GOLD STREAM v2 Weekly Trade Verification
Weekly Verification Results
③ GOLD STREAM v2 Delivery History
Weekly Signals Delivery History

④ Weekly Verification AI Assessment
This time5-day ADR 750pipsprovides an excellent range environment; signals’ hit rate and correlation-filter-based skip decisions are thoroughly evaluated based on panel data and chart figures.
■ Signal Judgment and Entry Precision
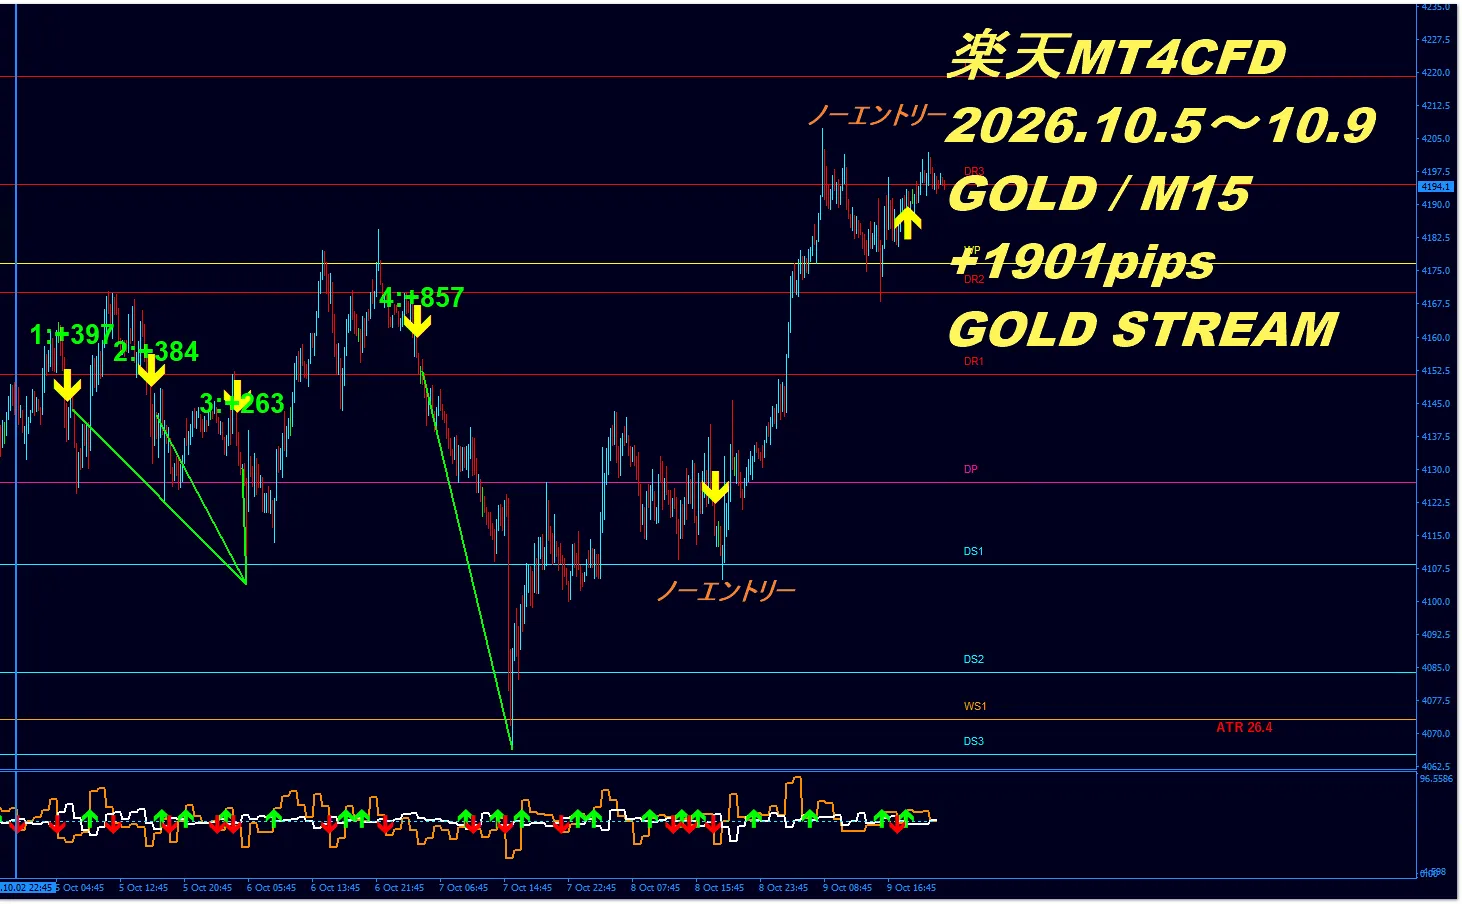
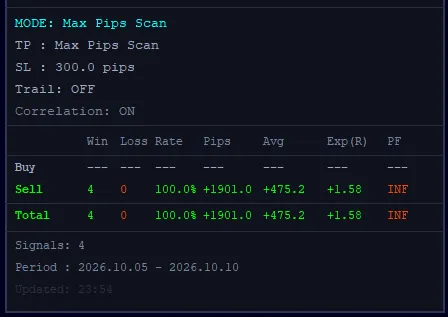
The verification panel (2026.10.05 - 2026.10.10) recorded 4 valid signals all Sell, resulting in4 wins 0 losses - win rate 100.0%an astonishing perfect record.
Each trade breakdown: 1st +397pips, 2nd +384pips, 3rd +263pips, 4th +857pips, total acquired pips+1901.0pips, average profit+475.2pips, exceeding the weekly average range of 750pips by a wide margin, covering substantial profits.
Additionally,as labeled on the chart “No Entry,” one missed signal due to correlation mismatch functioned correctly, preventing erroneous entries in irregular noise markets.
■ Performance Metrics: Win Rate, PF, Exp(R)
This week’s results showWin rate 100.0% · PF INF (infinite due to zero losses) · Exp(R) +1.58Rindicating overwhelming performance.
Because there were no losing trades, the profit factor is theoretically maximum (INF), and the expected value per trade isExp(R)+1.58Rdemonstrating that each trade yielded about 1.58 times the risk allowance (SL 300pips) on average.
■ Strengths & Correlation Analysis Evaluation
In a highly volatile market, the strength and correlation filter (Correlation: ON) delivered exceptionally high screening accuracy.
In early-trend or indecision phases, the ability to safely skip two inconsistent signals was the key to achieving a perfect 4-0 record, proving the tool’s robust risk-management capability.
■ MAX Pips Scan & SL Considerations
This chart usesMODE: Max Pips Scan / Correlation: ON.
The displayed pips represent the MAX value if the price action after signal generation were fully held.Therefore, +1901pips does not guarantee actual filled profits.
Additionally, stop-loss (SL) decisions are based on4-hour chart and do not rely solely on short-term movements on the M15 chart.
■ GOLD Market Difficulty
★★★★☆ 4 / 5
Although the 5-day ADR of 750pips provided a favorable range, the early sharp downtrend and late rapid rally created rapid changes in trend that made self-assessment of turning points highly challenging.
■ GOLD STREAM Weekly Trade Verification Evaluation
★★★★☆ 5 / 5
In the midst of complex market fluctuations, after correctly filtering through two skipped signals due to correlation mismatch,Win rate 100.0% · gained +1901.0pips · expectancy +1.58Rmarking an unequivocally top-tier result.
The tool’s edge and the risk-filter’s sophistication fused to create an ideal result, earning a perfect score (5 stars).
■ AI Overall Comment
This week's verification shows how powerful GOLD STREAM v2’s total advantage is.With four consecutive wins approaching 2,000 pips and one unnecessary entry properly skipped, this is proof of a professional-grade system.
Would you like to trade objectively, using the market’s strength and correlation as allies rather than emotions?
Get the overwhelmingly performant and reliable “GOLD STREAM v2” now and dramatically elevate your results from next trade onward!
Verification data evidence
GOLD Trading Can Lead to Large Losses
“It’s rising, but I’m not sure if I should enter now.”
“I don’t know where to enter.”
“Price moves are too volatile; entries feel scary.”
In markets with large price ranges like GOLD, it’s important not to chase by feel alone, but to have criteria for entering or skipping based onwinning rate, PF, expectancy, strength, and correlation.
GOLD STREAM v2 specializes in GOLD day trading, supporting entry decisions while confirming market strength and correlations.
View GOLD STREAM v2 product page Ask a questionRelated Articles
If you’d like to learn more about trading concepts and GOLD trading, check these out.
- 【Video】“GOLD STREAM Signals Price Movement After Signals | TRADE REVIEW (2026.8.10–9.04)”
- The One Reason Results Fail
- Why Trades End in “Small Profits, Big Losses”
- 【Unveiling Tool’s Performance】GOLD STREAM Exclusive Win/Loss Tool Verification
- Conclusion: You can trade GOLD (XAU/USD) with a domestic FX account.
The verification results and figures presented here are based on backtested data from past markets and are for reference only; they do not guarantee future profits or similar results.
The pips and P/L data shown are based on the maximum potential movement (MAX) reached after an entry signal, calculated under fixed stop-loss (SL) settings as reference values. These reflect the MAX value if price movements were fully held after signals and do not represent actual realized profits or trade outcomes.
Actual profits and losses depend on entry/exit timing, spreads, slippage, trading fees, execution environment, position size, take-profit/stop-loss decisions, and market conditions. SL decisions are based on the 4-hour chart and may vary with actual trading conditions.
Furthermore, due to differences in trading conditions and price feeds, actual prices, pips, P/L, and trade results may vary across brokers or trading platforms. Therefore, there may be discrepancies between published data and actual performance.
This data is a reference for evaluating GOLD STREAM v2’s signal edge and market analysis accuracy. Final investment decisions should be made considering your own capital, risk tolerance, and trading environment, at your own risk.