

The daily range of gold had increased elevenfold over nine years
11x Average daily range (2017→2026) | 2.4x Difference by time slot (most recent year) | 1.05x Difference by day of the week (most recent year) |
I am lab.aiueo, creating MT4/MT5 indicators and selling them on GogoJungle.
When creating an indicator for gold, I measured how much gold moves in a day, year by year. For this article, I re-measured once more.
Seeing the results, I was honestly surprised.
Today I’ll write about the results by year, by time slot, and by day of the week, and how they affect stop loss settings. At the end, I’ll include a script for measuring the same on your own account.
How it’s measured
- Data: Titan FX MT5 gold (XAUUSD). 2011-01-03 to 2026-08-07
- Range: High minus low per day (daily data). Time slot range: high minus low of the 1-hour chart
- Ratio: range ÷ opening price of that day
- For 2026, data up to August 7
Prices vary slightly by broker, so figures differ slightly. The overall trend should be similar across brokers.
Average daily range by year
| Year | Average daily range | Percentage of price | Average price |
|---|---|---|---|
| 2011 | $29.93 | 1.85% | $1,573.71 |
| 2012 | $22.63 | 1.36% | $1,668.56 |
| 2013 | $24.70 | 1.78% | $1,413.10 |
| 2014 | $16.56 | 1.32% | $1,266.17 |
| 2015 | $15.86 | 1.36% | $1,160.23 |
| 2016 | $18.29 | 1.47% | $1,248.54 |
| 2017 | $11.61 | 0.93% | $1,256.61 |
| 2018 | $12.26 | 0.97% | $1,268.80 |
| 2019 | $15.30 | 1.09% | $1,392.90 |
| 2020 | $30.77 | 1.74% | $1,770.62 |
| 2021 | $23.88 | 1.33% | $1,798.92 |
| 2022 | $25.77 | 1.43% | $1,801.02 |
| 2023 | $23.82 | 1.22% | $1,941.67 |
| 2024 | $33.14 | 1.38% | $2,387.10 |
| 2025 | $60.88 | 1.73% | $3,438.01 |
| 2026 (through 8/7) | $132.20 | 2.85% | $4,582.69 |
The calmest year was 2017, with an average daily range of $11.61. It grew to $132.20 in 2026, an 11-fold increase.
The price of gold itself has risen as well. The average in 2017 was $1,256, and in 2026 it is $4,582. That’s 3.6x.
So, was the wider range solely because the price rose? Looking at the percentage of the price, it rose from 0.93% in 2017 to 2.85% in 2026—about 3x in percentage terms as well.
There was another big move in 2020, but after that it settled. From 2025, it became even larger again.
Time-of-day averages (Japan time, most recent year)
From the hourly data of 2025-08-07 to 2026-08-07, averages were taken by Japan time slots.
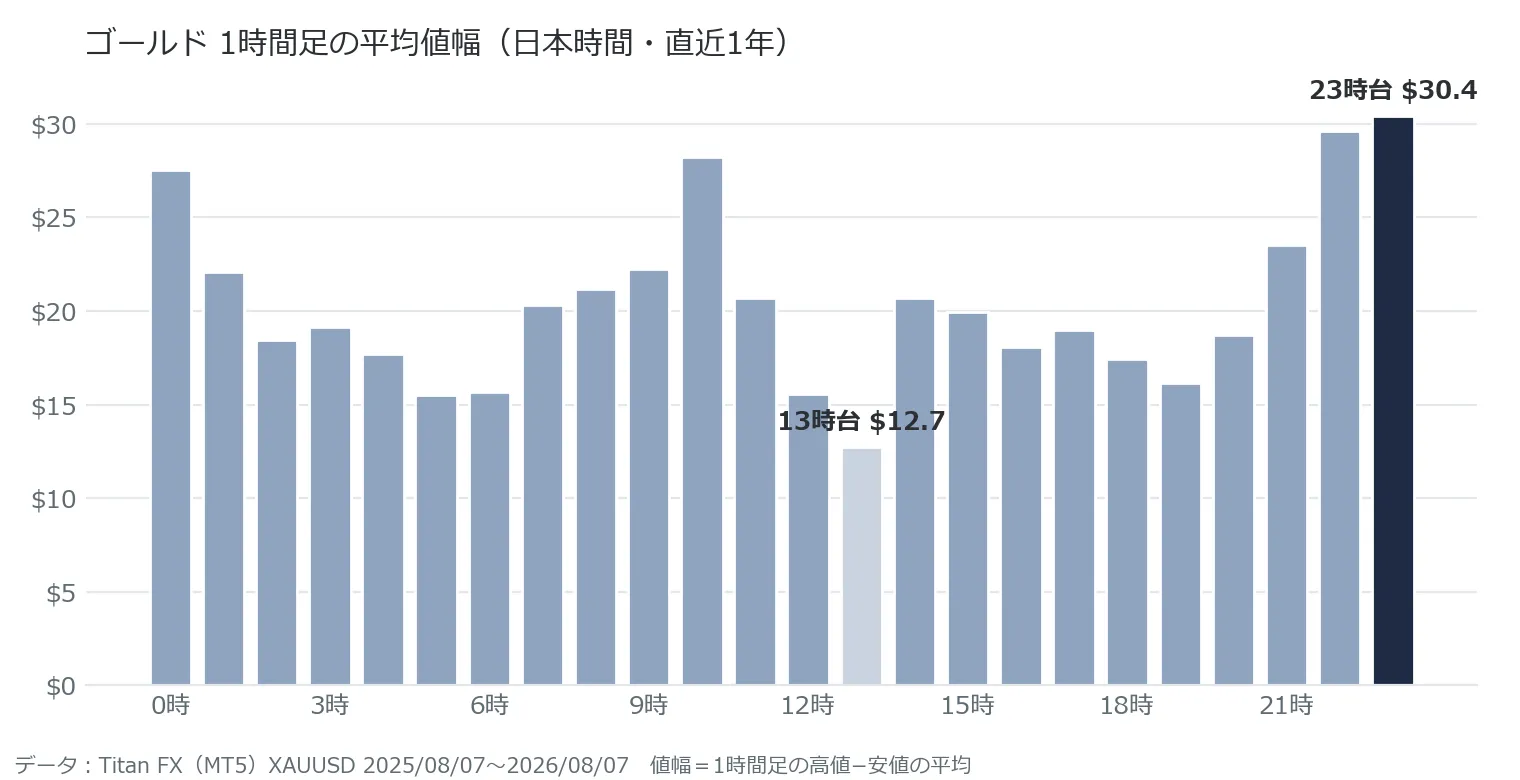
- The largest is the 23:00 hour, at $30.43. The 22:00 hour at $29.65 follows
- The smallest is the 13:00 hour, at $12.74
- There is a 2.4x difference between large and small time slots
The 22–23 hour slot is shortly after New York trading begins. The 13:00 slot is Tokyo's daytime.
There are also peaks at 10:00 (28.26) and 0:00 (27.55) Japan time.
The 6:00 and 7:00 Japan time slots have fewer data points because trading stops during server daily reset.
Average daily range by day of week (most recent year)
Using the same daily data, averages were calculated by day of week.
- Monday: $110.97
- Tuesday: $106.56
- Wednesday: $105.25
- Thursday: $110.09
- Friday: $109.94
The gap between the largest Monday and the smallest Wednesday is 1.05x. Differences by weekday were almost negligible.
When I previously made GD-Signal, I did not include a weekday filter, because the weekday differences were almost nonexistent in the measured data.
Why a fixed stop loss width stops fitting year after year
For example, if you fix the stop loss to "10 dollars":
- 2017: about 86% of the average daily range. In one day it might reach it
- 2026: about 8%. Even in the quietest 13:00 hour, the hour average moves 12.74 dollars
The same fixed value of "10 dollars" means something completely different in 2017 vs now. A setting made in 2017 would reach stop loss quickly in today’s market.
The same applies if you set in pips—the value of 1 pip for gold differs by broker, causing additional misalignment.
Instead of a fixed width, use a width that changes with market movement, such as a multiple of ATR (average true range). This keeps it meaningful across years.
Script to measure on your own account
A script to display the yearly average ranges in MT4/MT5 under the Expert tab. I verified that it compiles in both MT4 and MT5 with no errors or warnings.
How to use:
- In MetaEditor, create a new "Script" (MT4 uses .mq4, MT5 uses .mq5)
- Replace the contents with the code below and compile
- Drag the script onto the chart of the instrument you want to measure from the Navigator
- The yearly results will appear under the "Experts" tab in the Terminal
//+------------------------------------------------------------------+
//| Script to output yearly average ranges in the Expert tab          |
//+------------------------------------------------------------------+
#property script_show_inputs
input int Years = 10;   // How many years to look back

void PrintYear(int year, int days, double sum, double pct)
{
   if(days > 0)
      PrintFormat("%d year  %d days  average range %.2f  percentage of price %.2f%%",
                  year, days, sum / days, pct / days);
}

void OnStart()
{
   MqlRates r[];
   // Read daily bars up to yesterday in oldest-first order (today's bar is partial)
   int n = CopyRates(_Symbol, PERIOD_D1, 1, Years * 262, r);
   if(n <= 0) { Print("Could not fetch daily data"); return; }

   int    year = 0, days = 0;
   double sum = 0, pct = 0;
   for(int i = 0; i < n; i++)
   {
      MqlDateTime t;
      TimeToStruct(r[i].time, t);
      if(t.year != year)
      {
         PrintYear(year, days, sum, pct);
         year = t.year; days = 0; sum = 0; pct = 0;
      }
      double w = r[i].high - r[i].low;
      sum += w;
      pct += w / r[i].open * 100.0;
      days++;
   }
   PrintYear(year, days, sum, pct);
}
Some brokers may not provide older daily data. In that case, results will only show rows for the years available. This works for instruments other than gold as well.
What the creator tends to decide
- Gold stop loss width is determined by a multiple of ATR, not fixed dollars or pips
- Time-of-day movement is derived from recent measurements rather than a fixed table
- No weekday filtering (differences are small)
GD-Deck uses ATR multipliers to determine stop loss width and calculates position size from that. Time-of-day movement is summarized from the most recent 20 days of hourly data and displayed on a 24-hour graph.
GD-Deck
A gold-only instrument panel that shows price movement as the power of gold and dollar, including ATR-based lot sizing and time-of-day movement graphs on a single panel. It does not claim to show win rate or profits.
GD-Deck (MT4) | View sales page |
This article is based on my own compilation of Titan FX MT5 price data. Prices vary by broker, and past ranges do not guarantee future movements. It does not promote a particular trading method. The indicators introduced here are tools to assist market analysis and do not guarantee profits. Investment decisions are yours to make responsibly.
Thank you for reading to the end.