

Principle of the Fold/Wrap (Practical Edition) | Still, do not sell. Waiting for that response.
ULTRA THEORY / PRACTICE 01
October 7th (Wednesday). In reality, I was waiting for a bigger pullback.
With the story of the higher timeframe rally still intact, which smaller wave met the conditions to sell? From the 15-minute chart to the 4-minute chart, let's follow the day's judgments.
The practical parts from next time onwards are planned to be paid. In this article, read the hypothetical scene of 4-minute chart ① and the actual trading of 4-minute chart ② separately.
The main text ❶–❹ corresponds to chart circled numbers 1–4. ⓐ–ⓜ refer to the circled letters in the diagram. The diagram’s notation remains as in the original image.
15-minute chart (Wed)
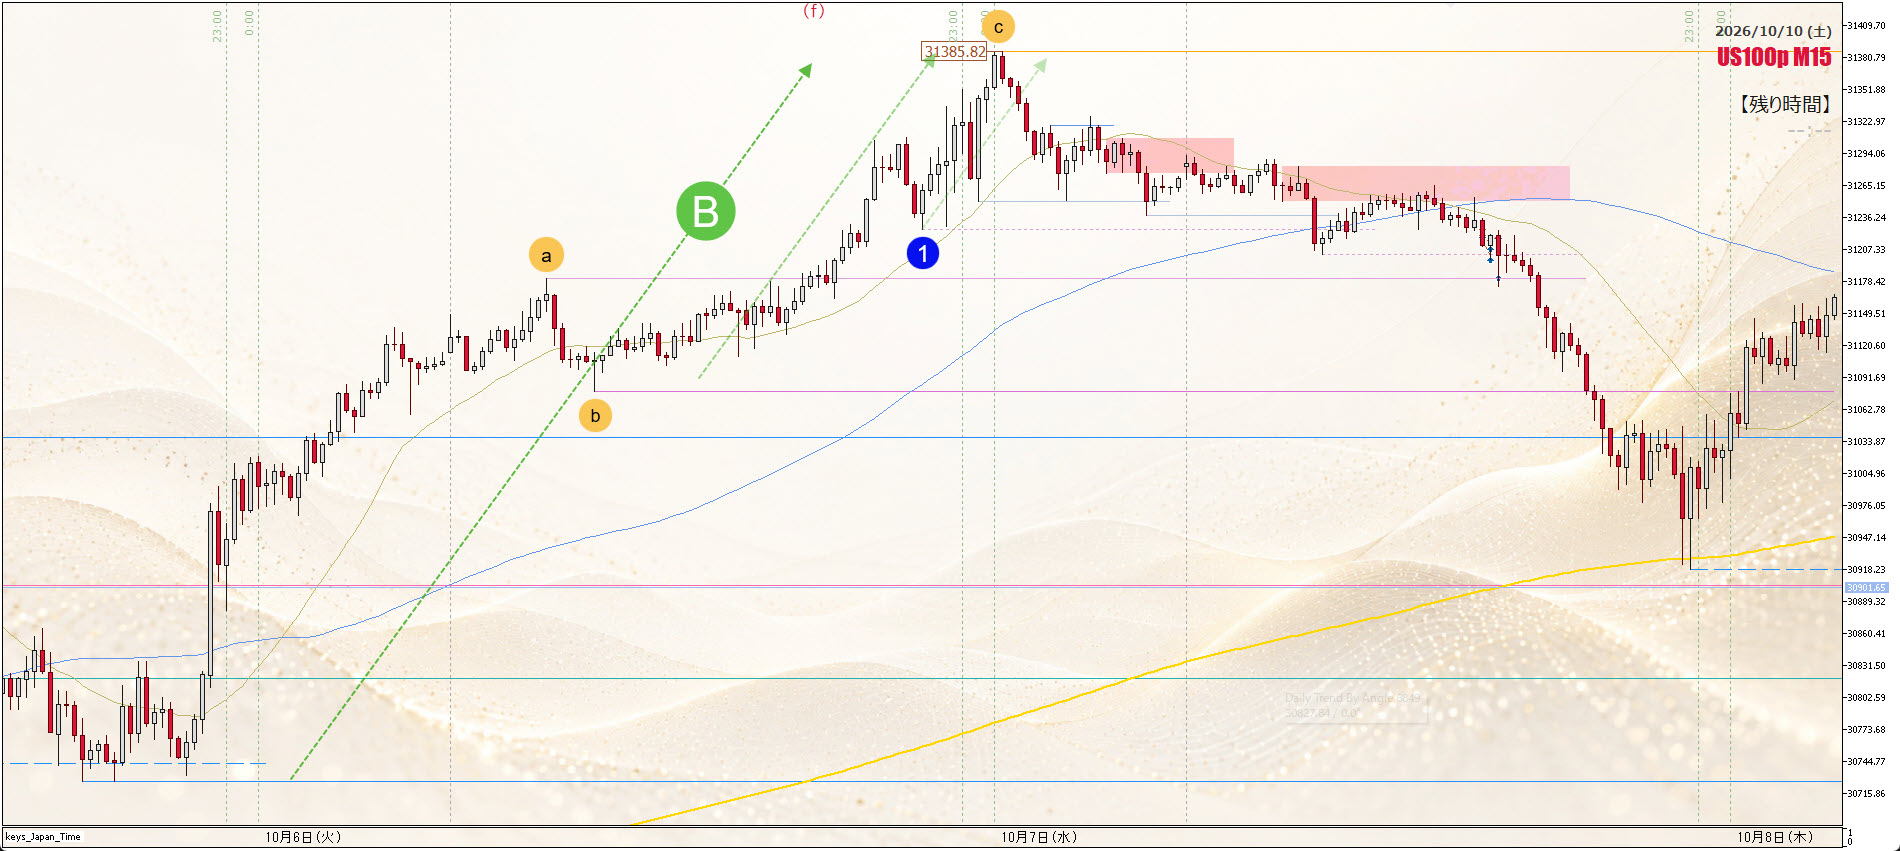
The tip of rising B ⓐ, ⓑ, ⓒ and the low of inner wave D ❶.
Original size display; open in a new tab ↗
First, what is happening now?
=It’s the continuation of the rising trend that makes up the rising B, right?
And at the tip, you can confirm the peaks ⓐ, ⓑ, ⓒ of the Dow wave.
So, originally, you would wait for a pullback to this single wave ⓑ-ⓒ, in response to ⓐ-ⓑ-ⓒ, and then buy the pullback. That would be the proper method.
But wait a moment?
How far could this rise go, to begin with? In coin toss terms, repeated tails eventually lead to a head, but for trends, this logic can actually be applied quite a bit.
Wouldn’t it be reasonable to expect a larger pullback coming soon? That’s how it is.
Of course, the original idea is to wait for that “larger pullback” and buy the pullback for the greatest advantage, but I can’t always wait, so I observe this area closely.
Where did the downward turn begin?
As with A on the 1-hour chart, there is B, and if you look at smaller internal structure, there is C against B, and D against C. This is fractal. C and D are not drawn on the chart, but I show them by adjusting the transparency of the green arrows. You understand, right? Therefore, the low of wave D is ①.
• No further observation on lower timeframes is necessary. If you look at the 15-minute candlesticks, you can imagine the story. Of course, you can go look as well. Just be careful not to get drawn into the 1-minute story if you’re a beginner ☝?
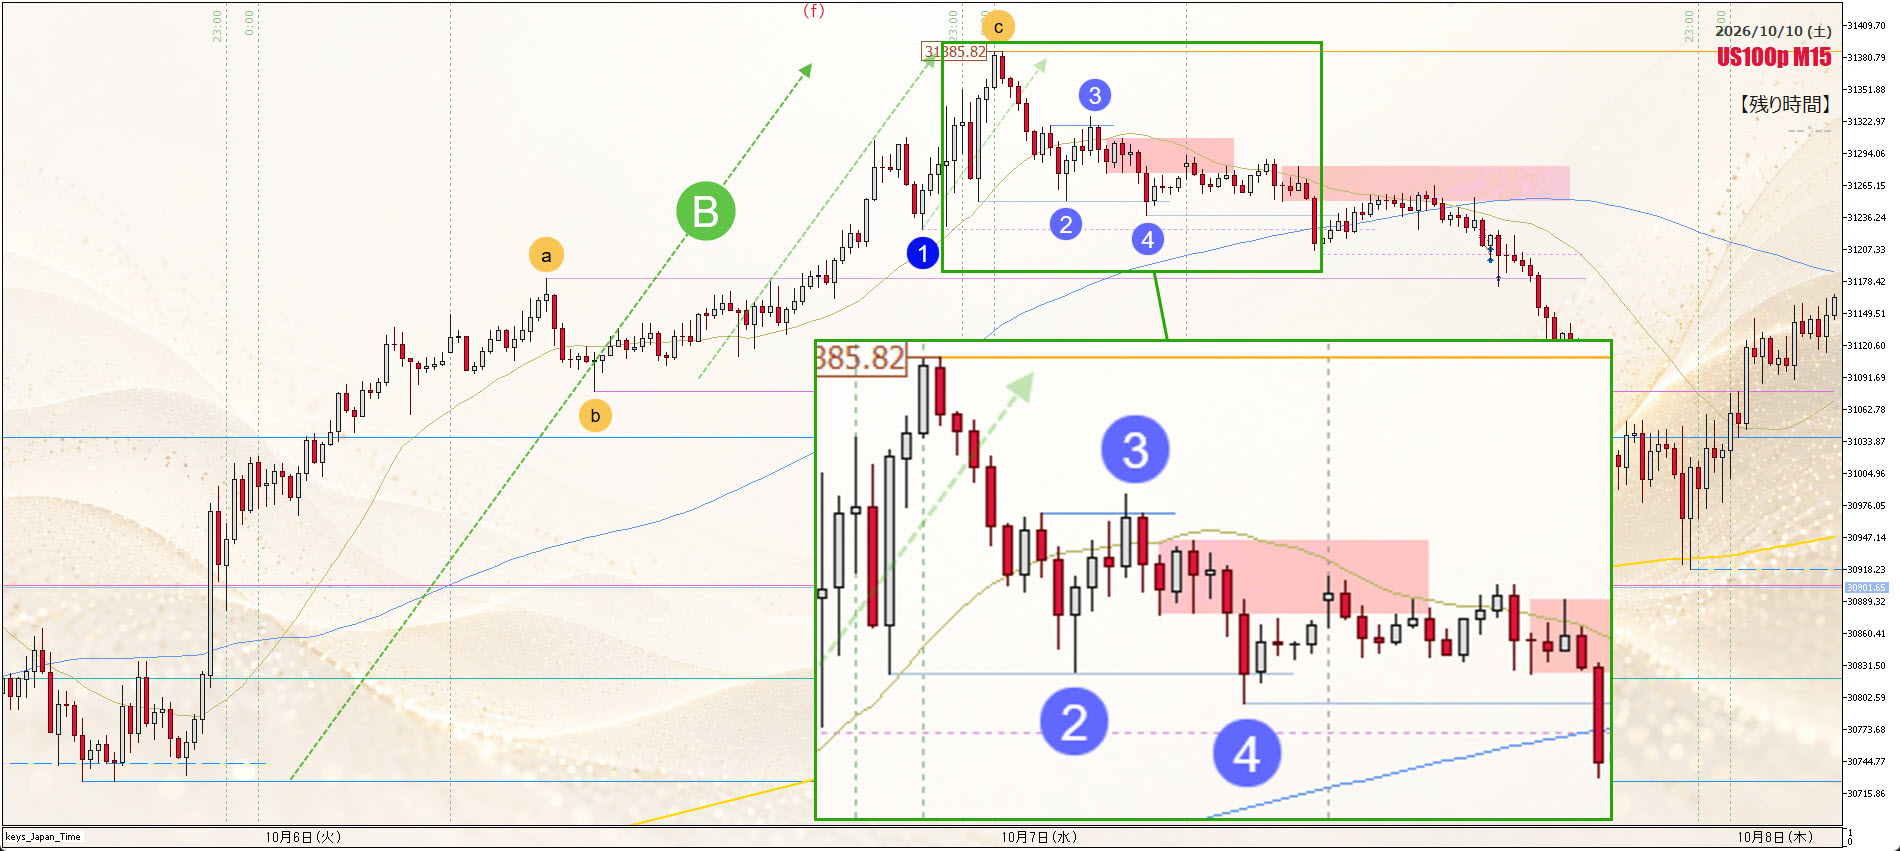
❷→❸ does not continue rising, and ❹ breaks below ❷.
Original size display; open in a new tab ↗
Now, I added ❷❸❹ to the chart and zoomed in further.
From the peak 31385.82, a sequence of bearish candles continues, and a single bullish candle briefly appears and crosses the high of the adjacent candle, indicating that the pullback occurred more quickly in the shorter term after the bullish three-candle rise. However, this pullback failed. The consecutive bearish candles from above created a “flow” that swallowed it, resulting in a 100% retrace. The low becomes ❷.
Here, the chart again crosses the earlier pullback high. It’s high ❸.
Clearing the obvious high from the peak ⓒ after the downward trend implies that ❶ (within D) is still active, meaning the ongoing rise might still continue from here. Of course, that doesn’t mean I’m going long. Fundamentally, I’ve already decided to halt chasing this rise. If it continues, fine, but I’m ready to stop chasing.
Then, what did the chart say later? Yes. For the rise from ❷ to ❸, the pullback was tested for about an hour, but failed, and ❹ broke below ❷. From this point, one can judge that the short-term trend has turned downward.
But wait a moment.
That doesn’t mean I’ll immediately go short.
This is where the important part begins.
Whether resistance can function as resistance.
What I’m watching is this. Now, let’s go down further to look at the shorter term.
4-minute chart ①|A moment not encountered
There was no opportunity here. The statements “would have beaten it,” “would have added,” and “settling” are reflections of what would have happened if entered.
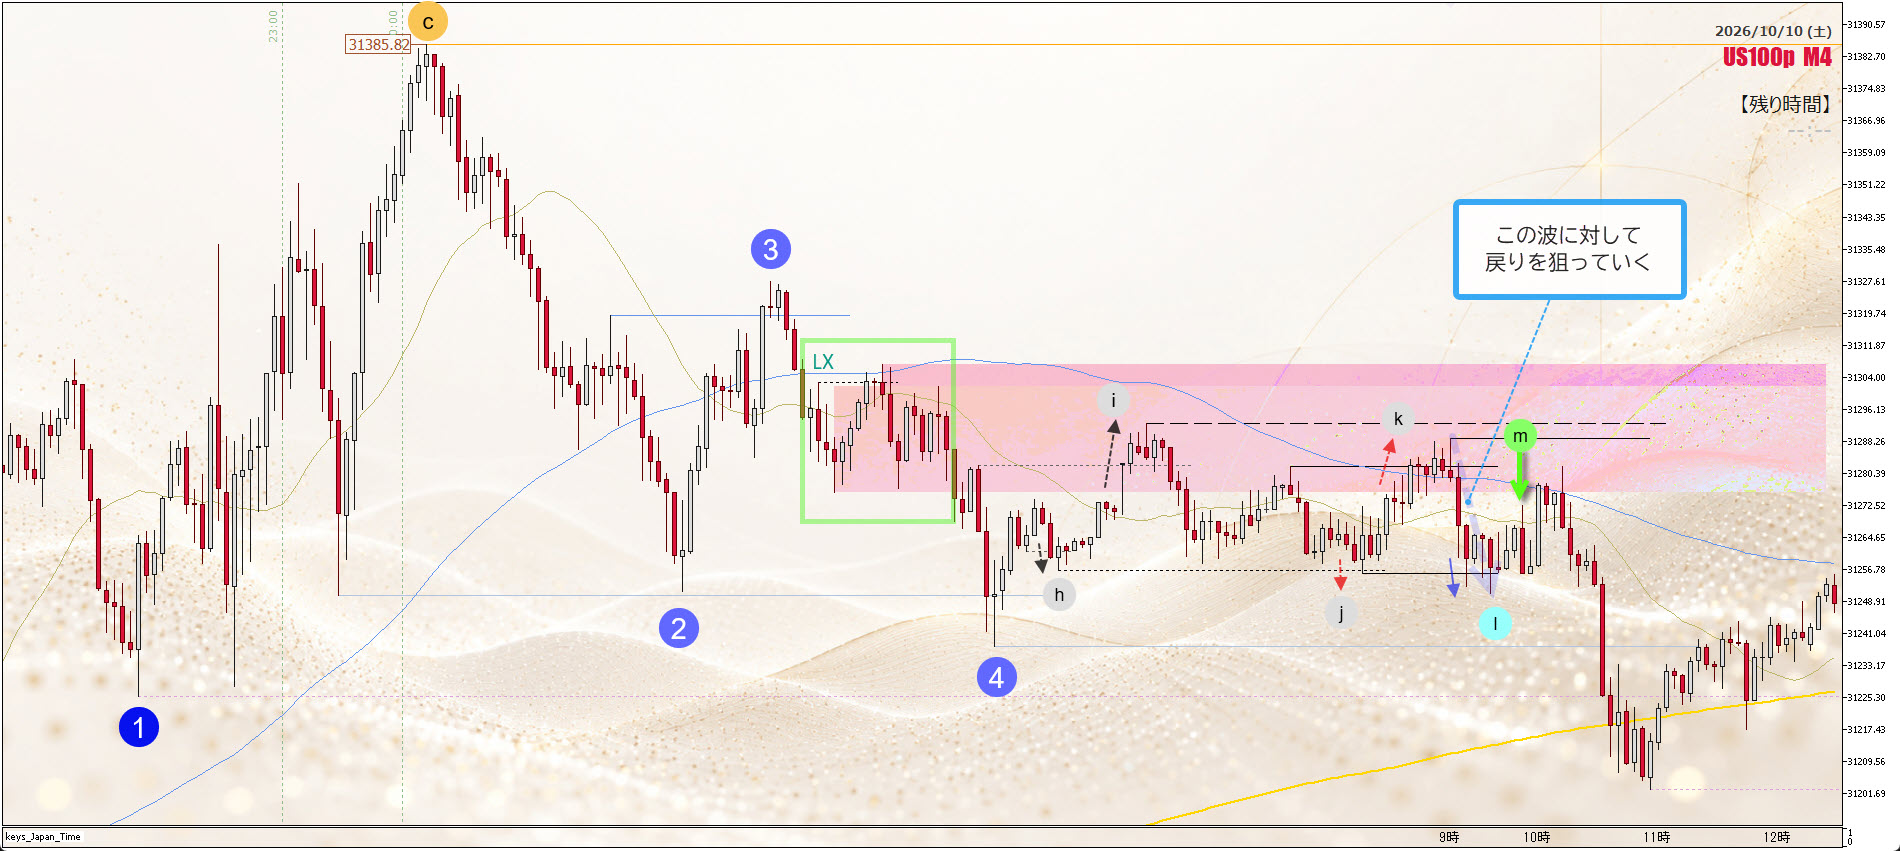
Opportunities not encountered. Read LX and ⓗ~ⓜ. Trades and settlements here are hypothetical.
Original size display; open in a new tab ↗
The wave where ❸-❹ begins to turn downward. The green frame LX is the pullback against ❷-❸. If you’ve read the article seriously up to this point, you’ll probably understand why this is recognized as a pullback.
Comprehension Test ① Why can LX be recognized as a pullback?
Here, the low ❷ was broken. Then on its right side, it can function as resistance
This requires caution. It’s not that resistance will always function, nor that we decide it will easily function. We must verify whether it functions.
So what does it mean for it to “function”? This is it. And again, the method of recognition is the same here.
First, ⓗ-ⓘ appear to confirm the rise bottomed at ❹. The rise trend collapses at ⓙ. At this point, the resistance LX might have functioned. However, having watched ⓚ break ⓘ many times, I don’t decide in advance here either. If it goes smoothly, fine. That’s as far as it goes.
Because the low ❶ is still relevant, and I’m in a stance to buy, waiting for a bigger pullback could still be the case given the background. So I want more evidence.
Then, the move that broke the downward-trend high from ⓘ began to fall again toward ⓚ, showing a pullback.
Then it completely failed, and ⓛ broke again on ⓙ. At this moment, I considered “the decline is established.” So I would have hit the head of the next bullish candle, and added one more at ⓜ. And then, with the strong bullish candle to its right, I would have closed the position by breaking ❶ at a good point. And I would have said this.
See?
Like that, lol
Hey! It didn’t enter here! Huh? Sorry, lol. Here I didn’t encounter it. But the next time will be exactly the same, so relax lol
Now, let’s actually look at the entries in succession ☺️
4-minute chart ②|Actual entries
From here on, this is the moment the person actually entered. Read the execution at ⓜ.
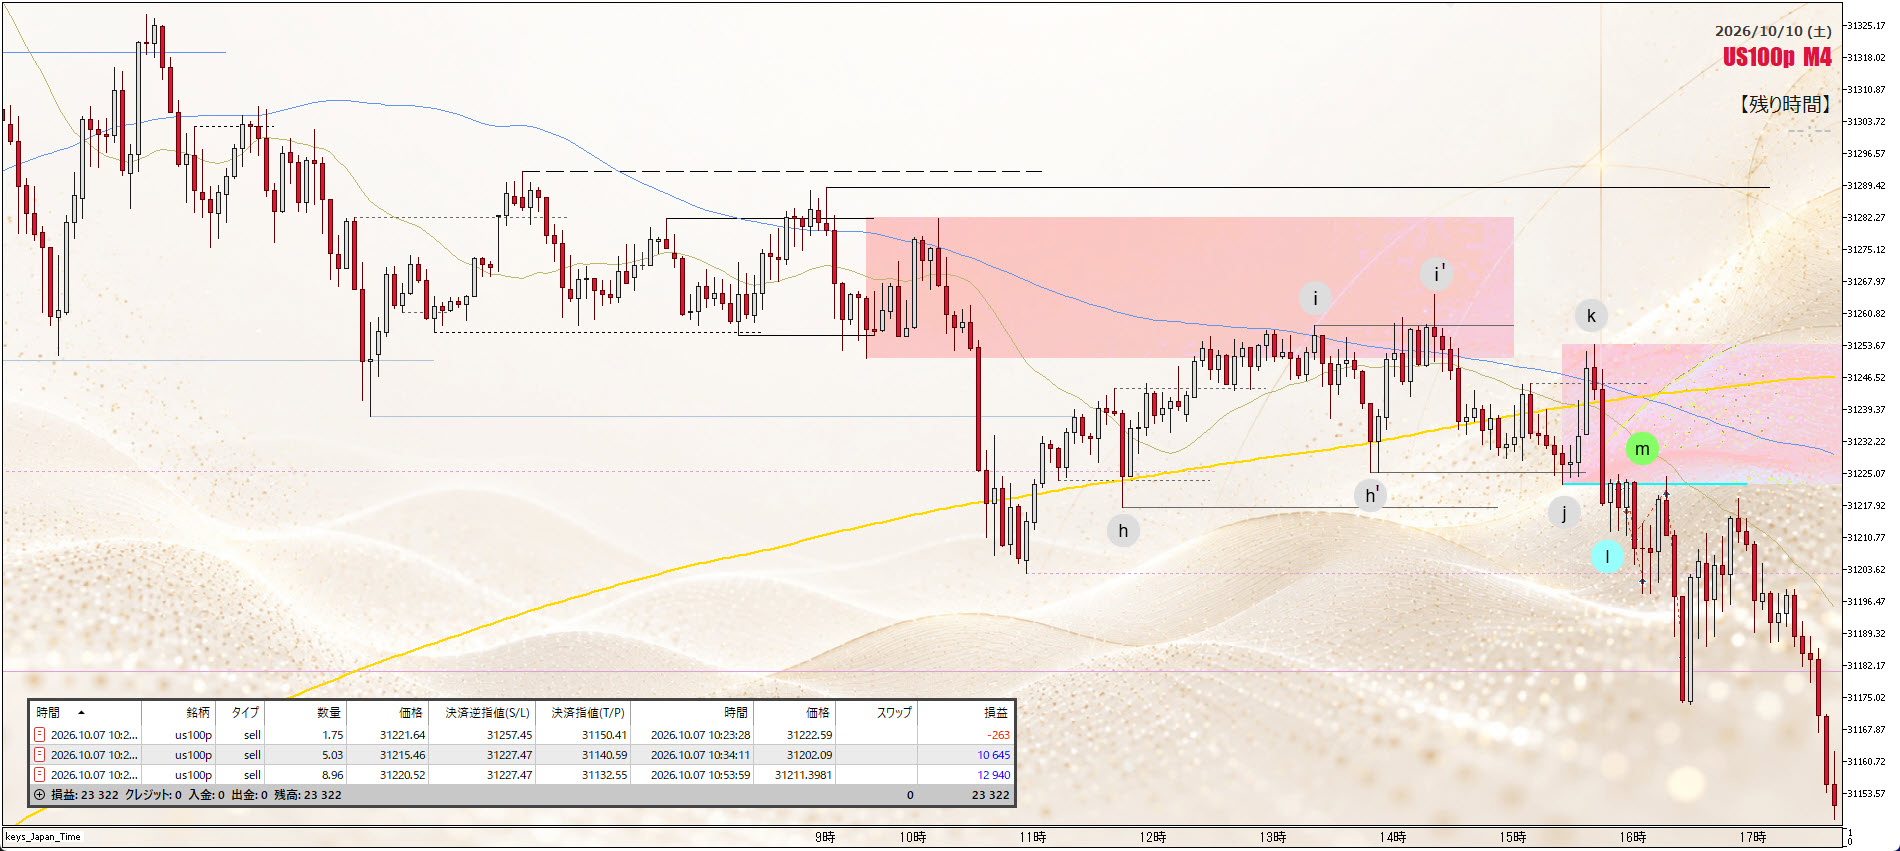
After the decline continued, a return occurred. After passing through ⓗ′, ⓘ′, ⓙ, ⓚ, the person hit ⓜ twice.
Original size display; open in a new tab ↗
This time, the difference from last time is the resistance condition and that the trend continued once against ⓗ-ⓘ. That’s probably the nuance.
Let’s go one by one. First, the resistance part.
Last time, resistance was the LX that entered as a pullback against the rise of ❷-❸ and failed. So this time?
This time, because the downward flow already continued, selling entered and the drop continued, progressively recognizing the root of that wave as resistance—a trend-following approach.
In other words, last time the higher-side story remained, so the root of the pullback that failed was recognized as resistance. But this time, since the downward trend’s continuation is already confirmed, recognize the root of the continuing wave as resistance.
And next.
Last time, the pullback against ⓗ-ⓘ occurred, but ⓘ’ breaching high did not happen. Now, the pullback against ⓗ-ⓘ succeeds, forming the rising wave ⓗ'-ⓘ'. But resistance hasn’t been crossed, right? In such a situation, the breakdown of the low ⓗ′ by ⓙ occurs. Therefore, in reality you should hit ⓚ. This is the long-entry moment, and if the chart were inverted, you’d be picking ⓚ. But I have a habit of being one step late on shorts, so I hit ⓜ twice.
Do not confuse two scenes.
4-minute chart ①|Hypothetical
After the failed pullback LX, do not conclude with only the rise that returned through ⓙ. After ⓚ, if pullback doesn’t continue, wait until ⓙ breaks with ⓛ. The sells, additions, and settlements here are explanations for what would have happened if you were present.
4-minute chart ②|Actual trades
Look at the root of the already continuing decline. The return continued once to ⓗ′→ⓘ′, but did not cross the resistance, and ⓙ broke ⓗ′. The actual execution described in the manuscript is ⓜ twice.
The October 7th weekly performance image shows 3 details with a total of +23,322 yen. Do not treat “one opportunity,” “execution explanation,” and “lines in the details” as the same count.
How about that? I think you can grasp the general reasoning, right?
If you apply this way of thinking to various places and review the charts, I believe you’ll catch something.
See you again! Thanks!
This article is a learning record that reflects past charts and the trader’s own trades. It does not guarantee specific trades or future profits.