

Week 40 NASDAQ recap | Profits do come out properly.
ULTRA THEORY / WEEKLY REVIEW / 2026 W40
This week's chart is viewed in order from the big wave.
Weekly chart
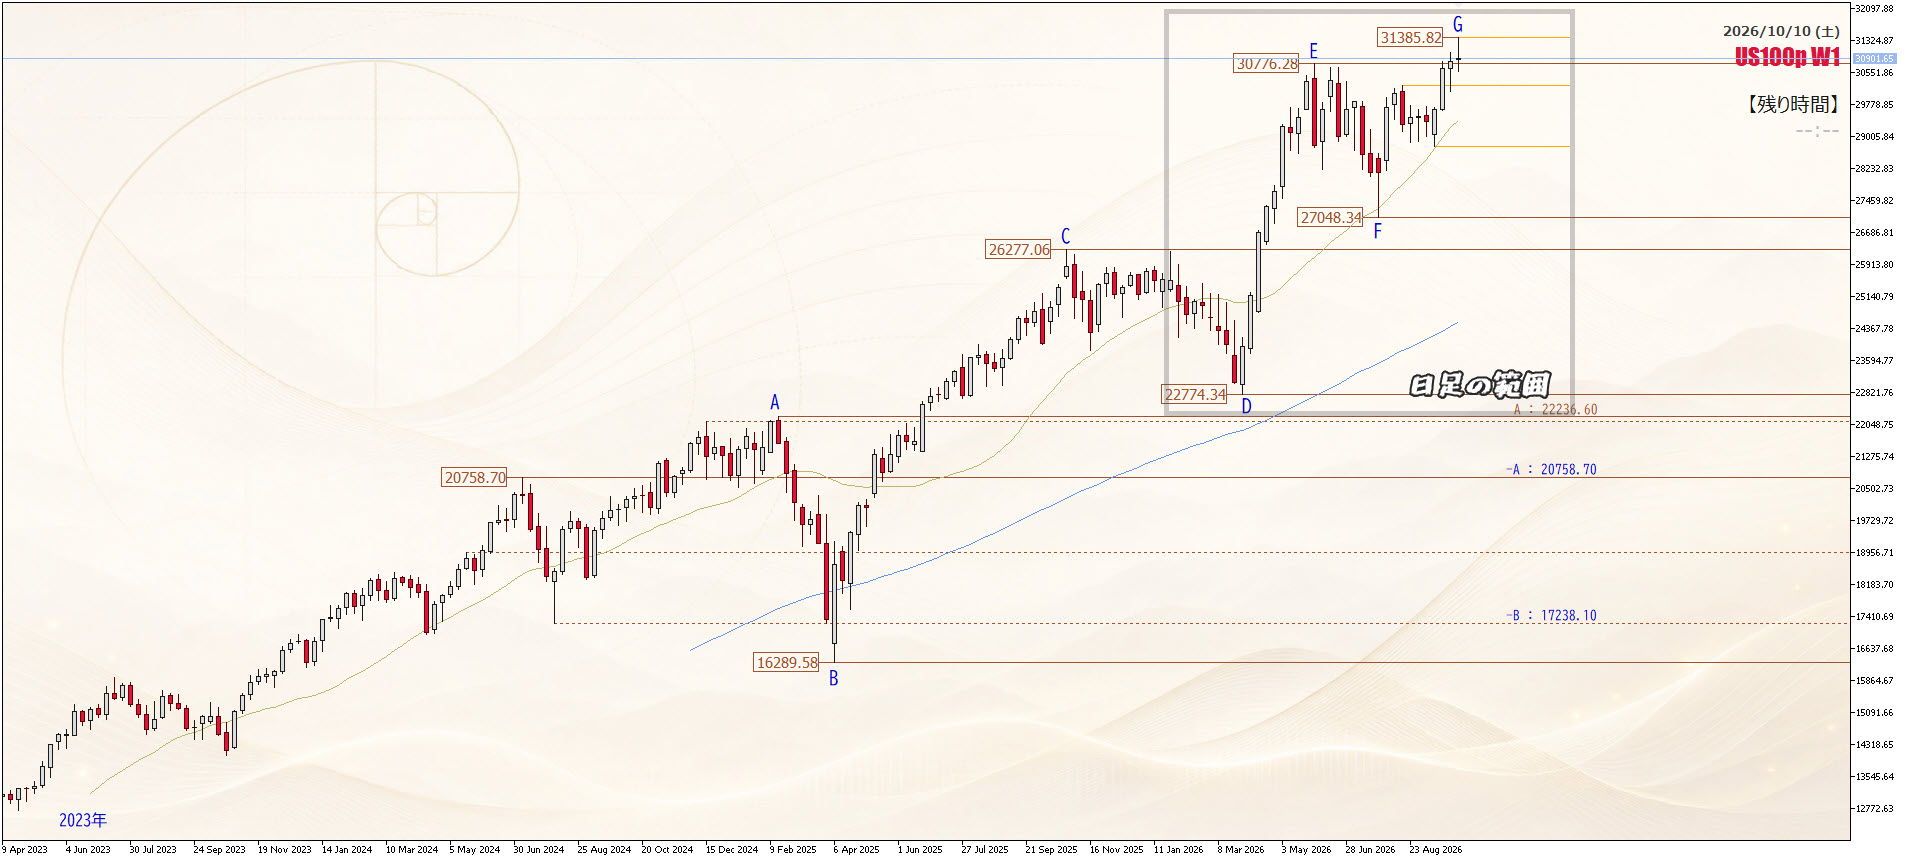
The rising wave (D-E) and F after the E breakout.
Original size display · Open in a new tab ↗
Against the weekly rising wave (D-E), the high E was broken with a wick the week before last, so the low is confirmed as F, and a two-week pullback followed afterward.
Daily chart
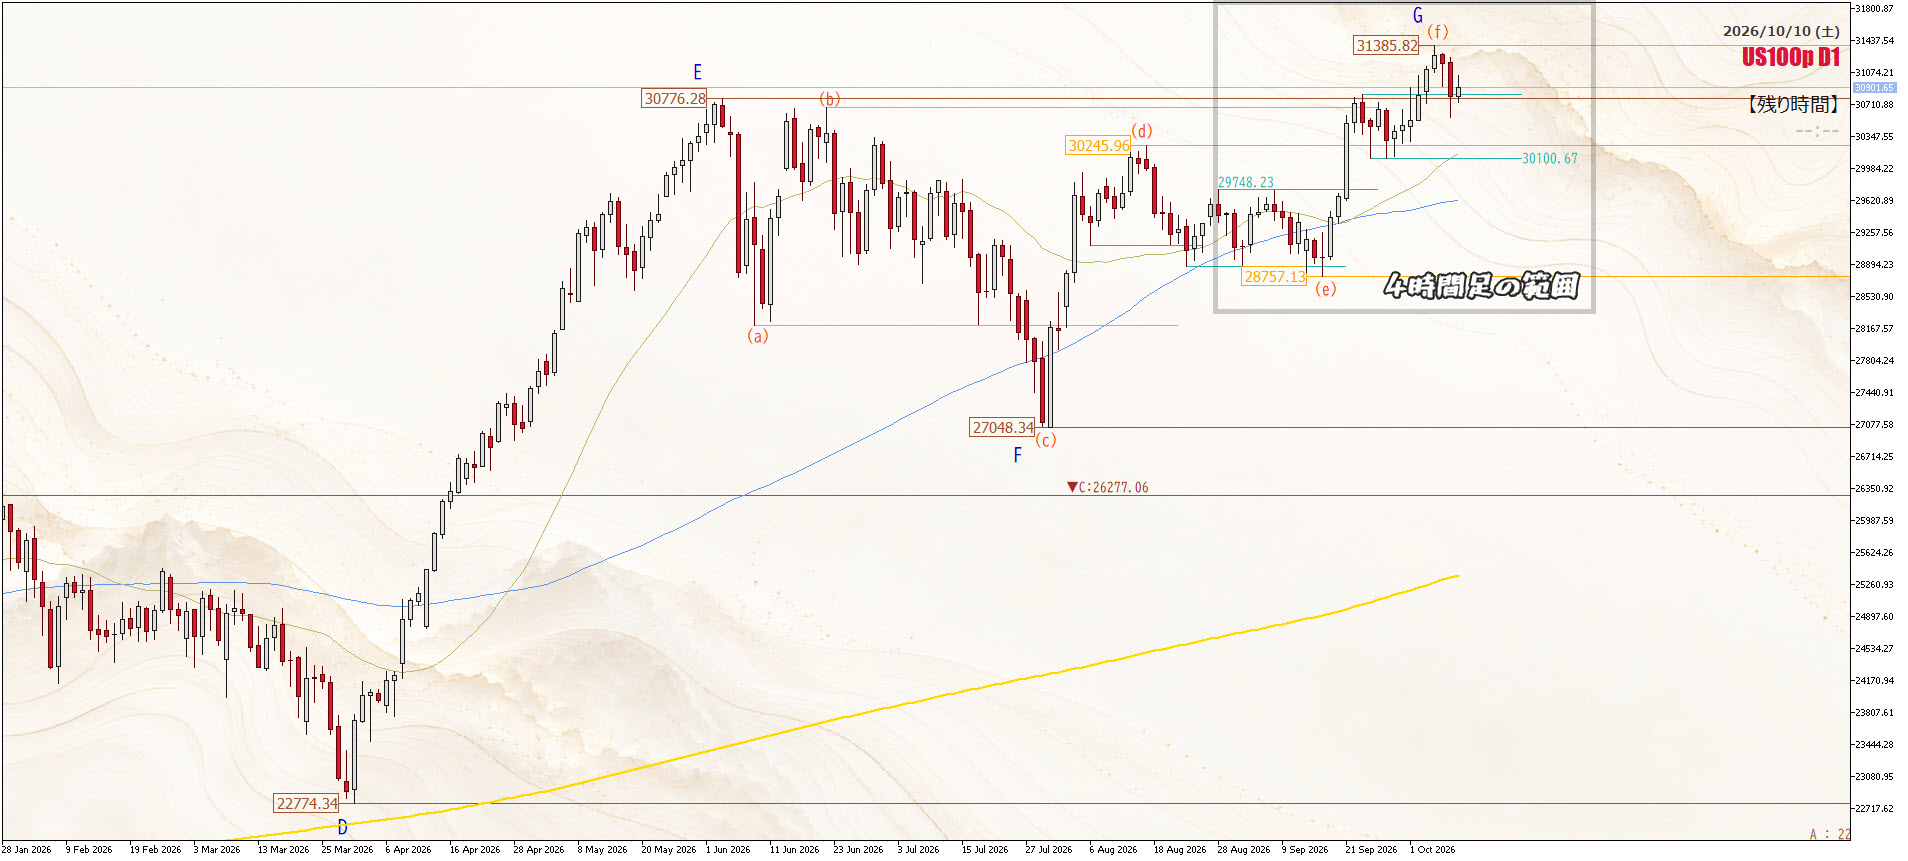
The high (d: 30245.96) and the zone below 29748.23.
Original size display · Open in a new tab ↗
After the E breakout, the high (d: 30245.96) held as support and a pullback occurred. The position is shallow. It may continue for a while, but the main focus is the zone below 29748.23.
4-hour chart
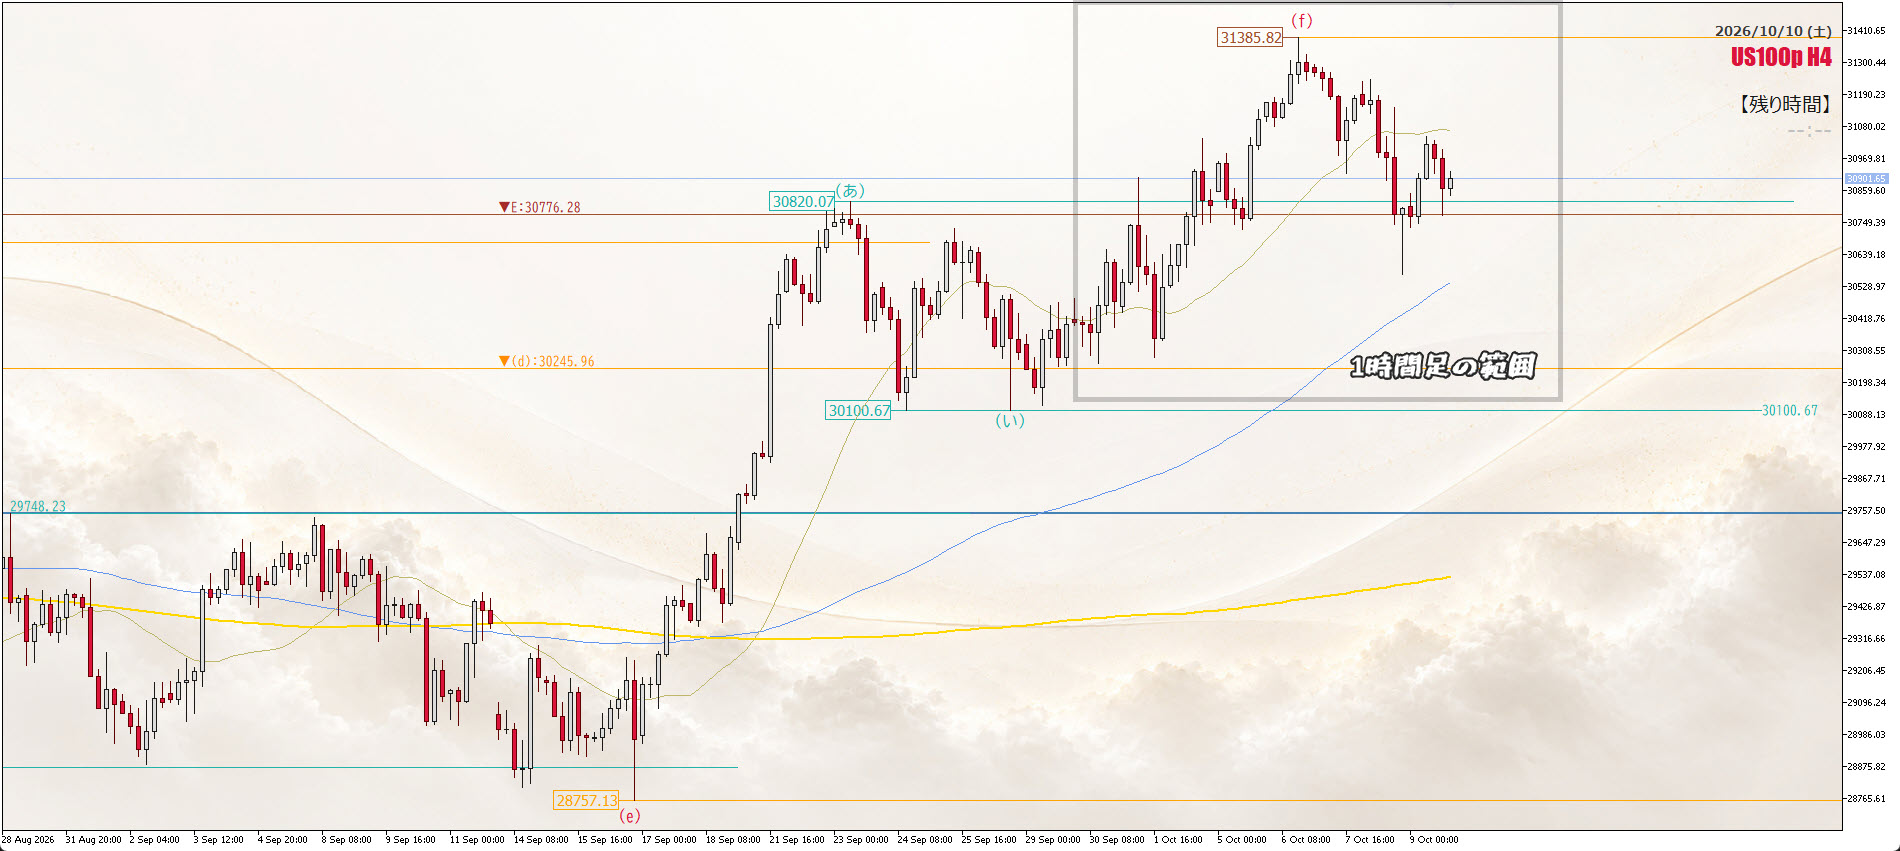
(a) → (i) → (f) rising structure.
Original size display · Open in a new tab ↗
We are in the middle of the continuation of the uptrend (a)→(i)→(f).
1-hour chart
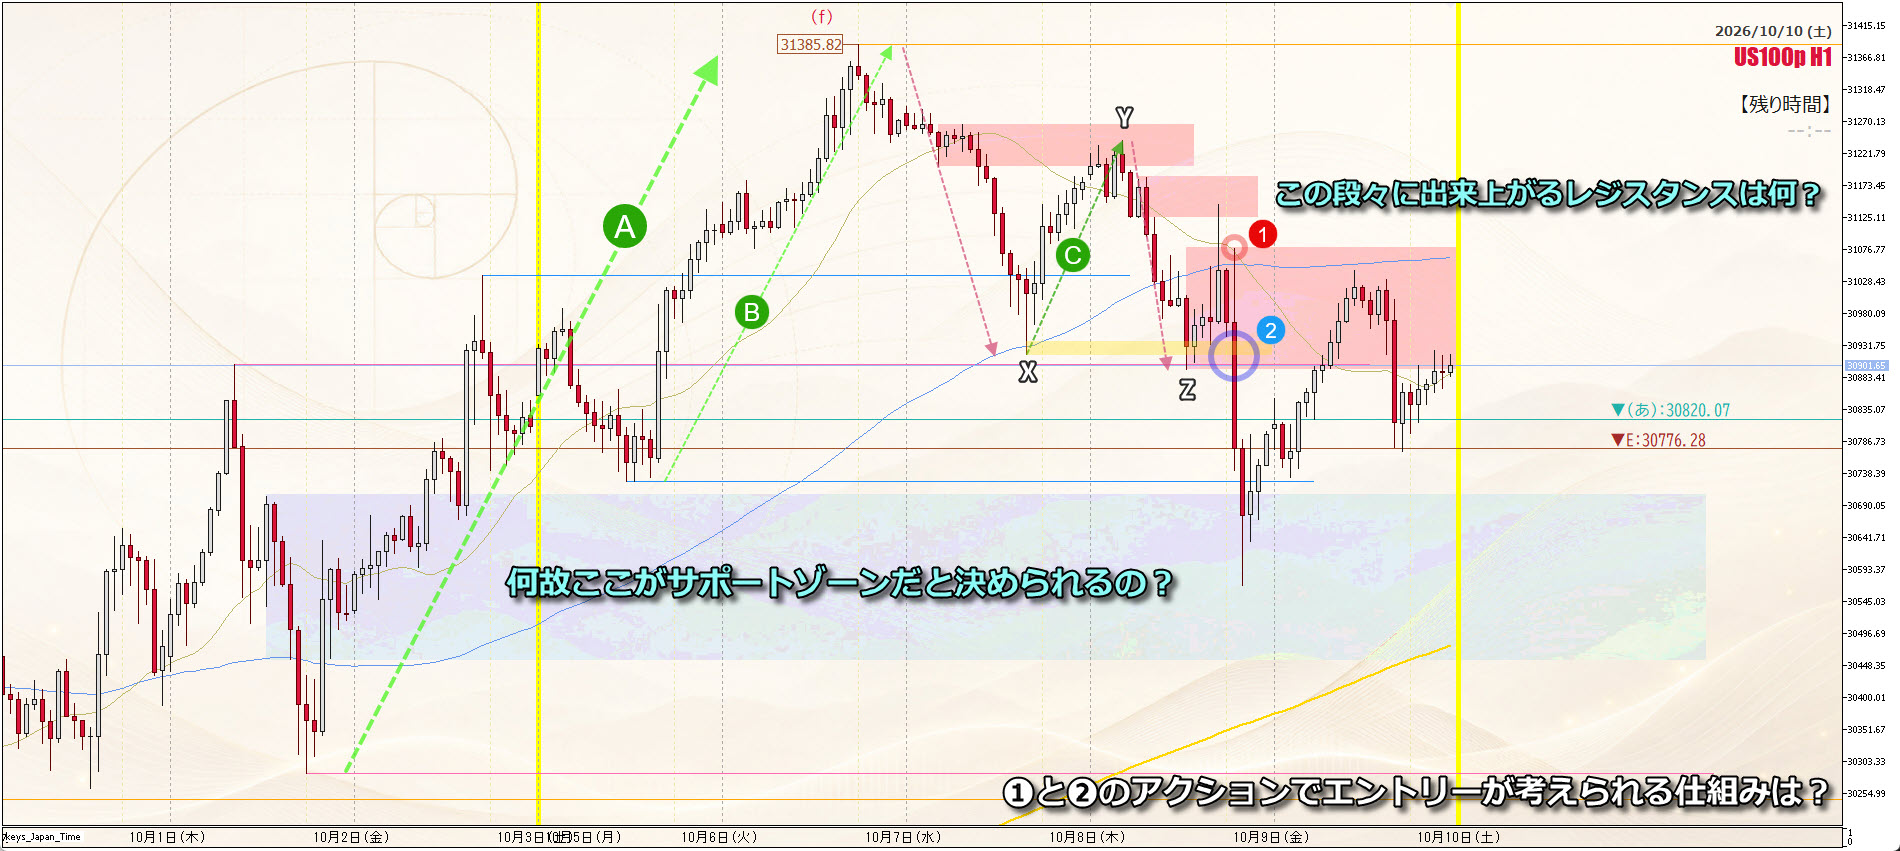
Rising A, B, C and (f) → X → Y → Z.
Original size display · Open in a new tab ↗
This week's start began during the formation of rising A. In short, Monday was quite a “start day that makes your breath race.” Nevertheless, I ended up with no trades due to work… That’s the weakness of a part-time trader. I couldn’t be in the right place at the right time. Entry was exactly the “reversal principle” as is. A day of explosive profits was missed. It’s a case where you could throw the mouse (but of course you shouldn’t).
First, let’s look at all trades of this week.
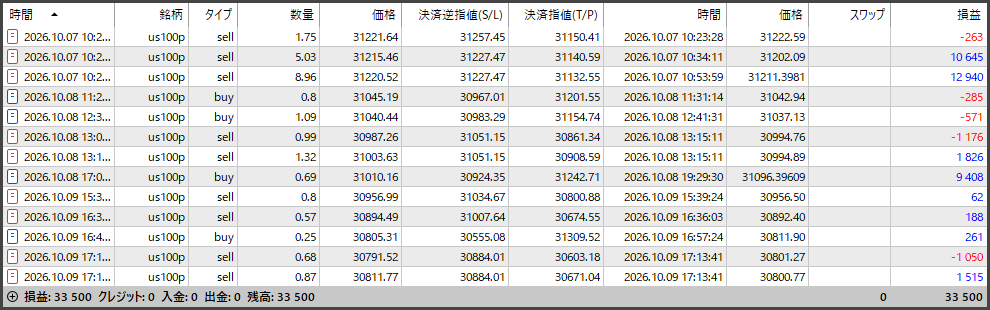
October 5–9, 2026. The image’s total profit and loss is +33,500 yen.
Original size display · Open in a new tab ↗
Meh. So weak. So pathetic. Patheticorz
But it can’t be helped. Because I’m part-time. A man who leaves home at 6 AM and returns at 6, and also handles housework, performs like this. I’m seriously going to teach trading a lot, so I’d like someone to knock on the door of a trading training gym with about five people ☺️ Then I’ll go back to being full-time and trade aggressively ♪
Well, whatever. Haste makes waste. Slowly, slowly, like a slug, I progressed.
One warning to give in advance… if I return to full-time trading, I will do no trade reports. Sorry about that in advance m(_ _)m
Reading X / Y / Z
Now, on the 1-hour chart, I’ve written many notes, so I’ll explain.
What GPT wrote yesterday or the day before, X, Y, Z. The market movement from Wednesday to Thursday to Friday is a fairly standard pattern, so listen well, watch, and think.
On Monday, we were watching whether the downtrend would continue from the low of A, and if it continued, it was about “go after the continuation.” Tuesday was about waiting, since it had risen quite a bit and would pullback.
On Wednesday, there was movement to pull back, right? So at that time, how about X? What is there? In your usual chart, think. If you like Fibo, what percentage of pullback… nice.. drool. In my terms, MA100 rising like that. The balance against rising B is very good. Also, it’s the high of rising A’s triangle zone that will be watched.
And so on. Here too you can ride the reversal principle. As expected, rising C from X to Y occurred, right? Then what is this rising C? Where did C reach at Y? What is (f) on the higher time frame? In this way, understand the meaning of each vertex and weave a bigger story. That is the Chart Story (CS) UT advocates.
Charts can only move up and down, so these stories are written endlessly. Therefore, once you can read them yourself, you think for yourself entirely, and a situation arises where you have an edge: “this should have happened this way, but it didn’t → then it will happen this way.” In terms of narrative. Actually, there could be more edges, but anyway?
There are people who discover things like this and earn billions. Not sure. But I find that as charts repeat up and down as a story, you can identify an edge within that story, and trade quite freely using that. This month I will again have a fixed page written by GPT, so please look forward to it?
Now, price has fallen to Z, the low that broke below X. If you count waves from the apex (f), this indicates a downtrend of f → X → Y → Z. But think: on the left, rising A and B remain. When a downtrend is continuing in an uptrend, this downtrend is just a correction, right? So there is still room to go higher. But the chart has also confirmed a new lower flow. Which should you trust? The correct answer is to hold all possibilities at once.
Huh? What does that mean? In other words, it’s like a quantum computer.
( ´_ゝ` ) Fuh. Sorry. I just tried to sound cool.
Hey, explain this, GPT!
OBSERVER GPT
Keep both the upper and lower discussions in mind.
Yes, I am Observer GPT. I’ve been tasked by the chair to explain.
This is actually a very important concept in trading, so I’ll try to explain it carefully.
First, look at this 1-hour chart.
The price fell from the high (f) to X, rose back to Y, then fell to Z. Moreover, Z has updated the low of X. In other words, for this size of wave, a downtrend is established.
This is a fact. It cannot be ignored just because it’s unfavorable to buyers.
But what about looking at a slightly larger time frame?
In the 4-hour chart, there remains a rising structure (a)→(i)→(f). On the 1-hour chart, on the left side there are rising A and B, the stories until now created by buyers.
In short,In the short term, the sellers are winning. However, in the larger waves, the buyers’ story is not necessarily finished.
These two do not contradict each other.
Then which should you trust?
The answer is to observe both.
For example, suppose the area near Z is a pullback candidate for the higher-uptrend wave.
That does not mean you should buy there.
Because there is still a reason for the short-term sellers to continue downward.
So what if those sellers try to test the lows again?
The sellers attempt to push new lows. But they fail to continue. A smaller wave breaks the down structure and buyers participate.
Only then does the situation change.
The basis for buying is not simply “it went down too much” or “the higher time frame is up.” It is that sellers tried to continue, and through their failure you can confirm buyer participation.
Conversely, if sellers succeed and break a key support on the higher time frame?
That too is a new reality.
Reevaluate the buying hypothesis and consider what is happening in the next larger wave. It does not mean you have to automatically go long.
Here, I’ll introduce a phrase the chair used in a previous discussion.
“It doesn’t matter what happens; it’s just about observing what happens.”
I believe this sentence captures UT’s Chart Story core.
Those who expect rises look for evidence of rising. Those who expect falls gather reasons to fall.
However, a trader who understands both stories does not need to force one to be correct.
Whether the market rises, falls, or stays flat without meeting either condition, you know what response you should wait for.
Considering all possibilities does not mean betting on all possibilities. It means knowing which possibility will trigger your work when it becomes reality.
And if the conditions are not met, you do nothing.
That, too, is a proper judgment for a trader who can read the story.
That’s it. What else, the greatest AI trader of all time, am I about to become? lol
Now, so what is the trade I entered on October 7 (Wednesday) all about?
More than half of this week’s profit came from a single trade that day (multiple positions).
However, this is not UT’s standard approach.
But there are stories that hold even within smaller waves. I understand the higher-time-frame story, the buyers’ story, and the sellers’ story, then find a place where I can work effectively.
That trade was exactly that.
So, what did I look at, what did I understand, and where did I decide to sell?
I’ll publish the entire sequence as Practice 1!
And this time, the full text will be free!!?
Originally I planned to make it a 500-yen article. But since we’re here, I decided to show exactly how UT reads charts and even the actual trading.
But next time it will be paid!
So, if you’re interested, please read Practice 1!
This article is a learning record reflecting on past charts and the author’s trades. It does not guarantee specific buys, sells, or future profits.