
Tokyo Stock Exchange Prime Macro & Sector Weekly: October Week 2, we will also list future stock candidates
TSE Prime Macro & Industry Weekly
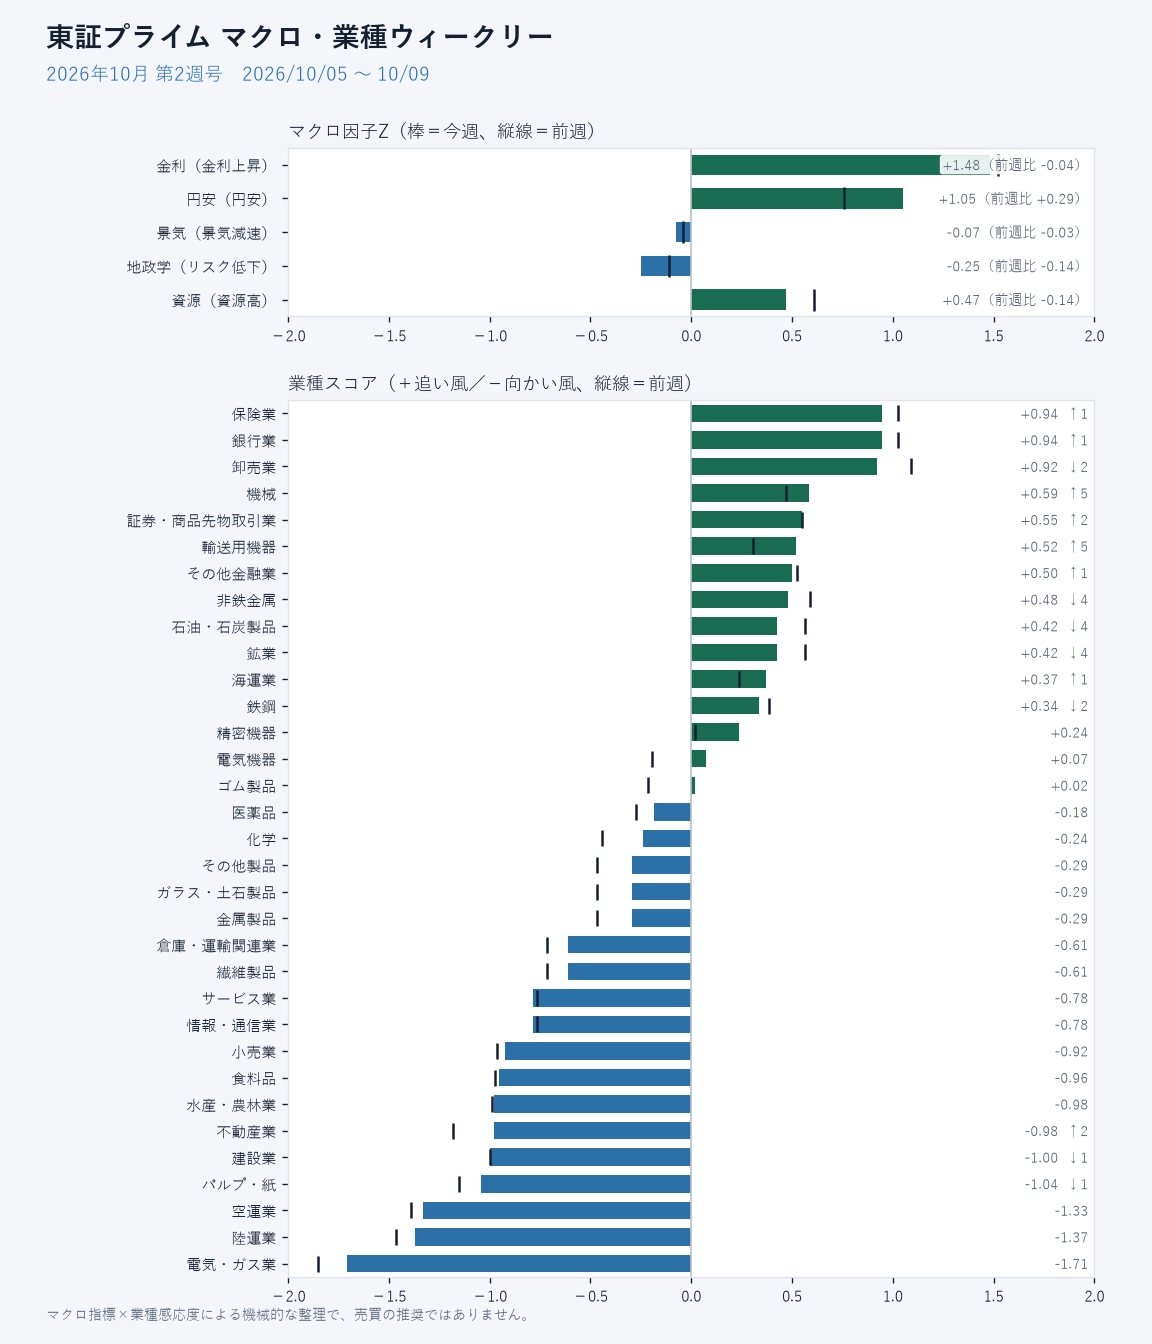
Macro Factors This WeekAs of October 9
+ Meaning: Interest rates rising / Yen weakness / Economic expansion / Geopolitical risk rising / Resources price up. 0 equals the 1-year average.
※ Some factors changed from the previous issue (Economic Activity -0.16 → -0.04). After the previous issue was compiled, late-released indicators (monthly indicators or U.S. indicators released 1–2 business days later) were included, so the previous week's values were recalculated. The week-over-week change and the ranking of industries relative to the previous week are also calculated against the revised values.
This Week’s Summary
The factor that moved the most this week wasYen Weaknessrising from +0.76 to +1.05 (+0.29), indicating a stronger yen depreciation trend.
Interest rates and economic activity changed little from last week (changes under 0.10).
The large levels are Interest Rates +1.48 (rise) and Yen Weakness +1.05 (weaker yen).
Top five industry scores areInsurance, Banking, Wholesale; bottom five are Electric Utilities, Gas Utilities, and Transportation (Rail & Airlines).
Industries that moved more than three ranks: Machinery 9th → 4th (primarily due to yen weakness), Transportation Equipment 11th → 6th (primarily due to yen weakness), Nonferrous Metals 4th → 8th (primarily due to yen weakness), Petroleum & Coal Products 5th → 9th (primarily due to yen weakness), Mining 5th → 9th (primarily due to yen weakness).
In daily series, there were no movements exceeding the usual 1-week range (1σ or more).
Industry Score Rankings33 Industries
| Rank | Industry | Number of Stocks | Score | −2 0 +2 | Previous Week | Change | Main Factors |
|---|---|---|---|---|---|---|---|
| 1 | Insurance | 11 | +0.94 | 2nd | ↑1 | Geopolitics ↑ | |
| 1 | Banking | 69 | +0.94 | 2nd | ↑1 | Geopolitics ↑ | |
| 3 | Wholesale | 120 | +0.92 | 1st | ↓2 | Yen Weakness ↑ | |
| 4 | Machinery | 111 | +0.59 | 9th | ↑5 | Yen Weakness ↑ | |
| 5 | Securities & Commodities | 19 | +0.55 | 7th | ↑2 | Geopolitics ↑ | |
| 6 | Transportation Equipment | 38 | +0.52 | 11th | ↑5 | Yen Weakness ↑ | |
| 7 | Other Financials | 21 | +0.50 | 8th | ↑1 | Geopolitics ↑ | |
| 8 | Nonferrous Metals | 20 | +0.48 | 4th | ↓4 | Yen Weakness ↑ | |
| 9 | Petroleum & Coal Products | 5 | +0.42 | 5th | ↓4 | Yen Weakness ↑ | |
| 9 | Mining | 4 | +0.42 | 5th | ↓4 | Yen Weakness ↑ | |
| 11 | Shipping | 5 | +0.37 | 12th | ↑1 | Yen Weakness ↑ | |
| 12 | Steel | 20 | +0.34 | 10th | ↓2 | Yen Weakness ↑ | |
| 13 | Precision Instruments | 27 | +0.24 | 13th | → | Yen Weakness ↑ | |
| 14 | Electrical Equipment | 123 | +0.07 | 14th | → | Yen Weakness ↑ | |
| 15 | Rubber Products | 10 | +0.02 | 15th | → | Yen Weakness ↑ | |
| 16 | Pharmaceuticals | 31 | -0.18 | 16th | → | Yen Weakness ↑ | |
| 17 | Chemicals | 115 | -0.24 | 17th | → | Yen Weakness ↑ | |
| 18 | Other Products | 37 | -0.29 | 18th | → | Yen Weakness ↑ | |
| 18 | Glass & Stone | 22 | -0.29 | 18th | → | Yen Weakness ↑ | |
| 18 | Metal Products | 26 | -0.29 | 18th | → | Yen Weakness ↑ | |
| 21 | Warehousing & Transport Related | 9 | -0.61 | 21st | → | Resources ↑ | |
| 21 | Textiles | 17 | -0.61 | 21st | → | Resources ↑ | |
| 23 | Services | 143 | -0.78 | 23rd | → | Yen Weakness ↓ | |
| 23 | Information & Communications | 164 | -0.78 | 23rd | → | Yen Weakness ↓ | |
| 25 | Retail | 129 | -0.92 | 25th | → | Yen Weakness ↓ | |
| 26 | Food & Beverages | 68 | -0.96 | 26th | → | Yen Weakness ↓ | |
| 27 | Fishery & Agriculture | 6 | -0.98 | 27th | → | Yen Weakness ↓ | |
| 28 | Real Estate | 48 | -0.98 | 30th | ↑2 | Geopolitics ↑ | |
| 29 | Construction | 70 | -1.00 | 28th | ↓1 | Yen Weakness ↓ | |
| 30 | Pulp & Paper | 10 | -1.04 | 29th | ↓1 | Yen Weakness ↓ | |
| 31 | Air Transport | 2 | -1.33 | 31st | → | Yen Weakness ↓ | |
| 32 | Land Transport | 36 | -1.37 | 32nd | → | Yen Weakness ↓ | |
| 33 | Electric & Gas Utilities | 22 | -1.71 | 33rd | → | Yen Weakness ↓ |
Scores range from −2 to +2. A plus means a favorable condition in the current market; minus indicates headwinds. The number of stocks indicates the number of Prime stocks in that industry. Top 5 and bottom 5 are highlighted. Up arrows in main factors indicate an increased tailwind; down arrows indicate a decrease.
Series with Movements This WeekDaily figures, ranked by magnitude of change
| Series | Value | Weekly Change | Compared to Normal | Effective Factors | Date of Value |
|---|---|---|---|---|---|
| U.S. 10-year Real Rate (TIPS) | 2.87 | -0.05 pt | -0.7σ | Interest Rate − | 10/08 |
| U.S. High-Yield Spread | 3.15 | +0.05pt | +0.4σ | Economy − | 10/08 |
| U.S. Yield Curve (10y-2y) | 0.44 | -0.01pt | -0.2σ | Interest Rate − | 10/09 |
| VIX | 14.84 | -3.07% | -0.2σ | Geopolitics − | 10/09 |
| USD/JPY | 158.25 | +0.20% | +0.2σ | Yen Weakness + | 10/09 |
| WTI Crude Oil | 91.66 | +0.60% | +0.1σ | Resources + | 10/09 |
Compared to normal means how many times the week’s change differs from the usual one-week change over the past year. Changes exceeding ±1σ are bolded. For interest rates and spreads, changes are shown as absolute point differences (pt). U.S. series are dated to reflect release lags of 1–2 business days.
Monthly SeriesMost recent published values
| Series | Value | MoM Change | Effective Factors | Target Month |
|---|---|---|---|---|
| Japan Long-Term Rate (10-year) | 2.94 | +0.15 | Interest Rate + | Aug 2026 |
| Real Effective Exchange Rate (BIS) | 65.04 | -0.38 | Yen Strengthening + | Jul 2026 |
| OECD Composite Leading Indicator - Japan | 100.35 | +0.02 | Economy + | Sep 2026 |
| OECD Composite Leading Indicator - U.S. | 100.96 | +0.06 | Economy + | Aug 2026 |
| OECD Composite Leading Indicator - China | 97.41 | -0.23 | Economy − | Sep 2026 |
| U.S. Industrial Production (YoY) | 1.42 | +0.29 | Economy + | Aug 2026 |
| Geopolitical Risk Index (GPR) | 146.21 | +20.59 | Geopolitics + | Sep 2026 |
| Copper (LME) | 13,542.82 | -9.22 | Resources − | Jul 2026 |
| U.S. CPI (YoY) | 3.35 | +0.05 | Resources + | Aug 2026 |
Monthly series take 1–3 months to publish. Weekly factor movements mainly derive from the daily series.
Factor TransitionsLast 6 weeks, each Friday
| Factor | 09/04 | 09/11 | 09/18 | 09/25 | 10/02 | 10/09 |
|---|---|---|---|---|---|---|
| Interest Rate | +0.65 | +0.69 | +0.63 | +1.15 | +1.52 | +1.48 |
| Yen Weakness | +0.22 | -0.07 | +0.24 | +0.64 | +0.76 | +1.05 |
| Economic Activity | +0.44 | +0.45 | +0.43 | +0.10 | -0.04 | -0.07 |
| Geopolitics | -0.24 | -0.02 | -0.22 | -0.17 | -0.11 | -0.25 |
| Resources | +0.85 | +0.99 | +0.94 | +0.73 | +0.61 | +0.47 |