

Prices search for orders [Traders' common sense]
【FX・GOLDトレードの本質解剖】
“Prices go looking for orders”: The fundamental principle of the market that escapes chicken take-profit and expands 200% price range, and liquidity (liquidity)攻略法
Have you ever had the experience of your entry going as planned and profits starting to rise smoothly, only to see one bearish candle appear and feel the urge to exit before the gains disappear?
“What if it returns to cost?” “I should take profit now,” you might have pressed the close button within a few tens of pips, only for the chart to surge in the direction you had originally targeted by 100 pips or 200 pips with furious momentum…
On the other hand, in a stop-loss scenario, you stubbornly cling to the belief that “it will come back someday” without basis, and a single loss wipes out several prior profits. This classic“small profit, big loss (dollar-cost averaging into a plunge)”loop traps you, and no matter how high your win rate, your total net becomes negative.
Why do many traders chicken out along the way? The root cause is not a matter of mentality or guts, but a failure to understand the market’s most important principle“Prices search for orders (liquidity)”that underpins the mechanism.
Table of Contents
- 1. The true form of chicken take-profit is not “weak mental” but “absence of destination”
- 2. The essence of the market: What does “Prices search for orders (liquidity)” mean?
- 3. The true nature of the liquidity pool that big players target
- 4. 【Practical Technical】 Visualizing the destination where orders gather on the chart
- 5. 【Practical Application】 Concrete trading strategies to eliminate chicken take-profit
- 6. Summary — When the destination is visible, fear of the market disappears
1. The true form of chicken take-profit is not “weak mental” but “absence of destination”
When you cannot extend profits in trading, many traders fall back on psychology like “my mental strength is weak” or “I must improve my grip (holding power).” However, no matter how much you train your mind, chicken take-profit will not be cured unless you address the structural problem.
As behavioral economics’ “prospect theory” proves, humans instinctively feel: when in profit, we want to lock it in immediately to avoid pain; when incurring losses, we want to recover principal even at the cost of ignoring probabilities. If you trade by emotion, you inevitably converge to “small profits, big losses.”
? The real reason you bail out midway
The real reason you cannot extend take-profit is not a lack of courage, but that you cannot see the objective (destination) as an objective numerical value
“where the market is aiming (destination)”clearly.
If you run in the dark without knowing the destination, you will fear and stall at even a small adverse move. Conversely, if you clearly know the destination, you can hold your position through noise and temporary retracements until you reach it.
2. The essence of the market: “Prices search for orders (liquidity)” — what does it mean?
So, how is the destination determined in the market?
If you drill down into the mechanism that drives chart price movements, you reach one absolute fact:“Prices search for thick orders (liquidity)”This is a principle as if a physical law.
What governs FX and Gold markets are not retail investors but big players like institutions, hedge funds, and central banks moving hundreds of billions.
For them to enter or close huge positions, there must exist opposing orders of equivalent scale in the same price range.
| Actions of big investors | The nature of opposing orders required |
|---|---|
| Close hedge positions (profit-taking) for longs | A large amount of“sell orders”(crowd’s stop-loss selling, new sell limit orders, etc.) |
| Close hedge positions (profit-taking) for shorts | A large amount of“buy orders”(crowd’s stop-loss buying, new buy limit orders, etc.) |
If a massive amount is liquidated in a price zone with very little liquidity, the price can slide and you incur disadvantage due to your own orders. Therefore, big players intentionally push prices into zones where orders from traders all over the world accumulate (a zone dense with stops and limit orders) and place their orders there to offset and execute them.
3. The true nature of the “Liquidity Pool” that big players target
The area where orders cluster, which big players target for settlement or setups, is called the “Liquidity Pool” in Smarts Money Concepts (SMC) and ICT theory.
Where on the chart liquidity tends to accumulate are mainly three points.
【Three major zones where liquidity concentrates】
① Outside the most recent highs and lows (EQH / EQL)
Above obvious highs there are大量 with buy stop losses (short sellers’ losses), and below lows there are大量 with sell stop losses (longs’ losses).
② Stop orders aiming for breakout
Beginner and crowd traders’ “new follow-through orders” cluster at the moment of breaking out of ranges or key levels.
③ The calculated width of technical indicators (Fibonacci extension targets)
Specific price ranges like 161.8% and 200.0% that algorithms and pro traders commonly set as take-profit targets.
Big players target these zones, drawing the crowd’s stops into them and causing rapid price movements (the so-called “stop-hunt”).
If you have ever experienced a price reversing right after your stop is hit, that moment is when you became a liquidity provider (sucker) for big players. However, from a different perspective, you can understand that “the destination of this liquidity is the true goal the market aims for.”
4. 【Practical Technical】A technique to visualize the destination where orders gather on the chart
So, how can you objectively perceive on the trading screen the destination where prices will search for orders? Here are three concrete approaches explained.
Approach 1: Arithmetic calculation of N-wave (ABC wave)
Markets do not move in a straight line but in waves. Once the starting point (A), pullback high (B), and propulsion starting point (C) are confirmed, the width between A-B is used to calculate the next propulsion energy via the “N expansion value.”
- 100% (N width): The basic target extending the A-B width from point C.
- 161.8% (FE expansion): A standard liquidity accumulation zone when the trend is strongly advancing.
- 200.0% (double N width): Final objective where climax energy is released and many take-profit orders intersect.
Approach 2: Automatic wave detection by AI/algorithms
Manual Fibonacci drawing introduces trader subjectivity (which wick to use), reducing reproducibility.
Solving this is AI-based algorithm analysis. AI detects wave formation patterns and expansions automatically, and when paired with a confidence score (e.g., AI SCORE 85+), draws target lines of “161.8%” and “200.0%” on the chart so anyone can consistently identify the shared destination.
【Illustration of liquidity targets visualized on the chart】
※ Prices, while including noise along the way, move toward the thickest-laden “200.0%” as if drawn by a magnet.
5. 【Practical Application】 Concrete trading strategies to eliminate chicken take-profit
Let’s translate the theory “Prices search for orders” into practical actions you can use in tomorrow’s trades. The three steps are:
At entry, mechanically place the TP take-profit target at the 200% line
When you enter, you tend to watch the chart and manually take profit, letting emotions intervene. At the moment of entry, set the take-profit target—where big players aim (161.8% or 200%)—in advance.
Fix the risk-reward ratio (RR) at least 1:2
Only place orders when the potential reward from entry to destination is at least twice the risk (about 1:2 to 1:3.5). If the destination is clear, you naturally avoid entries at unfavorable prices.
Use partial exits (trail) to create a mental safety valve
If you are uneasy about holding all positions to the end, secure half at 100%–161.8% and move the remaining cost basis to “SL = equal value,” trailing to the final 200% line. This allows aiming for the maximum range with no risk.
6. Summary — When the destination is visible, fear of the market disappears completely
In FX and GOLD trading, stop relying on emotional or gut-based approaches to face the market any longer.
What you need to win is not meaningless mental strengthening, but understanding the universal principle that “Prices search for orders (liquidity)” and correctly drawing the destination on the chart.
- The root cause of chicken take-profit is not lack of guts but absence of destination.
- Big players move prices toward areas where crowd orders accumulate to settle their enormous positions.
- If you can visualize liquidity targets such as “161.8%” and “200%” via AI or mathematical calculations, you won’t be swayed by noise along the way.
From the “darkness where it’s unclear how far it will extend” to “a world where big players’ goals are visible in advance.” A simple change in perspective can dramatically improve your trading results and mental state.
The method to build a trading environment where the destination is visible and exclusive know-how are available
can be checked now below
Long-awaited next-generation environment: AI WAVE MT5 version finally released
The MT4 logic remains the same, and the MT5 (MQL5) version, which greatly enhances “visualization of entry rationale” and “exceptional operability,” is now officially available.
“I don’t know when the next wave detection will come”
“Open multiple charts and it becomes hard to see everything”
These small stresses and concerns in trading are all resolved by MT5’s advanced, proprietary features.
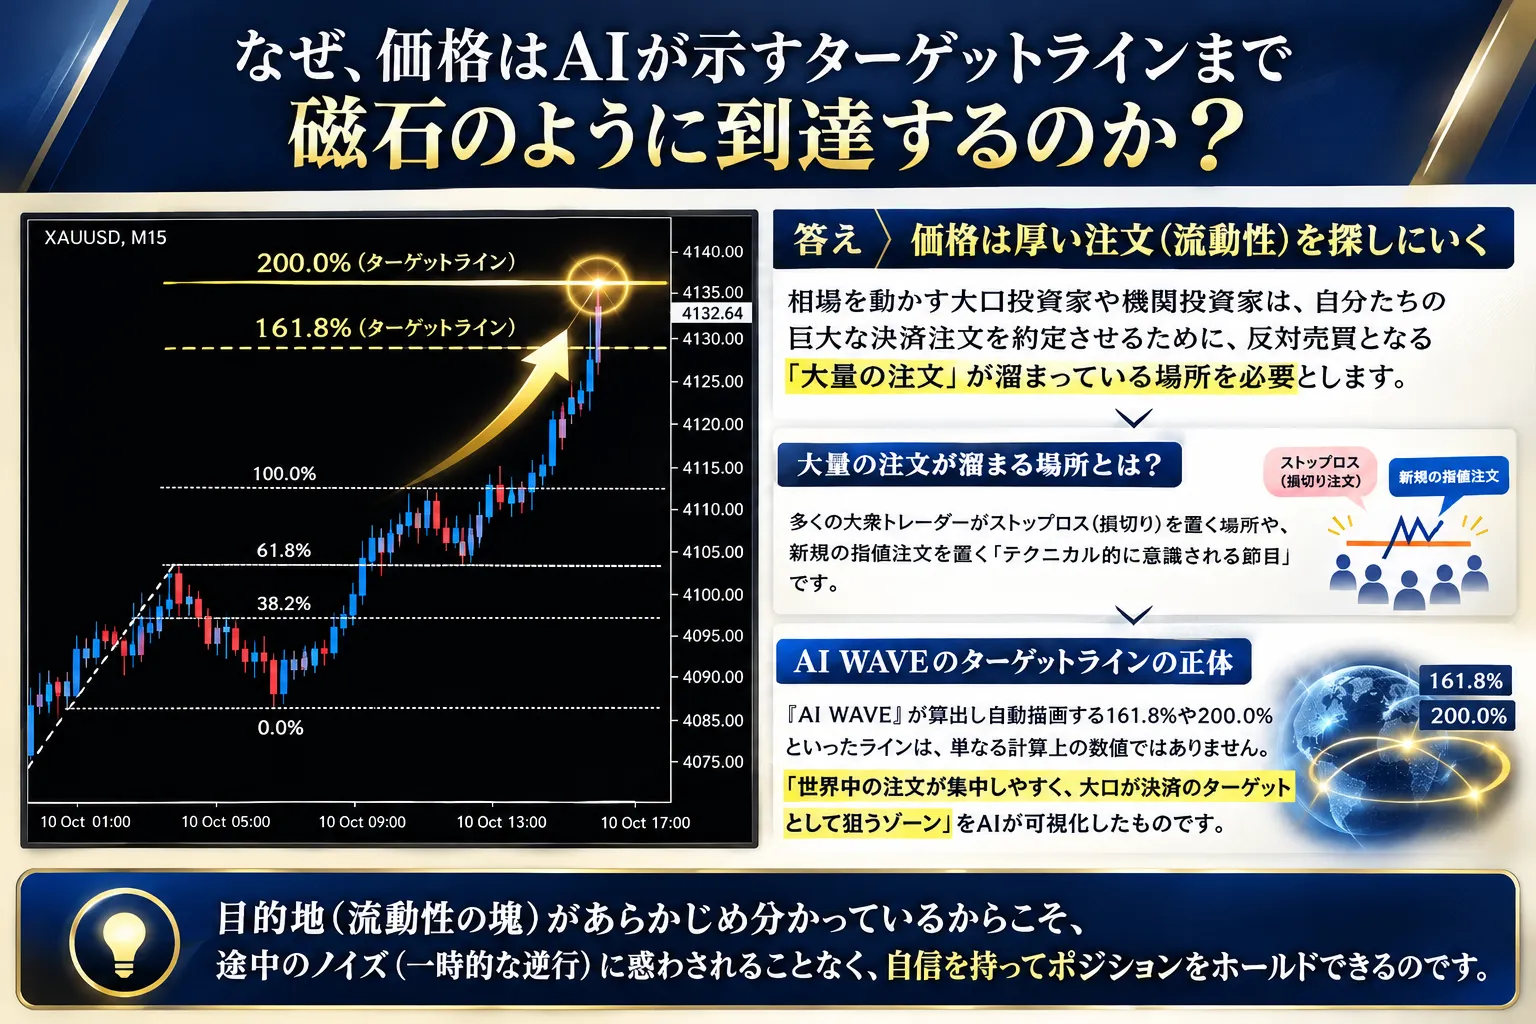
Why does the AI-indicated target width (target line) attract price as if by a magnet?
The answer lies in the market’s fundamental tendencies.
That is,“Prices search for thick orders (liquidity)”as a fact.
Big players and institutions with massive funds require places where a huge opposing batch of orders accumulates to execute their large settlement orders.
Where is that? It is the technical levels where many crowd traders place stops or new limit orders—stops and key levels that are psychologically significant.
The lines such as 161.8% and 200.0% calculated and drawn by AI WAVE are not mere numbers; they visualize “zones where orders are likely to concentrate,” which are targets for big players. Because the destination (the liquidity cluster) is known in advance, you can hold positions with confidence through intermediate noise without being misled.
MT5-only add-ons
The MT4 logic and settings are carried over.
In MT5 (MQL5), visualization of entry rationale and the flexibility of panel arrangement have been added.
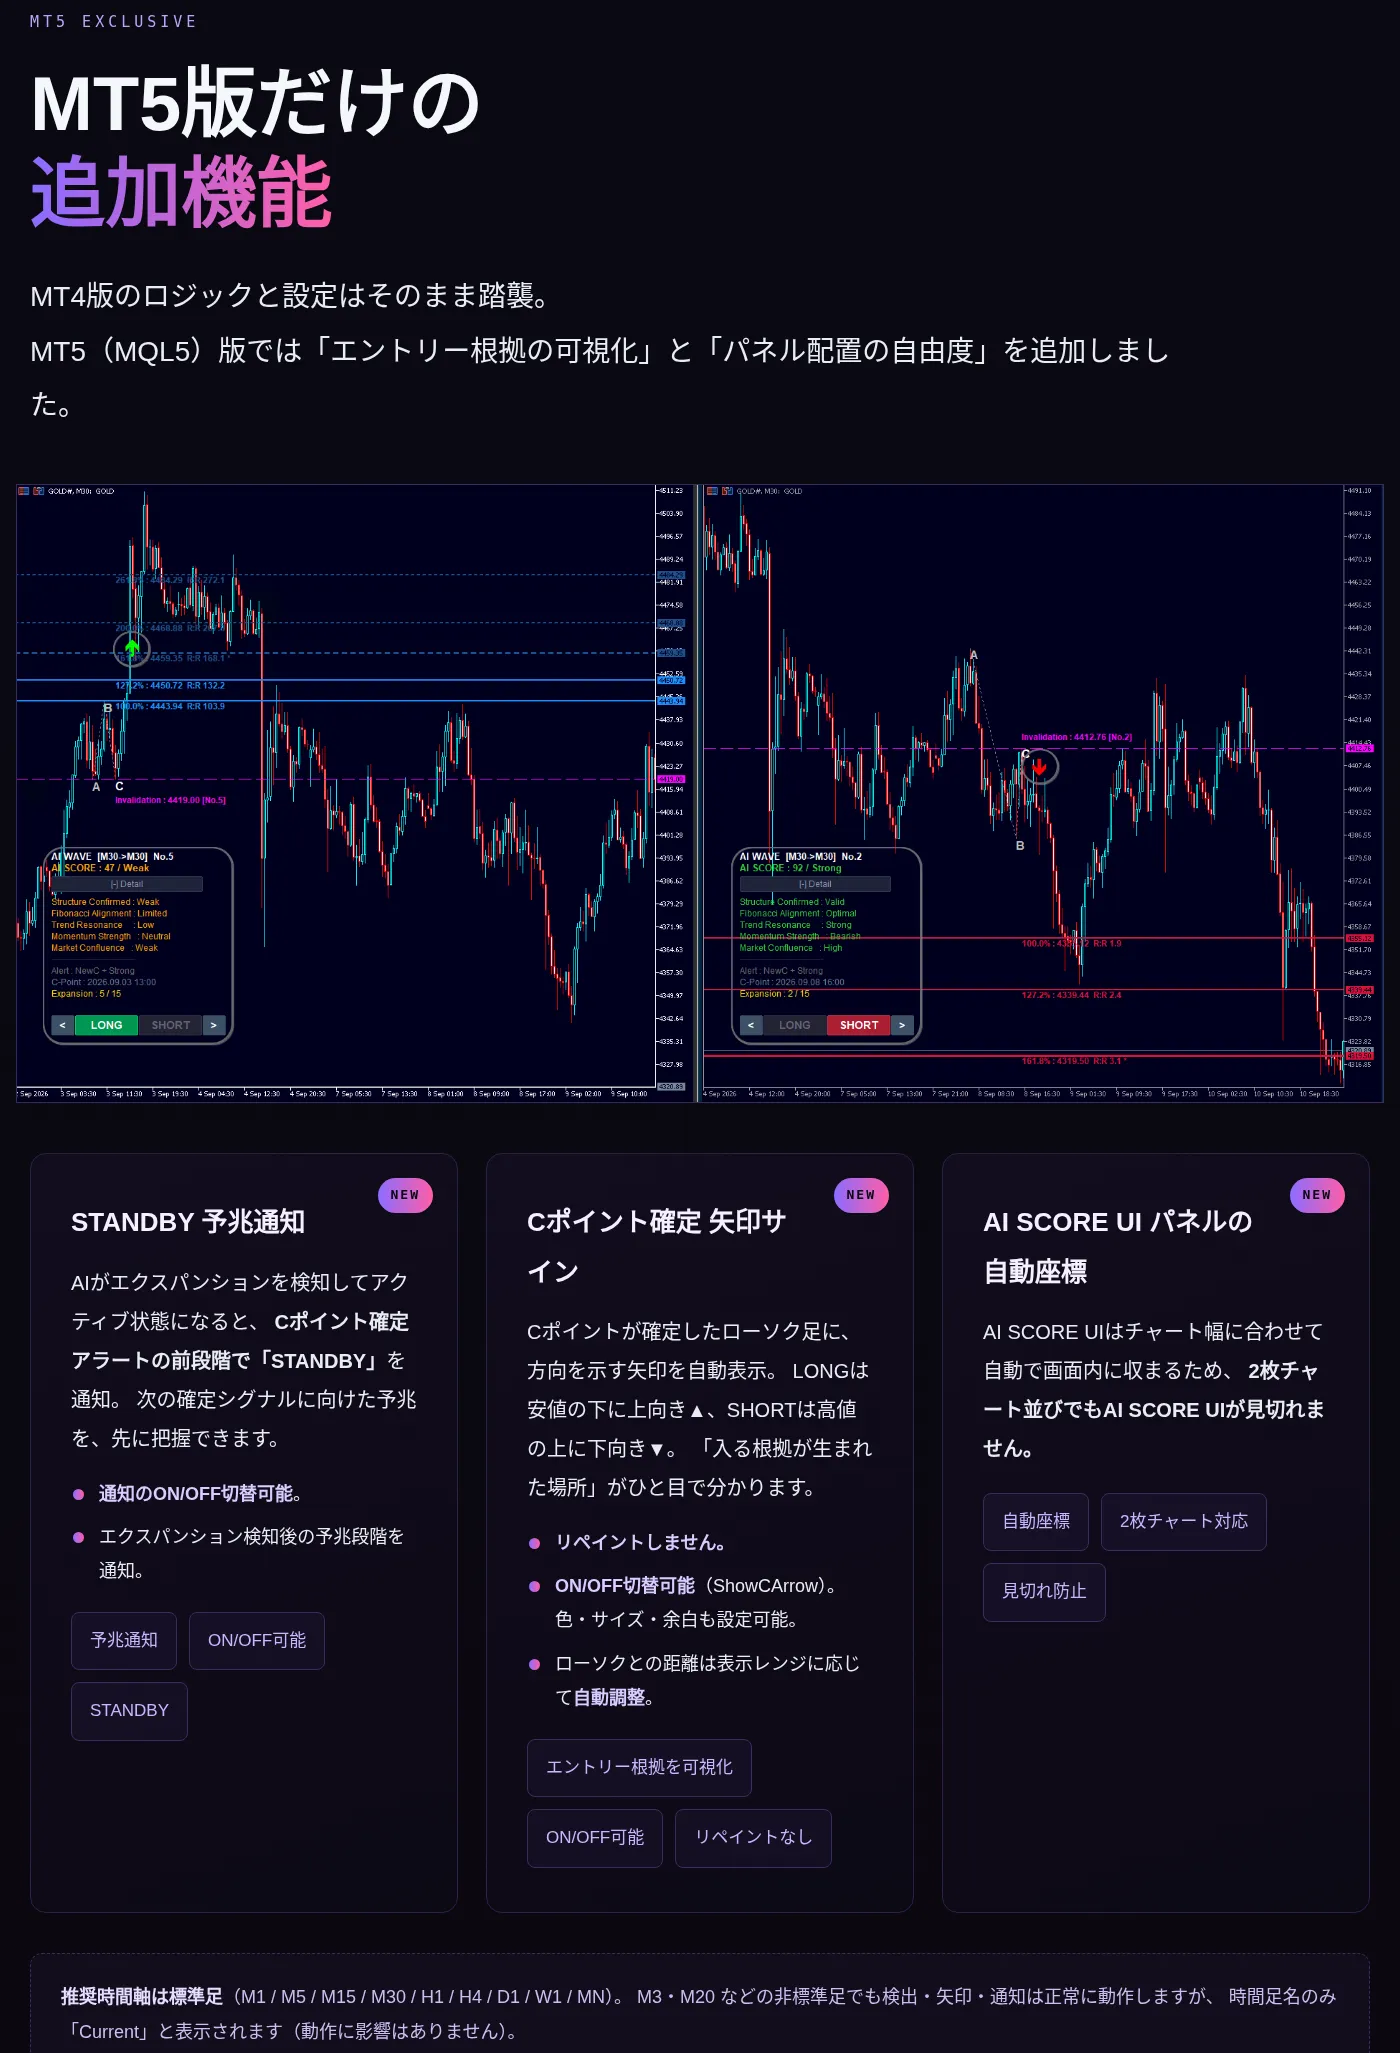
STANDBY Prelude Notification
When AI detects expansion and becomes active, a “STANDBY” alert precedes the confirmed C-point, allowing you to anticipate the next confirmation signal in advance.
・Notification can be turned ON/OFF.
・Notifies the pre-activation stage after expansion detection.
C-point confirmation Arrow Sign
When a candle confirms C-point, an arrow indicating the direction is automatically displayed [LONG is ▲ below the low, SHORT is ▼ above the high. The place where the rationale to enter was formed is visible at a glance.
・No retiming (no repaint).
・ON/OFF switchable (ShowCArrow). Colors, size, and margins are configurable.
・Distance to the candle automatically adjusts according to the display range.
AI SCORE UI panel auto coordinates
AI SCORE UI automatically fits within the chart width, so it won’t be cut off even on two-chart layouts.
Recommended timeframes are standard bars (M1/M5/M15/M30/H1/H4/D1/W1/MN). Non-standard bars like M3 or M20 can still detect, draw arrows, and send notifications, but only the time frame name will show as “Current” (no impact on operation).
Please choose according to your trading environment
“AI WAVE” MT5 version
A full feature set including prediction notifications, arrow signals, and automatic coordinates unique to MT5.
Details and purchase for MT5 version“AI WAVE” MT4 version
A solid baseline model with its own AI wave detection and expansion visualization logic, delivering proven results.
Details and purchase for MT4 versionDisclaimer
The verification results and figures published in this article are reference information based on historical market data and do not guarantee future profits or similar performance.
The pips and profit/loss data shown are based on the maximum move (MAX) reached after the entry signal occurs and calculated with a fixed stop loss (SL). These are the maximum moves if you fully hold after the signal, and do not necessarily reflect actual realized profits or trades.
Actual profit and loss depend on entry and exit timing, spreads, slippage, trading costs, execution environment, position size, take-profit/stop-loss decisions, and market conditions. Also, stop-loss judgments are based on the 4-hour chart, and results may vary under actual operating conditions.
Additionally, due to differences in trading conditions and price feeds, actual prices, pips, profits, and execution results may vary depending on the broker/exchange and trading platform used. Therefore, there may be discrepancies between published data and actual operating results.
This data is reference material to validate the AI WAVE market analysis accuracy. Final investment/trading decisions should be made by yourself, considering your capital, risk tolerance, and trading environment.