
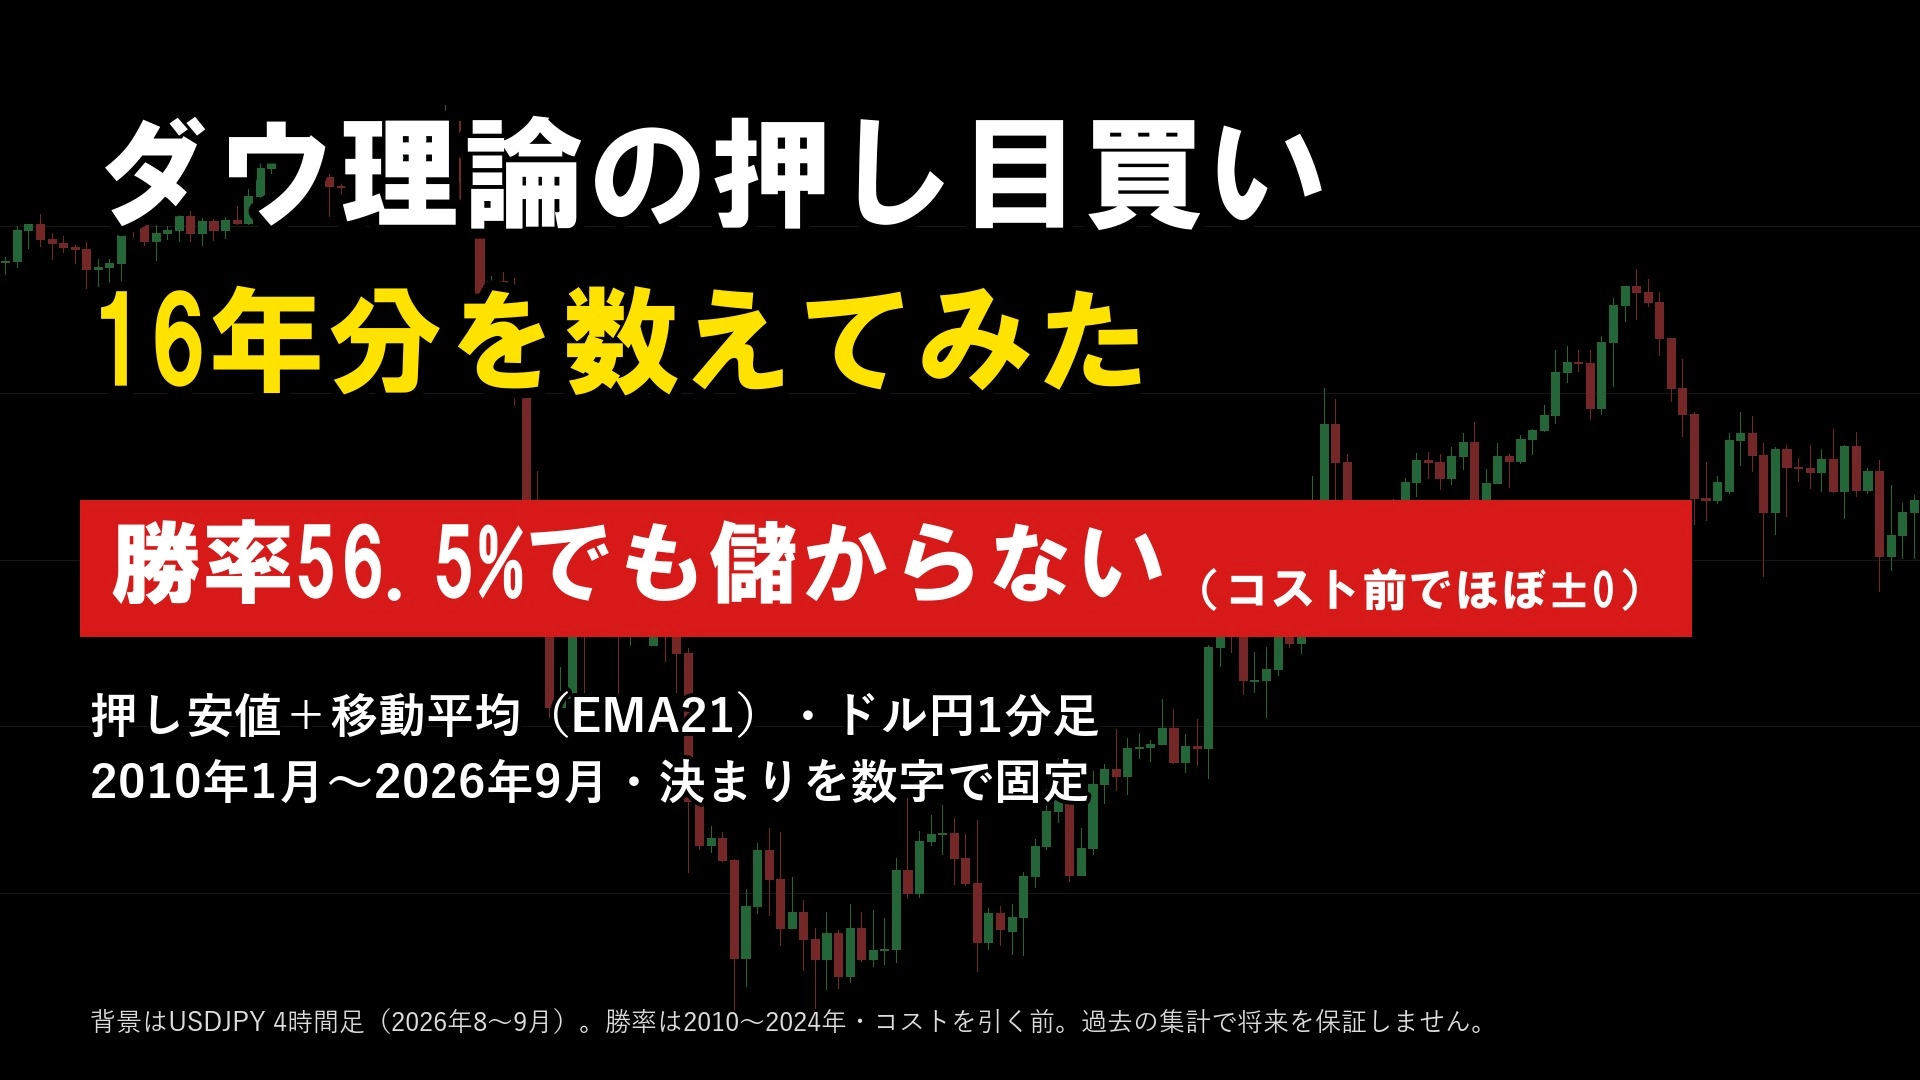
Is a Dow Theory buy on dips profitable? Even with a winning rate of 56.5% by counting the dip lows plus moving average rules over 16 years of USD/JPY data, it didn’t yield profit
Dow Theory’s pullback buying is the idea of determining the direction on a higher time frame and buying on a lower time frame when the price has pulled down to the pullback low. It is a concept often introduced in FX books and videos. However, where exactly to regard as the pullback low and where to say it has been “supported” varies between people. Therefore, this time, referencing commonly shown patterns, we decided all the rules numerically and counted mechanically using 1 minute USD/JPY data for 16 years and 9 months (January 2010 to September 2026). We counted seven variants with different entry bars and take-profit placements using the same yardstick, and the results are shown in the following table.
I am the “Validation Sommelier” who sells indicators and e-books (EA is under review).
First, the conclusion
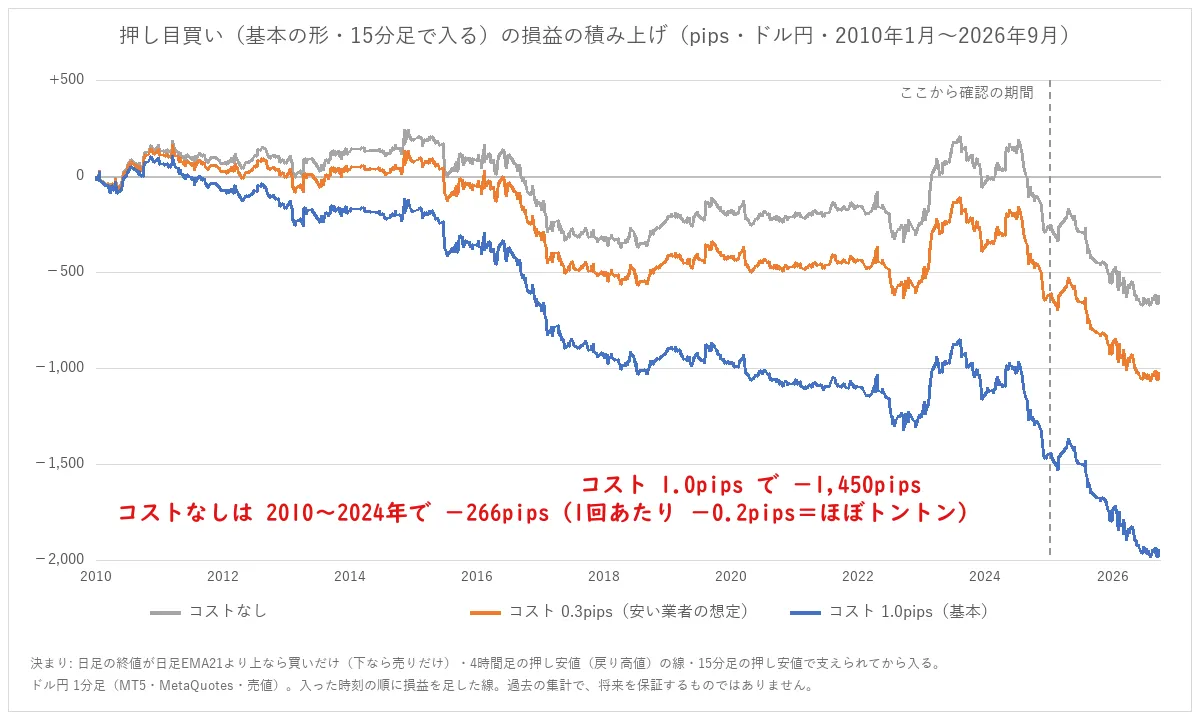
・The basic pattern (determine the direction on the daily chart, and enter on the 15-minute chart only while there is a pullback low on the 4-hour chart) occurred 1,184 times from 2010 to 2024, before costs: essentially even (win rate 56.5%・PF 0.97・t-value −0.4). After subtracting a cost of 1.0 pips per round trip (the spread and other costs from entry to exit), it showed a loss (PF 0.82・t-value −2.4). PF = total wins ÷ total losses; less than 1 indicates a loss. The t-value indicates how much of the result is likely due to chance (explained at the end of the “rules”).
・The win rate exceeds 50%, but the average win is smaller than the average loss, so 56.5% is almost the break-even win rate (the reason is counted in the continuation).
・In confirmation from January 2025 to September 2026, with a cost of 1.0 pips, PF was 0.62 (even before costs 0.71・139 trades).
・Even if changing the entry bars (5-minute, 1-hour), take-profit (twice the stop loss), and the conditions on the daily and 4-hour charts (hereinafter “tightening”), there was no clearly profitable form after subtracting costs (even take-profit PF of 1.06, twice the take-profit, was within the realm of chance and from 2025 it showed a loss).
Rules (the detailed numbers were decided here)
・Here we count one form of pullback buying decided by numbers. EMA21 (21-period exponential moving average) and ATR14 (average true range of the most recent 14 bars) are common settings; the number of highs and lows, the ATR multiplier, waiting time, and take-profit location were determined here.
・Direction: If the previous day’s daily close is above the daily EMA21, only buys are targeted; if below, only sells.
・Highs and lows: “Highs” are bars higher than the surrounding five bars to the left and right; “Lows” are bars lower than the surrounding five bars. Since the rightmost five bars will be used after they align, they will not be rewritten later.
・Pullback low: After a valley, a peak forms, and after a brief decline, when the close clears above that peak, the lowest point of the decline (only when it is above the previous valley) is considered the “pullback low.” If the close breaks below the pullback low, that pullback low disappears. For selling, the equivalent is the “return high.”
・4-hour line: Of the still-visible 4-hour pullback lows that lie below the daily EMA21, take the highest as the “4-hour line,” and only trade as long as the 4-hour close remains above it. You only check whether the line exists; you do not assess whether your entry is close to the 4-hour line. Direction and this line together form the “tightening.”
・Entry bar: 15-minute bars (5-minute and 1-hour bars were also counted). The most recent pullback low on the 15-minute chart is called the “15-minute line.” If the price falls no more than 0.2 times the ATR below the 15-minute line and closes above the 15-minute line, it is considered “supported.” The ATR is measured on the entry bar (e.g., the 15-minute chart).
・There are two entry methods, the quicker one being used. ① Among the six EMAs on the 1-minute, 5-minute, 15-minute, 1-hour, 4-hour, and daily charts, take the highest EMA21. If, within 4 hours of the moment it is supported, the 15-minute close breaks below it from below, enter at the open of the next bar. ② On the supported bar, if the difference between the 15-minute line and the 15-minute EMA21 is within 0.1×ATR, enter at the open of the next bar.
・Stop loss is 0.1×ATR below the 15-minute line; take profit is the previous high before the pullback (the highest price from when the 15-minute line was formed until it is supported). We hold at most one position at a time, and exits are determined on the 1-minute chart (if stop loss and take profit land on the same 1-minute bar, it is a stop loss).
・Data: MT5 (MetaQuotes) USD/JPY 1-minute ask prices. Costs are counted with 1.0 pips per round trip by default, and also counted for 0 (reference), 0.3 pips (low-cost brokers), and 2.0 pips (bad times). Counted for 2010–2024; January 2025–September 2026 used for verification. The rules and pass line were decided before counting.
・t-value indicates how many times larger the average gain/loss is than what would be expected by chance. If the absolute value is less than 2 after removing the plus/minus signs, it is within the realm of chance; if it exceeds 3, it is unlikely to be due to chance. Values between 2 and 3 indicate an uncertain boundary, so the same direction is checked in other periods.
Result 1: The basic form is almost break-even before costs, and a loss after costs
・2010–2024: 1,184 trades (about 79 per year) with a win rate of 56.5%, PF 0.97, t-value −0.4, total −266 pips (before costs). With a cost of 1.0 pips per round trip, win rate was 51.4%, PF 0.82, t-value −2.4, total −1,450 pips.
・Even with the low-cost broker assumption (cost 0.3 pips), PF was 0.92 and t-value −1.0.
・Looking year by year, the positive years were only 4 out of 15 (2010, 2014, 2018, 2023) with cost 1.0 pips.
・Both buying and selling sides were losers (PF 0.85/0.80 with cost 1.0 pips).
・January 2025–September 2026: 139 trades, PF 0.62 (cost 1.0 pips).
・The pass lines decided before counting (t-value 3 or more, PF 1.2 or more during verification periods, etc.—five criteria) were met only in terms of count (52 trades per year or more) but not in profitability.
This is still based on historical data; future results are not guaranteed to be the same. The numerical rules were decided here; different methods of deciding them could yield different results. This is not trading advice. Previous validation (9:55 on GoTo on Do-to days and Tokyo morning conventions) has been summarized in the e-book and indicators (the noon value and Tokyo morning conventions [e-book]:https://www.gogojungle.co.jp/tools/ebooks/87687/ Noon value signal after noon value (サイン):https://www.gogojungle.co.jp/tools/indicators/87539).
In the continuation, the following are counted:
・At entry, the distance from the 15-minute line to take-profit was about half way (median 52%) further along—the reason why the win rate exceeds 50%
・Of the 669 trades that ended in take-profit, 60 turned into losses due to costs—what would happen on the 5-minute chart (costs before PF 1.07)?
・A table of 7 variants with different entry bars, take-profit, entry method, and tightening