

The price is looking to order 【Trader's common knowledge】
【FX・GOLD Trading Core Anatomy】
“Prices Go Looking for Orders”: The Fundamental Market Principle and Liquidity攻略法 to Escape Chicken Profit-Taking and Expand 200% Price Range
Have you ever felt your profit expanding smoothly after a perfect entry, only to see a single bearish candle appear and feel the urge to exit before profits vanish?
“What if it retraces to the breakeven? I should take profits now.” Right after pressing the close button for just tens of pips, the chart suddenly surges in the intended direction by 100 pips, 200 pips...
Conversely, at a loss, traders often cling to the belief that “it will come back someday” without basis, wiping out multiple prior profits with one loss. This is the classic“small wins, big losses (dollar-cost dragging)”loop, which, no matter how high your win rate, leaves your total net result negative.
Why do many traders chicken out in the middle? The root cause is not a matter of mindset or perseverance, but a failure to understand the market’s most important fundamental principle“Prices go looking for orders” mechanism.
Table of Contents
- 1. The True Nature of Chicken Profit-Taking: Not Mental Weakness but Absence of Destination
- 2. The Market’s Essential Principle: What Does “Prices go looking for orders (liquidity)” Mean?
- 3. The True Nature of Liquidity Pools Sought by Large Investors
- 4. [Practical Technical] Visualizing the “Destination where Orders Gather” on the Chart
- 5. [Practical Application] Concrete Trading Strategies to Eliminate Chicken Profit-Taking
- 6. Summary|Once the Destination is Clear, Fear of the Market Disappears
1. The True Nature of Chicken Profit-Taking: Not Mental Weakness but Absence of Destination
When you can’t grow profits in trading, many traders retreat to psychology arguments like “my mental strength is weak” or “I must improve holding power.” However, chicken profit-taking cannot be cured unless the structural problem is solved.
As behavioral economics’ “prospect theory” proves, humans instinctively feel, when profit is being made, “we want to lock in profits immediately to avoid pain,” and when facing losses, “we want to recover the principal by ignoring probabilities.” If you trade by emotions, you will inevitably converge to “small wins, big losses.”
? The Real Reason You Exit Early
The real reason you can’t extend your profits is not a lack of courage, but that you cannot view objectively the market’s current destination (where it’s aiming).
“Where the market is aiming now (destination)” is not clearly visible.
If you run blindly toward an unknown destination, any minor reverse movement will scare you and halt you. Conversely, if the destination is clearly known, you can hold positions through noise and temporary pullbacks until the destination is reached.
2. The Market’s Essential Principle: “Prices go looking for orders (liquidity)” What Does It Mean?
Then how is the market’s “destination” determined?
When you drill into the price fluctuation mechanism to its core, you arrive at one absolute truth. It is“Prices go looking for thick orders (liquidity)” as a physical-law-like principle.
What governs FX and the Gold market are not individual retail traders, but large institutions moving billions of dollars—institutional investors, hedge funds, central banks, etc.
For them to enter or exit large positions, there must exist equally scaled opposing orders at the same price range to counterbalance them.
| Large-Position Investors’ Actions | What the Opposing Orders Look Like |
|---|---|
| Close/Take Profit on Buy Positions | A large volume of“Sell orders” (crowd’s stop-loss sells, new limit sells, etc.) |
| Close/Take Profit on Sell Positions | A large volume of“Buy orders” (crowd’s stop-loss buys, new limit buys, etc.) |
If enormous settlements occur in a price zone with few orders, the price will slip due to the trader’s own orders, causing disadvantage. Therefore, large investors deliberately pull prices into zones where orders from investors worldwide accumulate (stops and limits), and place their orders there to offset and execute.
3. The True Nature of Liquidity Pool Sought by Large Investors
The area where dense orders accumulate that large investors target for settlement or setup is called the “Liquidity Pool” in Smarts Money Concepts (SMC) and ICT theory.
On the chart, the points where liquidity tends to accumulate are mainly three places.
【Three Major Zones of Dense Liquidity】
① Outside the most recent high/low (EQH / EQL)
Above obvious highs lies a huge amount of buy-stop orders (short sellers’ stops); below lows lies a huge amount of sell-stop orders (longs’ stops).
② Stop orders placed by breakout attempts
Beginner and crowd traders’ “new-follow-through orders” concentrate as they jump in the moment price breaks out of a range or key level.
③ Technical indicator’s calculated price ranges (Fibonacci targets)
Specific price bands like Fibonacci extension 161.8% or 200.0% that algorithms and pro traders recognize as take-profit targets.
Large investors target these zones, catching crowd stops and forcing rapid price moves (the so-called “stop hunt”).
If you have experienced prices reversing the moment you’re stopped out, that moment may be when you became a liquidity provider (sucker) for large investors. However, viewed differently, you can understand that “this liquidity destination is the true goal the market aims for.”
4. [Practical Technical] Visualizing the Destination where Orders Gather on the Chart
So how can we objectively grasp the price’s target destination on the trading screen? Here are three concrete approaches explained.
Approach 1: Arithmetic Calculation of N-Waves (ABC Waves)
Markets move in waves. When you confirm the origin (A), the pull-back high (B), and the starting point of motion (C), you calculate the next propulsion energy based on the A-B range, which is the “N-value (expansion).”
- 100% (N-range): The basic target extending the A-B range from point C.
- 161.8% (FE expansion): A standard liquidity accumulation zone when the trend is strong.
- 200.0% (Double N-range): The climax energy release and final objective where massive settlement orders converge.
Approach 2: Automatic Wave Detection via AI/Algorithms
Manually drawing Fibonacci lines involves trader subjectivity (which wicks to use), hurting reproducibility.
AI-based algorithmic analysis solves this. AI detects wave formation patterns and expansions automatically, and draws target lines like 161.8% and 200.0% on the chart with an expectedness score (e.g., AI SCORE 85+), so anyone can identify the common destination without deviation.
【Image of visualized liquidity targets on the chart】
※ Prices tend to progress toward the thickest order at 200.0% despite noise along the way.
5. 【Practical Application】Concrete Trading Strategy to Eliminate Chicken Profit-Taking
Turn the theory that “Prices go looking for orders” into practical actions you can apply from tomorrow's trades. The three-step points are below.
At entry, mechanically set TP to the 200% line
If you take a position by market order and watch the chart manually for profit-taking, emotions will interfere. At the moment of entry, preset the take-profit target to the 161.8% or 200% lines the large players target.
Fix the risk-reward ratio (RR) at least 1:2
Only place orders when the potential reward to TP is at least twice the risk to SL (approx. 1:2 to 1:3.5). If the destination is clear, you’ll naturally skip entering at unfavorable levels.
Use partial closes (trailing) to create a mental safety valve
If you’re uneasy about holding all positions to the end, take profits on 100%–161.8% reached and move the remaining entry price to SL at break-even, then trail up to the final 200% line. This allows aiming for the maximum range with no risk.
6. Summary|Once the Destination is Visible, Fear of the Market Disappears
In FX and GOLD trading, today is the end of fighting the market with emotions or perseverance alone.
What’s needed to win is not meaningless mental training, but understanding the universal principle that “Prices go looking for orders (liquidity)” and accurately drawing the destination on the chart.
- The core cause of chicken profit-taking is absence of destination, not lack of grit.
- Large investors move prices toward zones where crowds’ orders accumulate to settle their enormous positions.
- If AI or mathematical calculations visualize targets like 161.8% and 200%, you won’t be swayed by intermediate noise.
From the “darkness where you don’t know how far it will extend” to a world where the goal is clearly visible to large players. Simply changing perspective can dramatically improve your trading results and your mental state.
The method to build a trading environment where the destination is visible and the exclusive know-how are available below
Please check now
Awaited Next-Generation Environment: AI WAVE MT5 Version Finally Released
The MT4 logic remains intact, and the MT5 (MQL5) version that maximizes “visualizing entry rationale” and “exceptional operability” is now released.
“I don’t know when the next wave will be detected”
“I get cut off when multiple charts are open”
Such small stresses and concerns in prior trading are all resolved by MT5’s advanced, proprietary features.
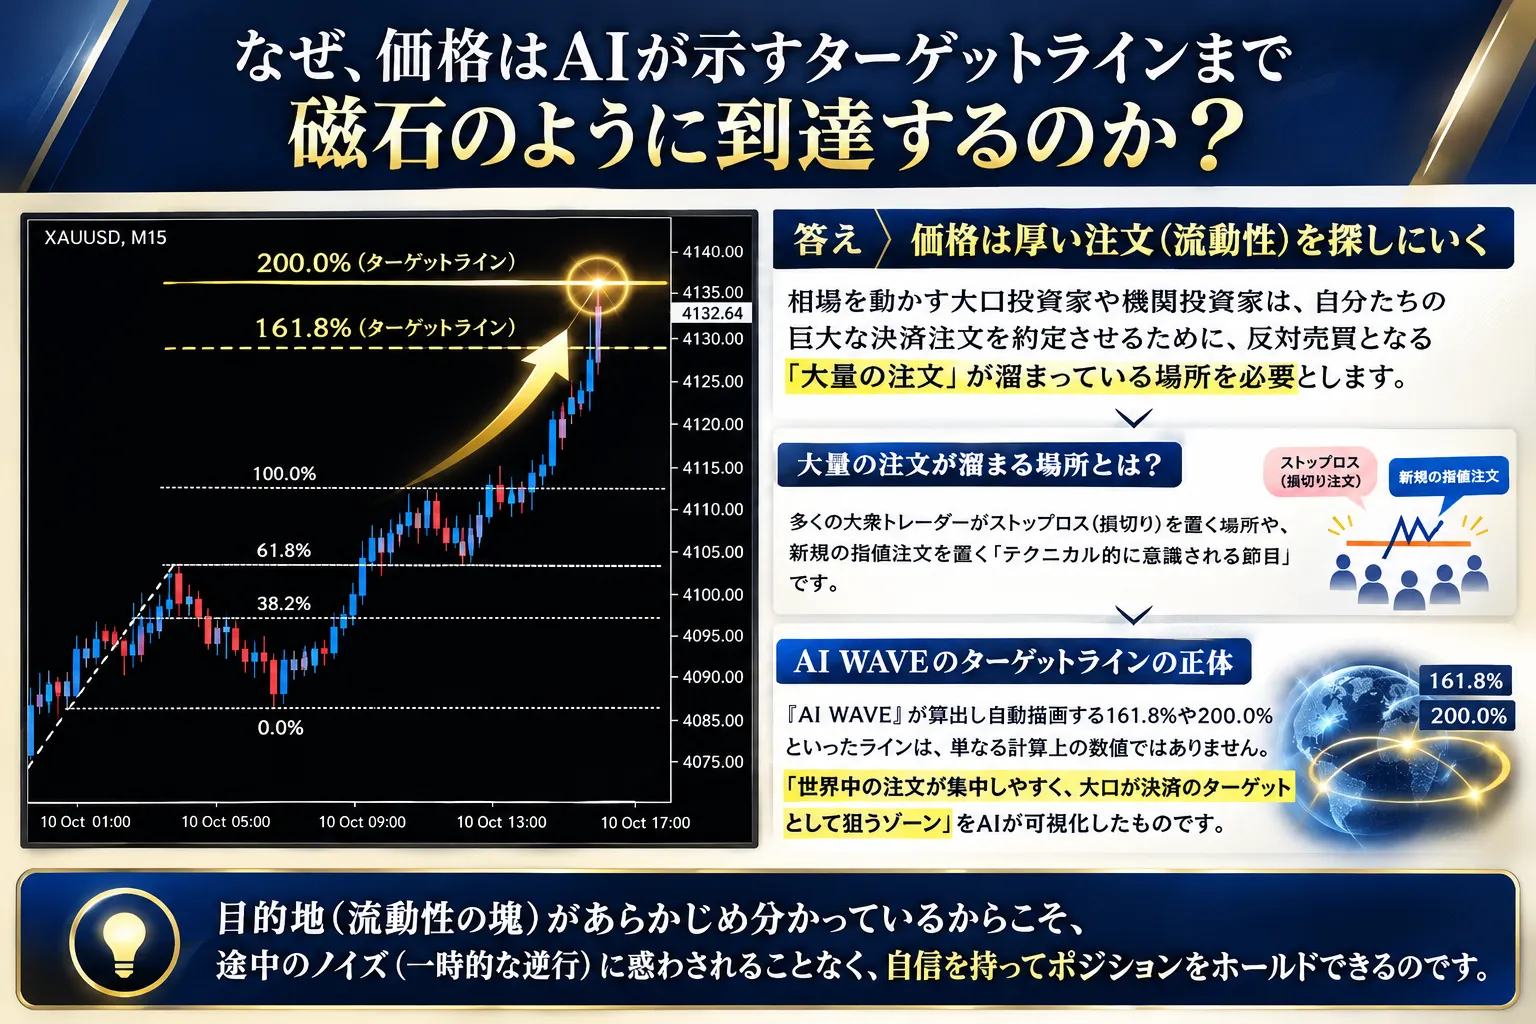
Why does price reach these AI-indicated target widths (target lines) almost like a magnet?
The answer lies in the market’s fundamental behavior.
That is,“Prices go looking for thick orders (liquidity)” as a fact.
The large-scale funds and institutions that move the market require locations where massive opposing orders accumulate to execute their sizable settlement orders.
Where is that? It’s where many crowd traders place stops and new limit orders—technically significant thresholds.
The lines like 161.8% and 200.0% computed and drawn by AI WAVE are not mere numbers. They visualize the zones where global orders concentrate and large players target settlements. Because the destination (the liquidity cluster) is known in advance, you can hold positions with confidence without being swayed by noise or temporary reversals.
MT5-Only Additional Features
The MT4 logic and settings are retained.
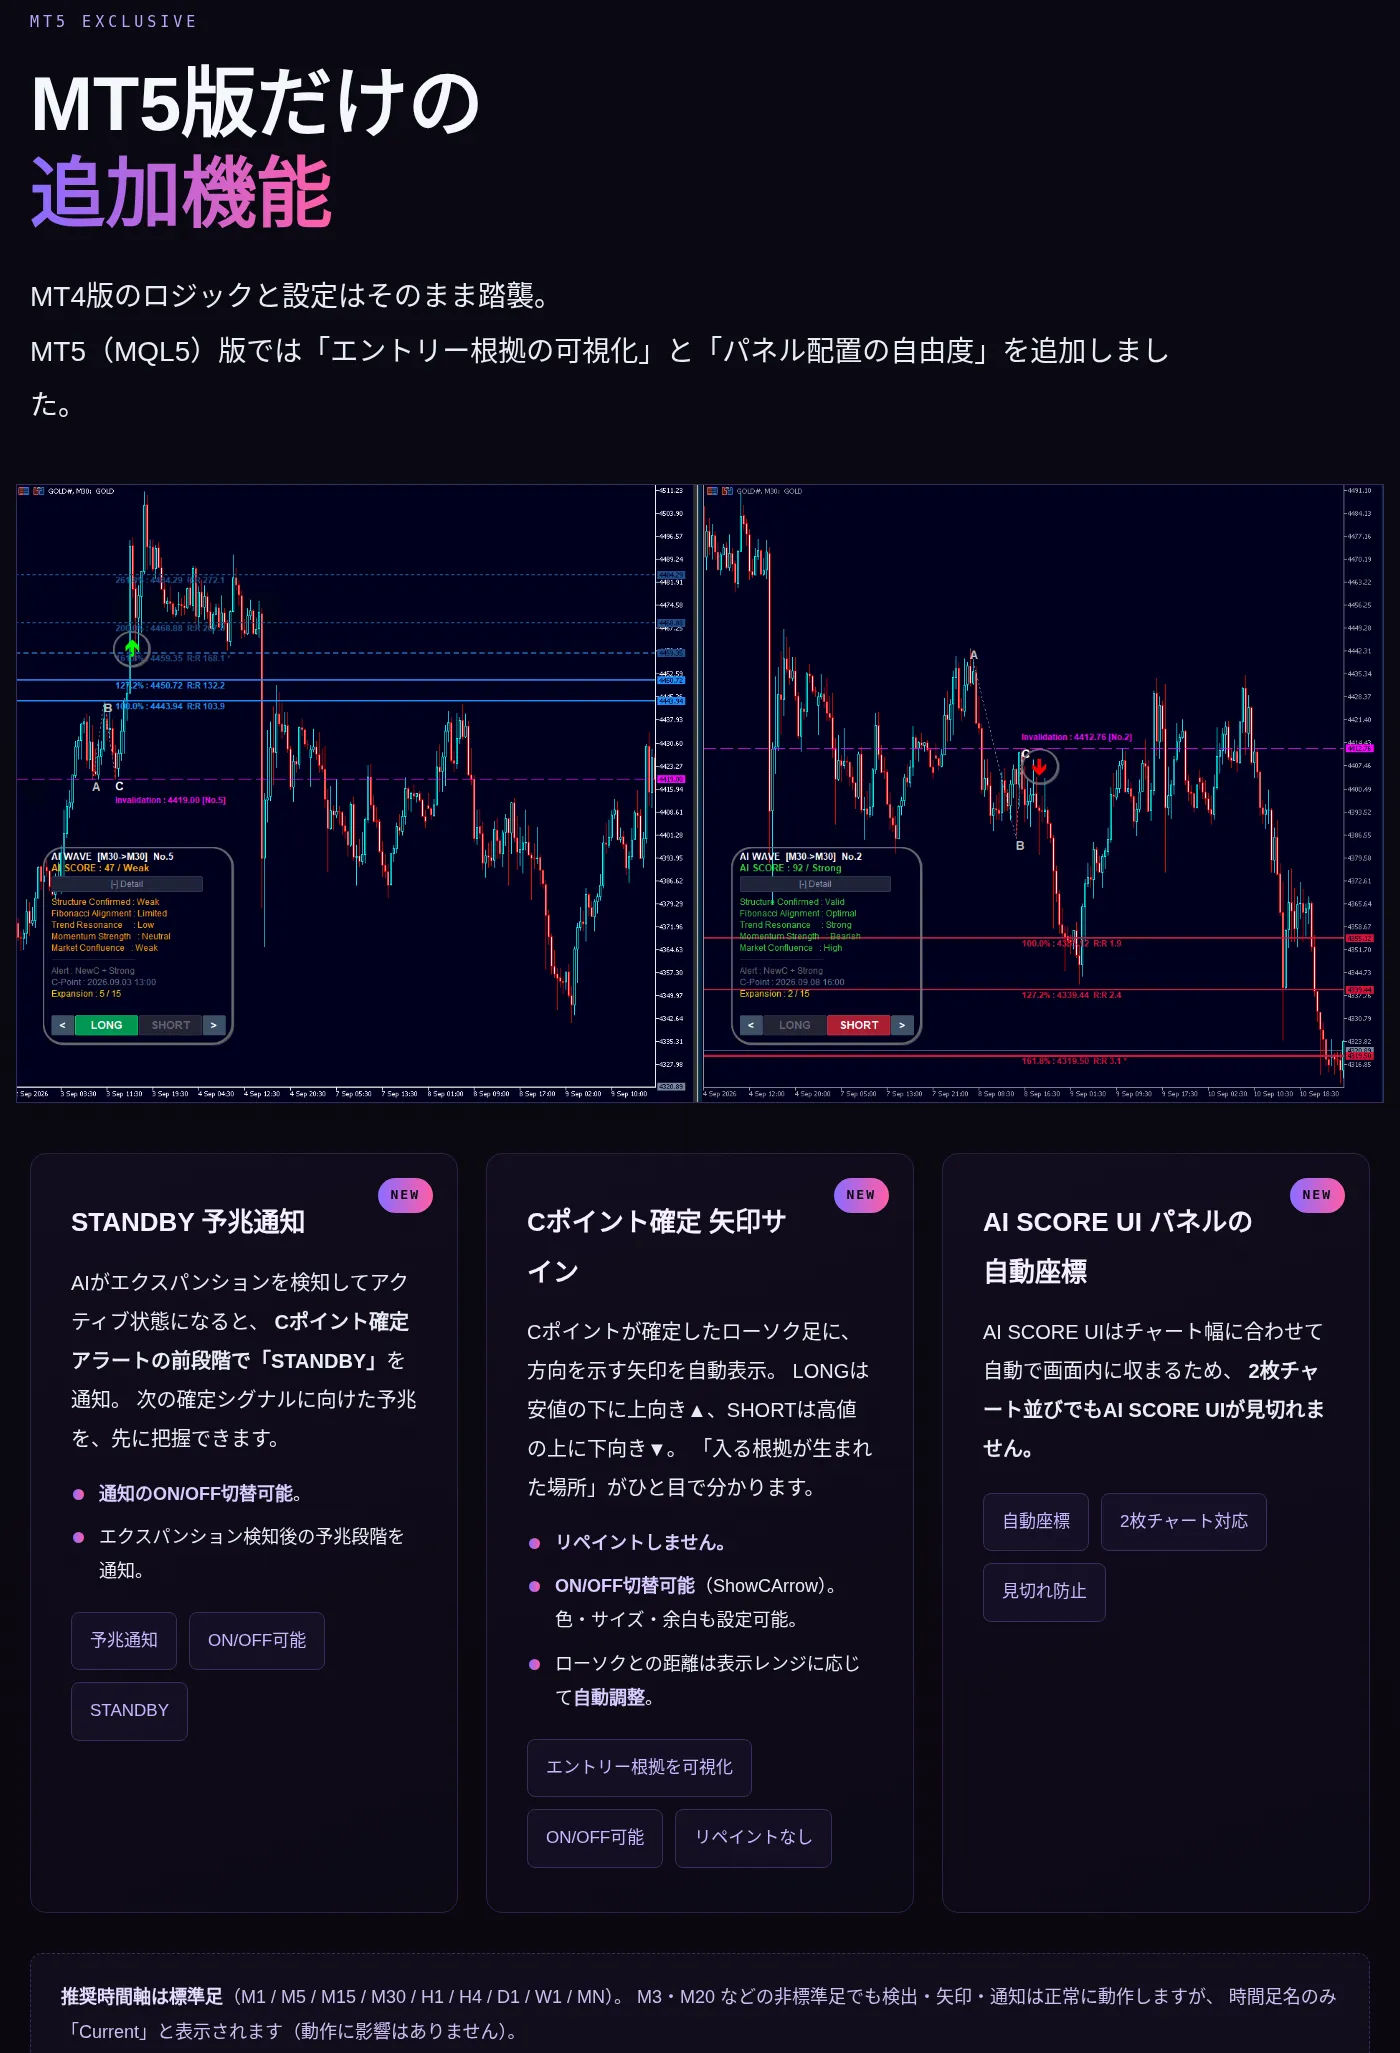
In MT5 (MQL5), added features include “visualizing entry rationale” and “flexible panel placement.”
STANDBY Signal Notifications
When expansion is detected and the AI enters an active state, a “STANDBY” pre-alert is issued before the C-point is confirmed. You can pre-anticipate the next confirmed signal.
・Notification can be turned ON/OFF.
・Signs of the expansion’s pre-signal are notified.
C-Point Confirmation Arrow Sign
When a C-point is confirmed, an arrow indicating direction is automatically shown under the candle for LONG (▲) and above for SHORT (▼). It’s immediately clear where a justification to enter has formed.
・Will not repaint.
・ON/OFF switchable (ShowCArrow). Colors, sizes, and margins are configurable.
・Distance from the candle auto-adjusts to the display range.
AI SCORE UI Panel Auto Coordinates
AI SCORE UI automatically fits within the chart width, so it won’t be clipped even on a two-chart layout.
Recommended timeframes are standard bars (M1/M5/M15/M30/H1/H4/D1/W1/MN). Non-standard bars such as M3 or M20 can detect, arrow, and notify properly, but the timeframe label will show as “Current” (no operational impact).
Choose according to your trading environment
‘AI WAVE’ MT5 version
Prompts, arrows, and UI auto-coordinates—MT5-only added features are fully integrated in this latest model.
MT5 version details and purchase here‘AI WAVE’ MT4 version
A basic model with its own robust AI wave-detection and expansion visualization logic, with an outstanding track record.
MT4 version details and purchase hereDisclaimer
The verification results and figures published in this article are references based on historical market data and do not guarantee future profits or similar results.
The pips and profit/loss figures published are based on the maximum price range reached after entry signals, calculated with fixed stop losses. These figures reflect the maximum potential movement if you fully hold after signals and do not represent actual executed profits or real trading results.
Actual profits and losses depend on entry/exit timing, spreads, slippage, trading fees, execution environment, position size, take-profit/stop-loss judgments, and market conditions. Also, stop-loss judgments are based on the 4-hour chart, and results may vary under different operational conditions.
Additionally, due to differences in trading conditions and price feed, actual prices, pips, profit/loss, and fills may differ across brokers/venues/platforms. Therefore, there may be discrepancies between published data and actual trading performance.
This data is a reference for validating AI WAVE’s market analysis accuracy. Final investment decisions should be made by yourself considering your financial status, risk tolerance, and trading environment.