
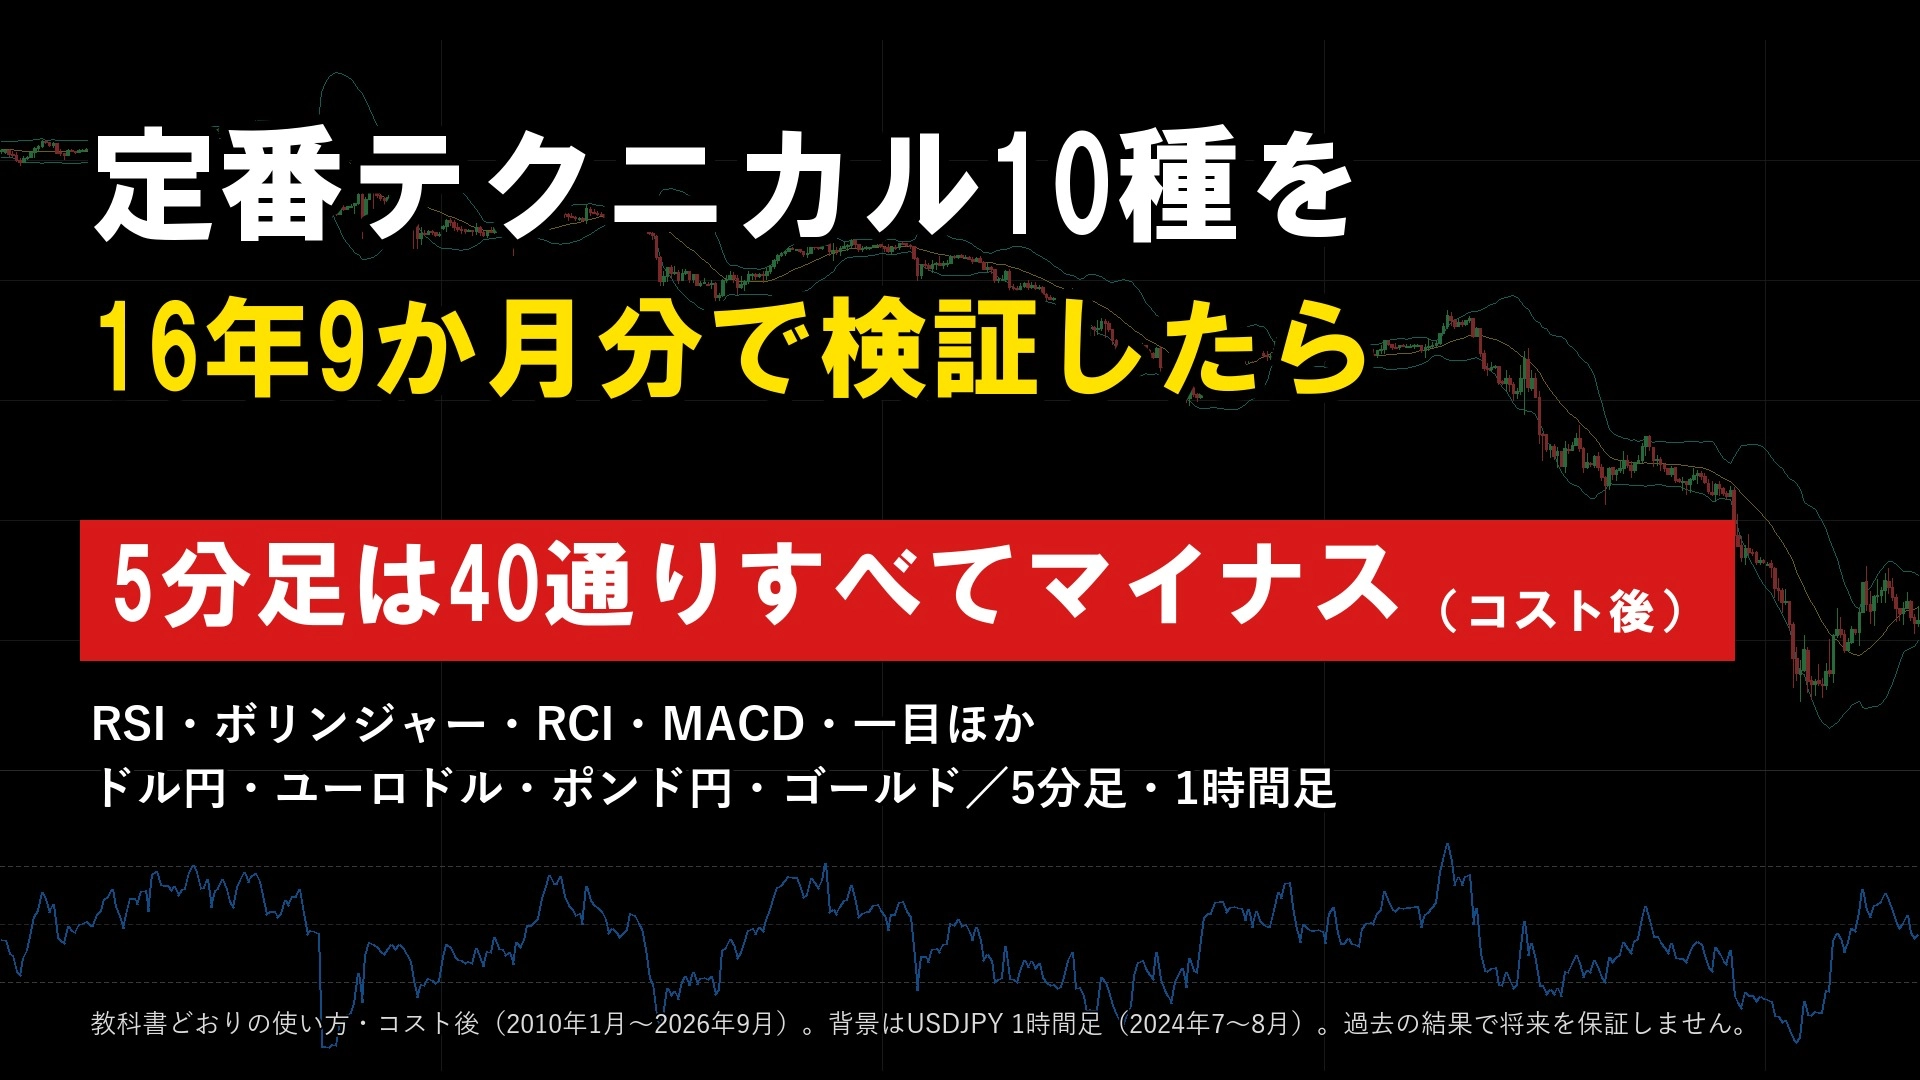
RSI・Bollinger Bands・RCI… Tested the standard 10 technical indicators over 16 years and 9 months; on the 5-minute chart, all 40 variants were negative (cost-adjusted・USD/JPY・EUR/USD・GBP/JPY・gold)
“Buy when RSI falls below 30,” “mean reversion with Bollinger Bands at −2σ,” “buy on the moving average golden cross.” These are common methods seen in beginner books and on the internet, but what would have happened if you traded using these methods for years as they are?
I am the “Verification Sommelier” selling indicators and e-books (EA is under review). My previous two articles counted price movements for the dollar-yen on a fixed day and fixed time. This time I will count the performance of 10 classic technical indicators used exactly as taught, using 16 years and 9 months of data.
In short, the conclusion
- 10 indicators × 4 currencies (USD/JPY, EUR/USD, GBP/JPY, Gold) × 2 timeframes (5 minutes, 1 hour) = 80 combinations analyzed from January 2010 to September 2026 (no swaps included).
- 5-minute timeframe: all 40 combinations were negative (after costs). Even the best had a Profit Factor (PF) of 0.92. Even if costs are reduced to inexpensive brokers levels (e.g., USD/JPY 0.3 pips, etc.), only 5 out of 40 were positive (highest 1.09).
- 1-hour timeframe: 13 out of 40 were positive. All positive cases followed “trend-following” methods (Bollinger trend-following, moving average cross, MACD, Donchian, Ichimoku), with win rates of 30–40%.
- The best performers were Gold with Ichimoku conversion line–base line cross (PF 1.16), Gold moving average cross (1.13), Gold Donchian breakout (1.12), USD/JPY Bollinger trend-following (1.11). All are small positives not reaching 1.2.
- When win rate exceeded 60% across 27 combinations (RSI, Bollinger counter-trend, RCI, and other “take the overextensions in the opposite direction” methods), all results were negative. Even with more winning trades, the size of wins was smaller than losses, and the overall win rate did not reach breakeven.
- The numbers in this article reflect only one textbook method (no stop loss, no time-of-day filtering). If you change stop losses, times of day, or settings, those results are counted separately.
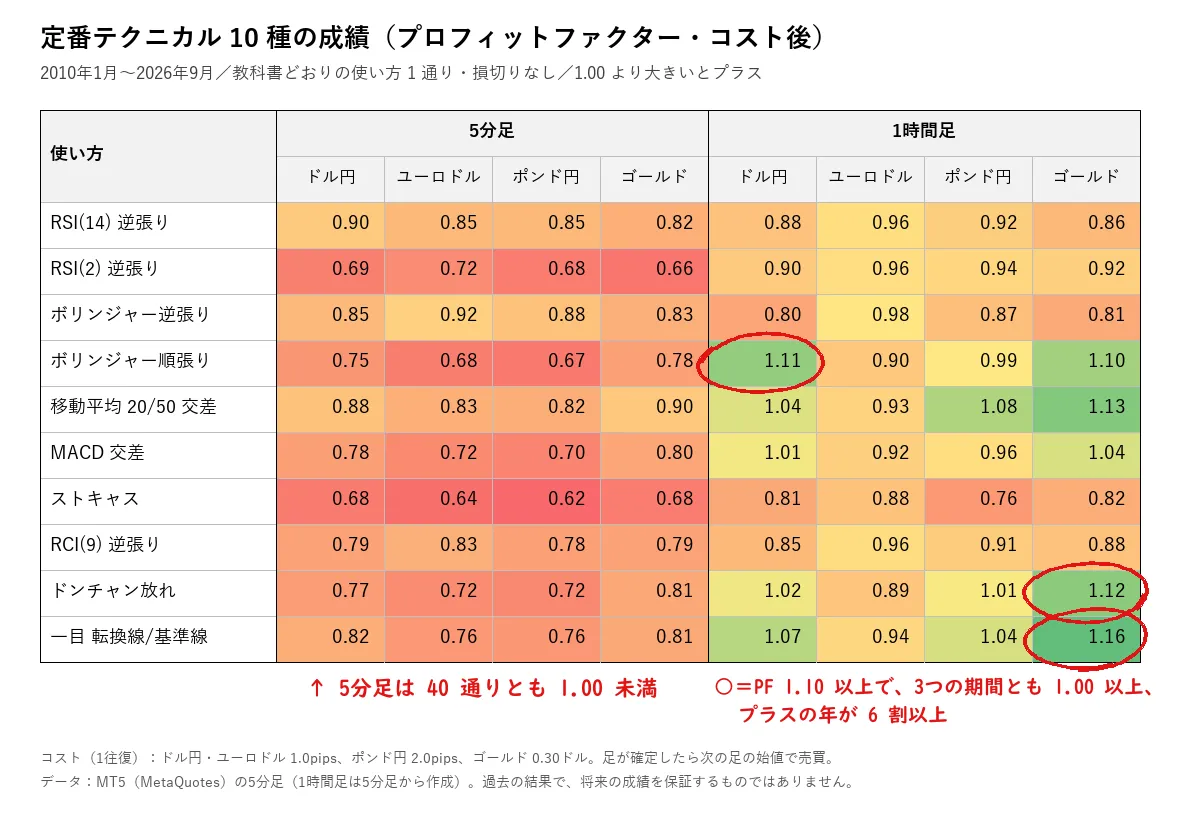
The 10 investigated methods (numbers kept at their standard defaults and not changed)
- RSI(14) counter-trend: Buy when RSI crosses from below 30 to above 30, exit above 50 (sell when RSI crosses from above 70 to below 70 and exit above 50)
- RSI(2) counter-trend: Buy when RSI(2) is below 10, exit when above 50 (sell when above 90 or below 50)
- Bollinger counter-trend: Buy when close is below −2σ (20 periods, 2σ) and exit above the center line (sell in reverse)
- Bollinger trend-following: Buy when close is above +2σ and exit below the center line (sell in reverse)
- Moving average cross: Buy when the 20-period average crosses above the 50-period average, sell (switch) when it crosses below
- MACD cross: Buy when MACD(12, 26, 9) crosses above the signal line, sell when it crosses below (switch)
- Stochastic: Buy when %K crosses above %D and %K is below 20. Exit when %K crosses below %D (sell in reverse; above 80 as limit)
- RCI(9) counter-trend: Buy when RCI crosses from below −80 to above, exit above +80 (sell in reverse)
- Donchian breakout: Buy when close breaks above the previous 20-bar high, exit when it breaks below the previous 10-bar low (sell in reverse)
- Ichimoku Tenkan–Kijun cross: Buy when Tenkan (9) crosses above Kijun (26), exit when it crosses below (switch)
How the counting was done
- Data: MT5 (MetaQuotes) 5-minute chart (USD/JPY derived from 1-minute). The 1-hour chart was derived from the 5-minute chart. Time period: 2010-01-01 to 2026-09-30 (16 years 9 months).
- Trades:判断 is made when a candle closes, and trades are executed at the opening of the next candle. No stop loss or take profit orders are placed (per textbook). Only one position held at a time. Moving averages, MACD, and Ichimoku are used with a switch to the opposite position when a cross occurs.
- Costs (spread, slippage, 1 round trip): USD/JPY 1.0 pips, EUR/USD 1.0 pips, GBP/JPY 2.0 pips, Gold 0.30 USD. Even assuming cheap brokers (0.3 pips, 0.3 pips, 1.0 pips, 0.15 USD), calculations were performed. Swaps are not included.
- Profit Factor (PF) = total gains ÷ total losses (after costs). PF greater than 1 indicates a net gain.
- Indicator calculations follow the standard MT4/MT5 indicators (RCI uses a common formula). To verify, I also ran two MT5 strategy tester tests for USD/JPY hourly (RSI(14) counter-trend and Bollinger trend-following, 2010–2024). The count difference was within 3% (2.3% and 0.7%), PF difference within 0.01.
Result 1: 5-minute timeframe all 40 combinations negative
- PF ranged from 0.62 to 0.92. Even when splitting the period, all 40 combinations were negative in the early period (up to 2017) and the later period (2018–2024). Only one combination was positive in recent years (2025–) — Gold moving average cross with PF 1.08.
- The average gain per trade before costs was positive for 17 of the 40, but still small (e.g., USD/JPY RSI(14) counter-trend +0.47 pips). One round-trip income on 5-minute charts is smaller than the round-trip cost.
- If costs are reduced to cheap-broker levels, positive results occur in 5 combinations (all counter-trend methods), with a maximum PF of 1.09.
→ Using standard indicators on the 5-minute timeframe tends to lose to costs.
Result 2: 1-hour timeframe only the trend-following methods show slight positives
- Of the 40 hourly combinations, 13 were positive (USD/JPY 5, Gold 5, GBP/JPY 3, EUR/USD 0).
- The median PF for the 20 trend-following methods was 1.03, while the 20 counter-extreme methods had 0.88.
- Gold Ichimoku cross (Tenkan–Kijun): PF 1.16, win rate 37%, 275 trades per year; PF by period: 2017 1.12 / 2018–2024 1.03 / 2025– 1.39; positive years 65%
- Gold moving average cross: PF 1.13, win rate 37%, 131 trades per year; PF by period: 2017 0.97 / 2018–2024 1.10 / 2025– 1.37; positive years 53%
- Gold Donchian breakout: PF 1.12, win rate 38%, 169 trades per year; PF by period: 2017 1.02 / 2018–2024 1.04 / 2025– 1.34; positive years 65%
- USD/JPY Bollinger trend-following: PF 1.11, win rate 36%, 226 trades per year; PF by period: 2017 1.05 / 2018–2024 1.20 / 2025– 1.08; positive years 71%
- Among top performers, from 2025 onward (periods of significant Gold rise) PF ranged from 1.34 to 1.39, whereas earlier it ranged from 0.97 to 1.12. Trend-following methods tend to perform better during major trend periods.
- The top 4 explanations account for 88–97% of the profits over 16 years 9 months concentrated in the best three years (e.g., Gold Ichimoku Cross 94% in 2011, 2025, 2026). The remaining 14 years contributed only 3–12% of total profits.
- The 13 winning combinations had an average holding period of 17–67 hours, and 48–86% of trades crossed days (no swaps). The top 3 Gold strategies carried forward profits up to $0.64 per ounce in the most profitable periods. With brokers charging higher swaps, those profits would be erased.
- EUR/USD hourly timeframe was negative for all 10 methods. Even with the same techniques, currency-specific results differ.
A product compiling the validations so far
A detailed version has been compiled as an electronic book, including scenarios with stop losses, time-of-day filtering, and extended currency sets to eight currencies (2,336 performance tables, PDF 50 pages).
- Classic technical 2,336 combinations performance table [ebook]:https://www.gogojungle.co.jp/tools/ebooks/87789
If you find this helpful, please hit the “favorite” in the article to help gauge what to count next.
The rules after GST midnight 9:55, the morning hours in Tokyo (holidays, month-ends, the day after holidays) are summarized in the ebook and indicators with 11 years 9 months of validation.
- USD/JPY morning rules and Tokyo morning rules [ebook]:https://www.gogojungle.co.jp/tools/ebooks/87687
- My book plus the close-at-availability signals (set):https://www.gogojungle.co.jp/tools/ebooks/87689
- Close-at-availability signals for MT4/MT5 (indicators with four signals):https://www.gogojungle.co.jp/tools/indicators/87629
- Close-after signals (MT4/MT5) for GOTO date 9:55 signals only (indicators):https://www.gogojungle.co.jp/tools/indicators/87539