
Please take a good look.
2026 Latest Version!!
Here you can watch the VTR of President Hayakawa GoGo-cho and my interview
This is information about new products!!
↓↓↓
Incidentally, knowing this method
New Millionaire Trader Scalping: Volume Plus
FX trading not ordinary: Bullish and Bearish Both Positions
If you engage in this, your mind will clear regarding the reversal moments I write about daily in Investment Navigator, and you can trade with focus.
Good evening, everyone.
Today, the USD/JPY price range is about 70 pips so far.
Looking at the daily chart, it has entered a downtrend and has retraced exactly about 50% from the bottom.
The top is at 16400 and the bottom is at 15300, a price range of about 11 yen.
Although the time differs, there were exemplary moves yesterday and today, so I’d like to write about those.
In FX, I think you won’t lose if you know where the reversal will occur.
I think you all feel the same.
If it reverses from there, you wait until that point.
That is a discretionary way of thinking, but if you can identify where the reversal occurs and theoretically you won’t lose, you should verify where that point is.
Reversals can occur by chance, “fortune,” or indicators, but from my long chart-reading experience, the scenarios I find high-probability are always the ones I write about: the “support-resistance flip points.”
The support-resistance flip point is where the buying and selling battle is resolved, in other words right in the middle of tug-of-war.
If you think of currency trading as a tug-of-war, from the middle it moves to one side or the other.
And as that strength swaps and flips, the movement reverses
In other words, if you find the middle of the tug-of-war, i.e., the support-resistance flip point, you have a high probability of knowing the reversal point, making you “unbeatable.”
USD/JPY 1-hour chart
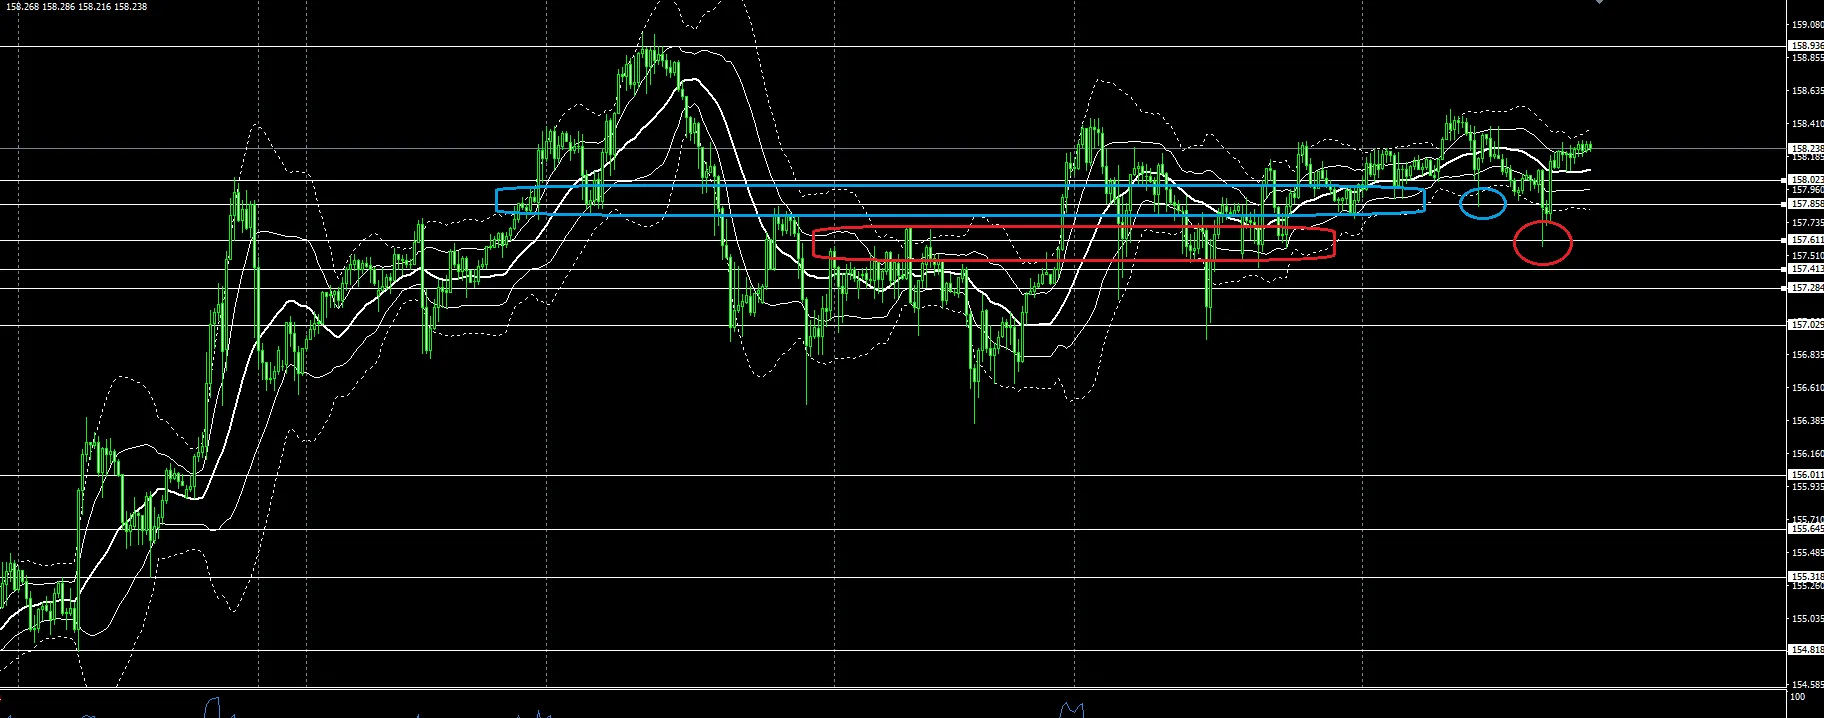
Last night’s point is the blue circle
Today’s point is the red circle
That’s all.
Looking at the past of the blue circle, the support-resistance has flipped.
Looking at the past of the red circle, the support-resistance has flipped as well.
The white horizontal line is the 1-hour Millionaire Trader line.
Usually the Millionaire Trader line is targeted on the 1-minute chart from breaks or pullbacks, but for timeframes of an hour or longer, that can be a reversal point.
This is not a coincidence, so Millionaire Trader users should verify on their own Millionaire Trader charts using the 1-hour or 4-hour charts.
Currently on the 1-minute chart, the Millionaire Trader S-line is drawn, with a first goal around 15780.
However, the 1-hour chart is in the middle of a support-resistance flip point.
Whether there will be a pullback up to 15800...
Thank you for your continued support today as well.
For traders who really want to succeed in trading and earn a living from trading, the product I recommend, which can be learned independently, is this trading technique ↓
Here you can see the trading histories of top traders and the FX methods discovered