

[Episode 5] When validating a horizontal line and a sign, things I want to see before the "win rate"
From the first to the fourth session, we have updated our perspective on horizontal line trading as follows.
- How many times has that line been touched? (line freshness)
- How is price approaching it? (observation of the process)
- Are we not starting the confirmation after the touch? (timing)
- Does that approach have “momentum”? How to view the overlap of conditions? (quality of approach)
In this fifth session, we will talk about“When you reflect and validate with numbers (data)”.
When validating horizontal-line methods and sign tools, the first thing everyone looks at is the win rate (%)
“Out of XX cases, YY reversed” or “After ZZ seconds, it was positive.” It’s easy to understand as a number and easy to compare with others, so it often appears in the most prominent place on product pages and validation articles.
However,if you cling only to “win rate,” the risk of missing the essence of trading rises dramatically.
If you reduce it to a simple binary “high win rate = good method,” “low win rate = bad method,” the distinctions between the approaches and the overlaps of conditions that we carefully separated in sessions 1–4 will be reset all together.
What happens if you chase only the “win rate”?
There are three main reasons.
① The definition of what counts as one case becomes vague
Did you count every moment when the line touched as one case, only the first contact, or only approached with momentum?
If the denominator (the denominator of the tally) differs, even with the same “win rate 60%,” the content (reliability) is completely different. If you ignore condition overlaps and tally indiscriminately, you mix data that should be improved with data that is meaningless.
② The judgment time and actual trades diverge
“30 seconds later,” “60 seconds later,” “a few minutes later.” Short-term trades tend to produce numbers more easily with short-term judgments, but if that judgment time does not align with your actual holding time or exit rules, even a high win rate is meaningless.
③ You are fooled by “apparent high win rate” due to overly narrow conditions
The more you narrow conditions (filters), the more the remaining sample size (denominator) drastically decreases. As the sample size shrinks, a phenomenon occurs where the win rate appears high due to chance (overfitting).
Even if you only show the win rate when many stars appear, if the occurrence happens only a few times a month, it becomes a very fragile foundation for real operation.
Of course, I am not saying not to look at win rate.
What is important is“to place the order of viewing win rate at the very end”.
So, when we look at data or validation results, what are the “four indicators” we should fix and confirm first before viewing win rate?
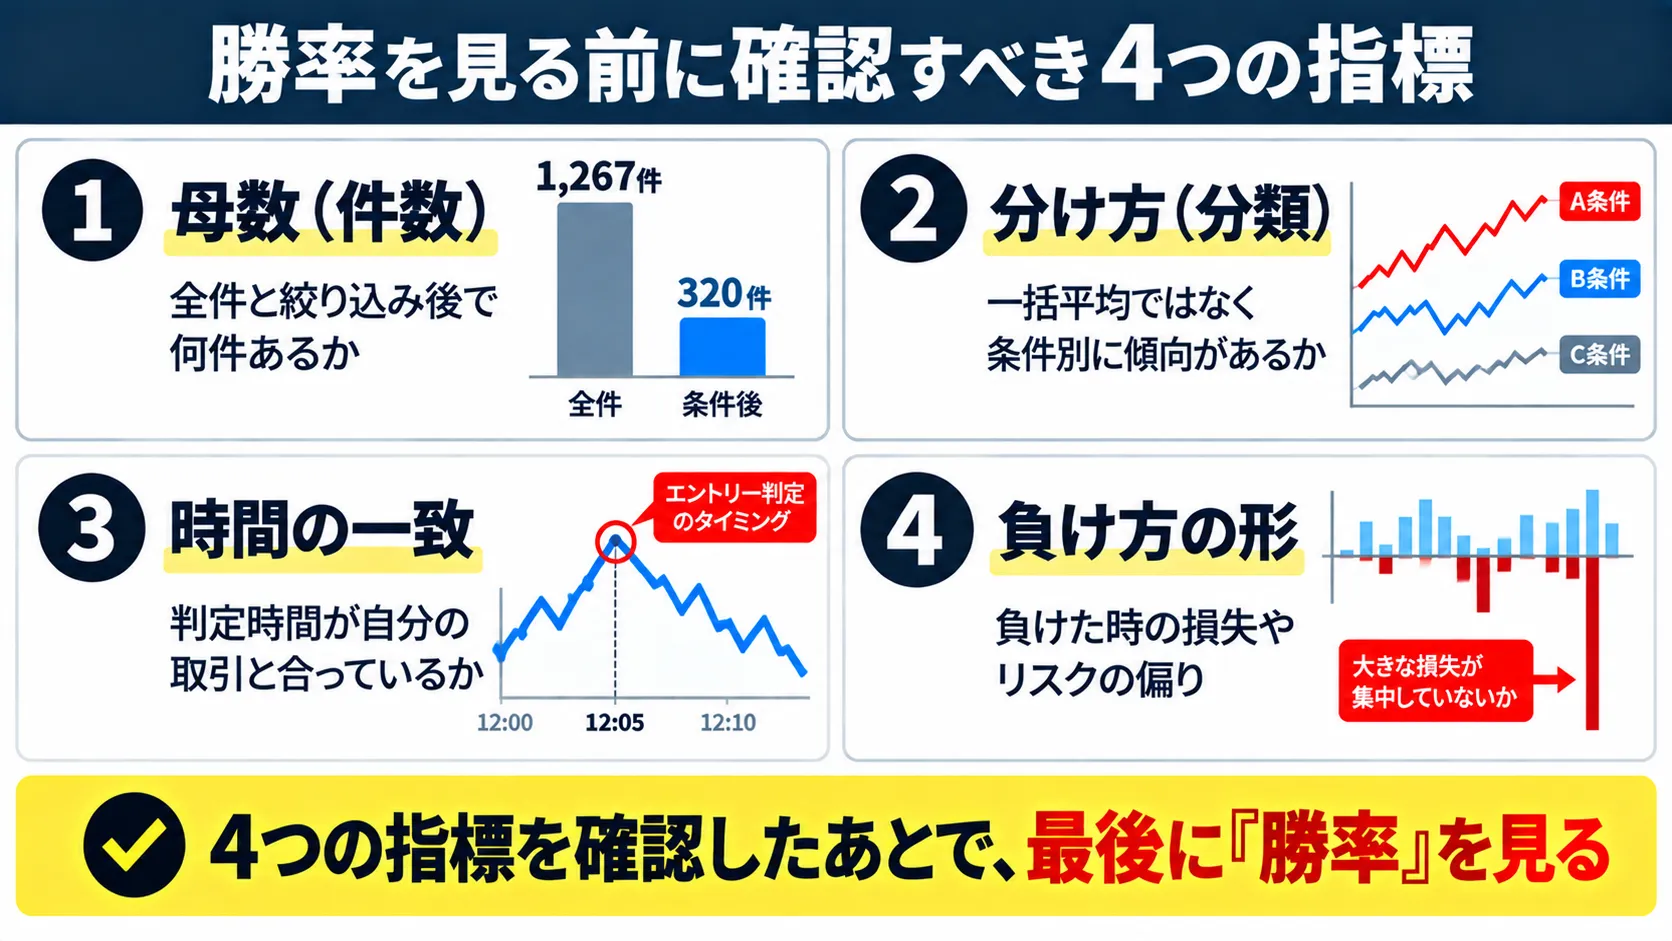
When I scrutinize validation data for horizontal lines and sign tools, I always confirm the following four points before looking at the win rate %必ず次の「4つのポイント」を確認.
① Denominator (how many data points exist in total)
First of all, the count matters.
There is a big difference between “win rate 60% within several dozen data points” and “win rate 60% within more than 1,000 data points.”
Furthermore, fixed in advance are the denominators for each set, such as “all touches,” “only formal signals,” or “only high-precision ones where conditions overlap.”
② How you divide (not hiding things in one lump)
First contact and already touched, presence or absence of momentum, currency pair, time of day.
When data are broken down (classified) in detail, do the trends remain, or do they only look neat when all data are averaged together? If the numbers collapse the moment you separate them, that high win rate may just be a phantom wearing the mask of an average.
③ Match between judgment time and your usage
Whether the judgment time used in validation (x minutes later) matches the time frame you want to trade with that horizontal line. If it does not match, a high win rate cannot be a basis for use.
④ Shape of losses (risk bias)
Even with a high win rate, if losses that wipe out profits occur abruptly (the opposite of small losses, big gains), your experience in short-term trading and account balance stability will change greatly. Win rate alone cannot reveal this risk of how you lose.
After clearing ①–④ in order,the final finish (summary of results) is to look at the win rate.
This is the correct validation order to avoid being fooled by data.
Apply the same perspective to the validation data on sales pages
This perspective can be used as-is when evaluating the sales pages for indicators or sign tools.
- Are the period and targets (currency pair, time frame) clearly stated?
- Are both the total sample and the sample after filtering conditions disclosed?
- Is the judgment time for the numbers clearly stated?
- Are the numbers for “only good conditions” separated from the overall numbers?
- Is there a note that future profits are not guaranteed?
Pages where only the neat win rate % is shown should be checked to see if the above grounds are not omitted.
When I developed『TENRYU LEVELS FX』product page, I applied this policy consistently when posting validation data.
Rather than simply cutting out the cleanest numbers and showing them,I clearly separate the total number of “formal signals” and the number of signals with overlapped conditions (by star rating), and display a table by judgment time (tens of seconds to tens of minutes).
If you extracted only the highest conditions of ‘★★★,’ the appearance would be even better, but it would not reflect the overall picture, so I deliberately separate and describe honestly.
Not to boast flashy numbers, but“disclosing how and what was counted and how they were classified”is what I believe leads to true trust.
※The validation data displayed on the product page is based on past history and does not guarantee future profits or win rates.
The discussion of horizontal lines does not end with how to draw or interpret charts.
If you change your perspective (thinking process),you must also change how you summarize and validate, as a set. If you don’t, you will revert to the simple binary of touch or not touch again.
Next time is the final installment.
We will condense the contents of this series and present a practical “Horizontal Line Trading—Confirmation Checklist” that you can use right away.
To use horizontal lines as real, evidence-based decision material, we will review what minimum checks to perform. Final organization ahead.