
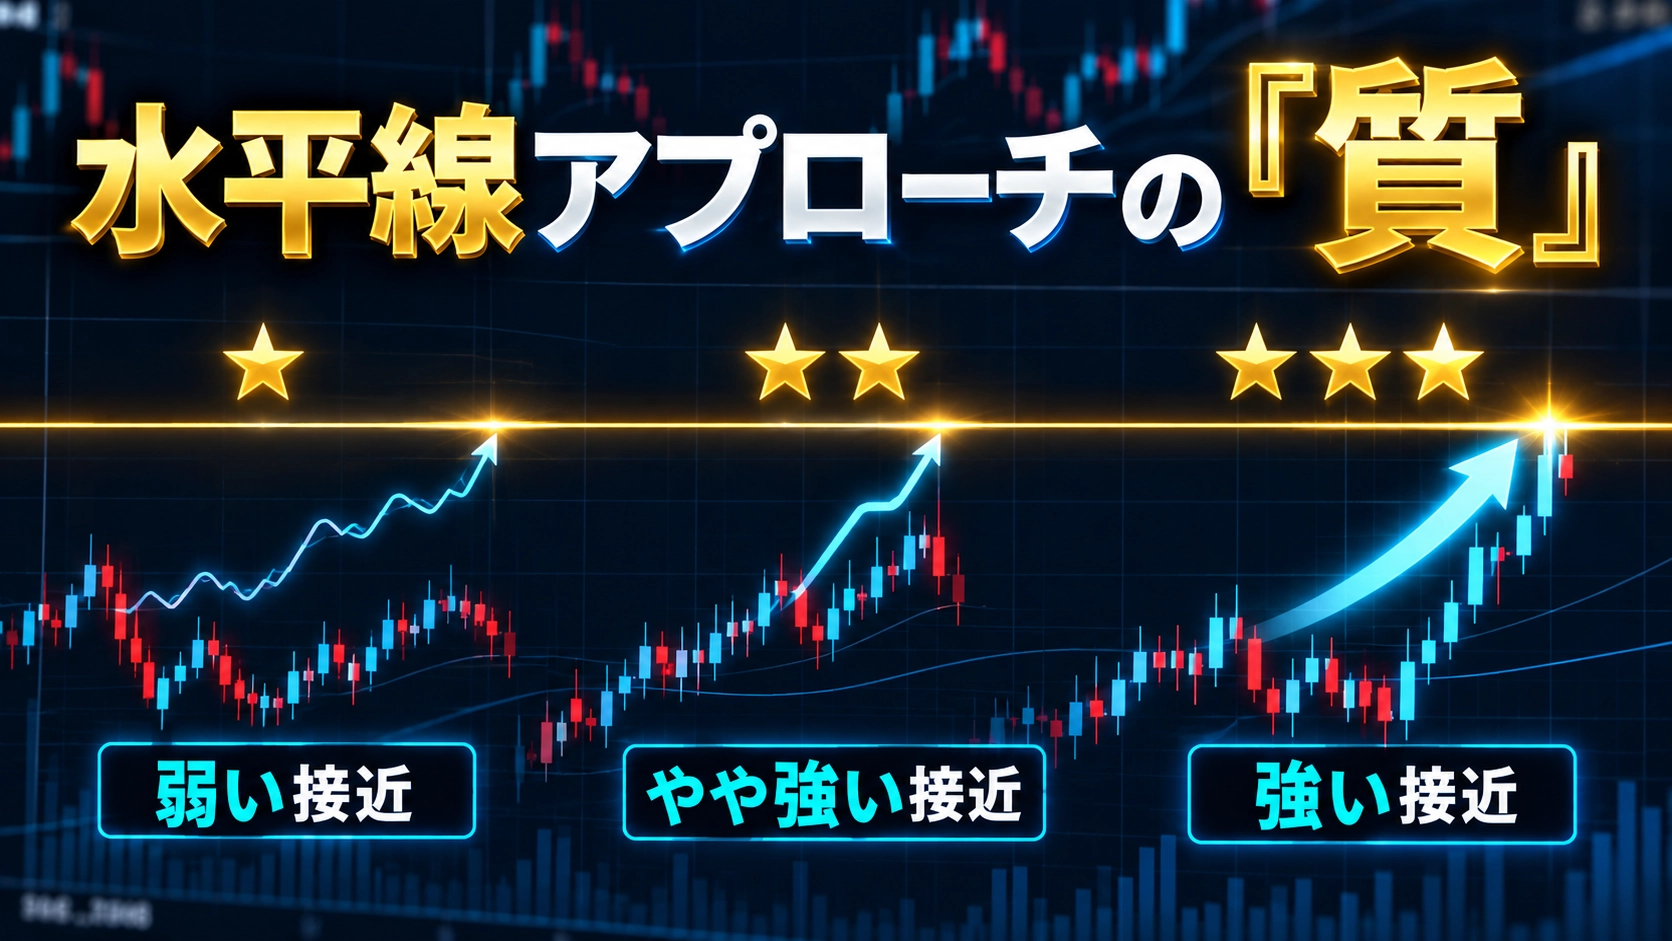
【Episode 4】Even on the same horizon, is a close approach with momentum a different thing from a close approach without momentum
The first part discussed “which time number of contact this is (the state of the line)”, the second part described “how it is approaching (observation of the process)”, and the third part covered “not enough time after touching (timing of the title)”.
In this fourth installment,“the quality of approach (momentum and the overlap of conditions)”is the topic.
When you look at the price (candlesticks) extending toward the horizontal line, you will notice that there are two main patterns.
- In a short time, an unequivocal and clear “momentum” moves toward the line
- Time and again, slowly negotiating to approach the line with a weak momentum
Both appearances may look the same as “approaching a horizontal line.”
However, the price action after touching the line, and the responses (scenarios) we should take on the spot, cannot be treated as identical for these two.
What matters here is not to simply decide that “there is momentum, so counter-trade is dangerous” or “there is no momentum, so it’s safe.”
“Beforehand, determine which type each current approach is, and observe the first contact accordingly.”
What tends to happen with the two kinds of “quality of approach”
① Approaches with momentum
A sudden approach toward the line tends to be the first strong collision against the line (energy clash). At the same time, there is a higher risk of momentum carrying it through the line.
Whether aiming for a pullback (reversal) or wary of a breakout (trend-following), rushing in by just looking at the moment of contact makes the judgment sloppy.
However, if you can correctly recognize in advance that “this is an approach with momentum,” you can avoid panicking after contact and calmly prepare for both “reversal scenarios” and “breakthrough scenarios.”
② Approaches with weak momentum (or wandering near the line)
On the other hand, a weak approach or one that wanders back and forth near the line before reaching it shows an entirely different face.
At first glance, it may look calm and safe, but in reality, buyers’ and sellers’ orders near the line can already switch violently, making a clean first reaction unlikely.
This is not merely an extreme statement that “it won’t reverse because it’s weak.”“It’s important to correctly grasp the fact that the history (process) of the previous approaches was different.”
Even on the same horizontal line such as “R1” or “S1,”
- Is it the first contact, or has it been touched many times already? (Part 1)
- How did it approach? (Part 2)
- Was there momentum in that approach? (This time)
When these overlap, it becomes more than just a simple touch to a horizontal line; it turns into highly dense trading information.
So how should we organize these overlapping conditions in actual trading practice?
In fact, there is no need to complicate rules. What I am consciously focusing on is to “view the overlaps in a few simple stages.”
What I keep in mind in practice is not to increase a complex conditional expression with each approach, but to“hold the overlap of conditions as coarse stages (evaluations)”.
For example, a three-stage organization like the following (names are convenience labels for clarity).
Stage 1: Basic (line premise)
Meaningful contact with the line I am focusing on (e.g., the first non-contact line).
First, recognize that there is a possibility that some attack or defense will occur at that line.
Stage 2: Basic + Momentum (overlap of process)
In addition to the line state of Stage 1, a price movement toward the line exhibits continuity or a clear “momentum.”
Compared to mere approaching, this has one more basis criterion.
Stage 3: More time orientation (overlap of environment)
In addition to Stage 2, there is a time window within the short-term candles and a specific timing/position relationship that is aligned.
Even with signals in the same direction, this provides material to adjust the priority of trades based on the timing of occurrence.
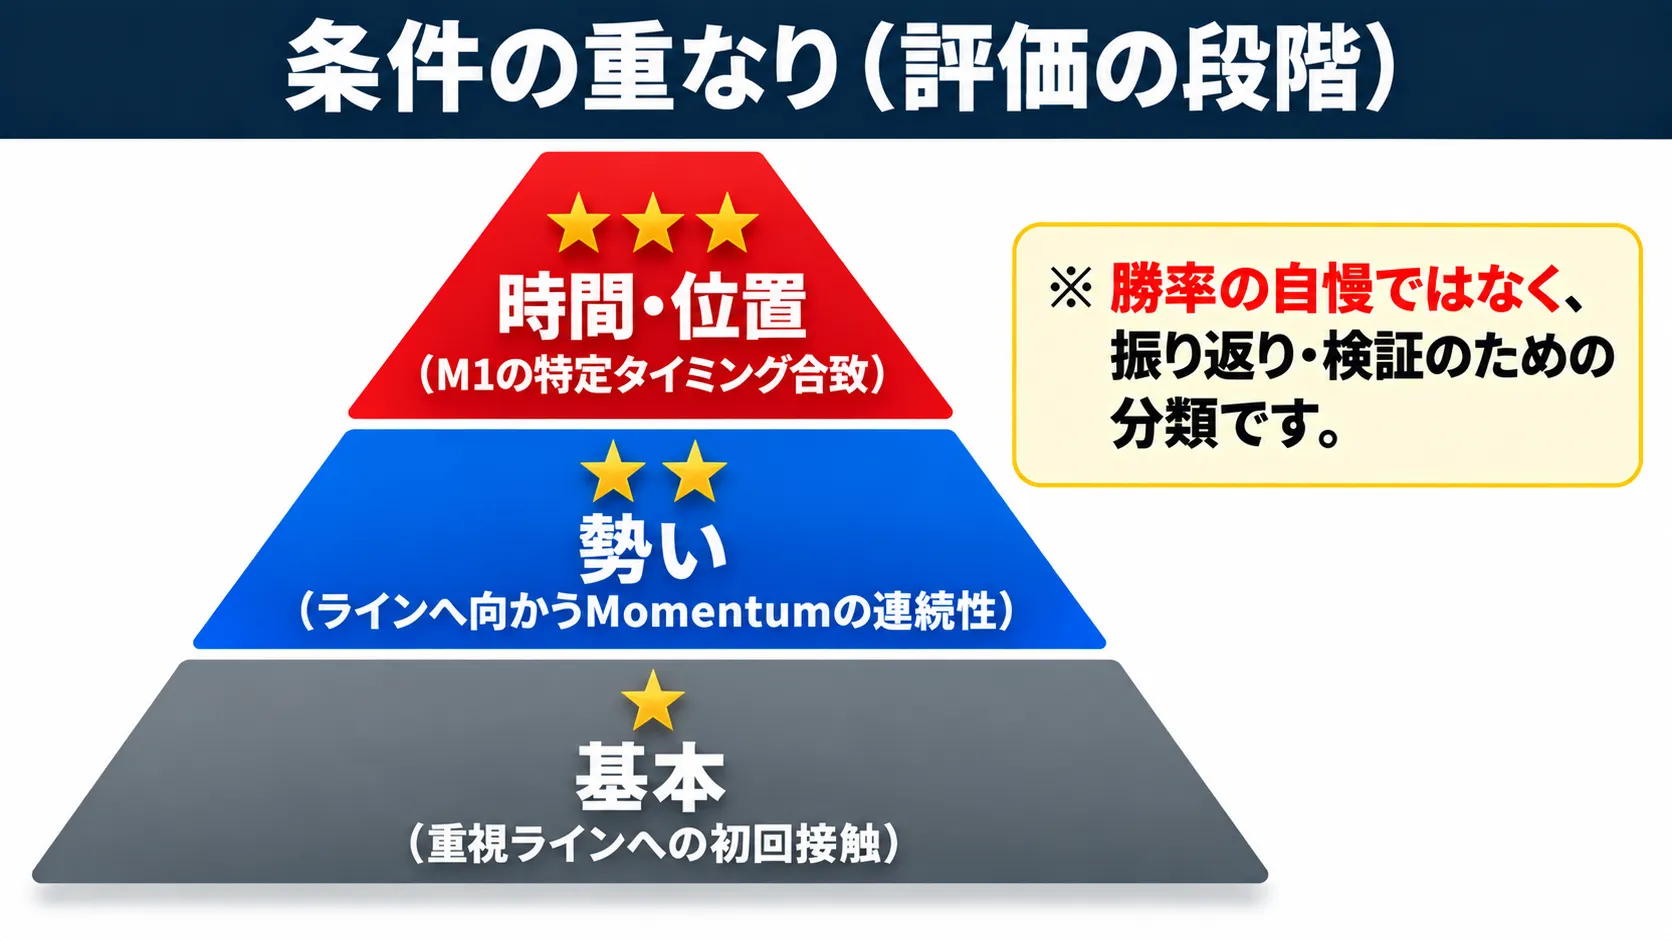
What is important here is that this is not a magical ranking where “more stars means you always win.” , which means “this is not a magic ranking that guarantees winning just by more stars.”
The reason for this classification is to ensure you can later review and verify “how much the trade occurred due to overlapping conditions.” Yes, when you actually verify and improve your trades, separating and observing only the momentum-bearing contacts rather than tallying all touches together reveals weaknesses and improvement points in your rules more clearly.
It is not a classification to brag about win rate, but a classification to preserve the precision of what you were seeing.
Even with manual trading, simply leaving a note like “first contact – momentum present” or “contacted – weak” in your chart memo or log has a significant effect.
However, when you are monitoring multiple currency pairs and lines in real time, organizing this overlap purely in your head becomes difficult.
If this overlap (stages) is displayed on the chart at a glance, it will connect smoothly with the flow described in Part 3: “Approach → Watch → Touch.”
In the product I developed“TENRYU LEVELS FX”, to visually organize this “short-term condition overlap,” I use a three-level display for officially generated signals★ / ★★ / ★★★.
TENRYU LEVELS FX three-level display
- ★ (Basic):A meaningful initial touch to the horizontal line, i.e., a basic official reversal condition is in place
- ★★ (Momentum):In addition to the ★ condition, there is a continuous Momentum toward the line
- ★★★ (Time/Position):In addition to ★★ conditions, there is a specific timing/position relationship aligned with M1
※The number of stars does not guarantee future profits or win rate. It is an index to objectively organize/evaluate the degree of overlap when the signal occurs.
※For details on the verification data and interpretation of conditions, please refer to the explanations/notes on the product page.
If you connect the contents from Part 1 to Part 4, the way to view horizontal lines is as follows.
- How many times has that line been contacted? (Line freshness)
- How is the price approaching it? (Observation of the process)
- Has that confirmation started after touching it? (Timing)
- Does that approach have momentum? How much do the conditions overlap? (Quality assessment)
Horizontal-line trading yields little information if you only consider whether you touched it or not as a simple binary choice.
If you add the perspective of“quality of the approach”, the meaning a single horizontal line holds changes dramatically.
Next time, I will write about the numbers to look at and the numbers not to look at (easy to be misled) when validating horizontal lines and indicators.
If you chase only counts or superficial win rates, you may miss something important. I will discuss what that is.