

[The Trading Edition] Episode 7: 5-minute chart vs. daily chart, which is the correct answer? Saving the indecisive trader with the "conflicting time frames" and the strongest signal "Kangaroo Tail"??

In the previous article, I talked about how the support and resistance drawn on charts are lumps of “people’s pain and regret,” and that you should watch out for false Breakouts.
This time, we will explain in more detail and slowly the time-frame traps that many people stumble upon when they actually try to start chart analysis and the extremely reliable strongest chart patterns that can be found from them in more detail than before, with a calm, thorough explanation ☕️
⏱️ A 5-minute chart says “buy,” a daily chart says “sell”… which do you trust?
After you’ve been trading for a while, you may fall into such a despairing situation.
“On the 5-minute chart there’s a clean uptrend and a buy signal, but on the daily chart it shows a complete downtrend and a sell signal…!”
In the market, multiple timeframes—such as 10-minute, intraday, daily, weekly, and monthly—advance concurrently. Therefore, a chart that looks like a “buy” in one timeframe can frequently emit the exact opposite “sell” signals in another timeframe.So, which should we follow?
Dr. Elder points out the difference in perspectives between winners and losers.Amateurs tend to emphasize shorter timeframes, but professional traders, when they have doubts about the market, view it from a broader, more macro perspective.
Without a macro perspective, trying to take rational actions based only on short-term timeframes (like 5-minute or 15-minute) is impossible. You’ll be tossed around by short-term volatility, and your nerves will wear thin. Pros first view the bigger picture on longer timeframes (daily or weekly), then look at the smaller timeframes to see the trees within the forest. This forms the basic principle of the triple-screen trading system, the doctor’s name that will be explained later.
? The strongest signal the pro seeks: the Kangaroo Tail

So, once we open the broad daily chart, exactly what kind of signals should we look for?
Among the signals selected by the doctor as “highly reliable chart patterns” is the signal called the “Kangaroo Tail.” It is also commonly referred to as a pin bar.
The Kangaroo Tail is formed by three bars (candlesticks).A very long one bar appears and is flanked on both sides by bars of normal length, protruding from a cluster of prices.
This pattern appears with a sound of a sudden pop just when you expect the trend to continue, and it issues a strong warning against trend reversal.
Tail poking upward:sells signal at the market top.
Tail poking downward:buys signal at the market bottom.
⚔️ The screams of the “defeated vanguard” hidden in the tail
Why is that long tail such a powerful reversal signal?
Because this one bar records the market’s complete defeat of the masses.
Imagine an upward Kangaroo Tail (a bar with a long upper wick). This indicatesbuyers failed to push the market higher. The vanguards of buyers charged to seize the hill but, in the end, could not join with the main force and retreated down the hill in a desperate withdrawal. The soldiers who could not hold the hill (buyers) have no choice but to leave.
Conversely, a downward Kangaroo Tail (a bar with a long lower wick) reflectsthe failure of the sellers’ assault. Although the sellers pushed the price down aggressively, buying pressure at the low prices overwhelmed them, forcing a retreat back to the original range.
After failing to continue falling, what is the most likely next development in the market? Yes. Because there are almost no orders below the current price, the price is likely to reverse and move upward.
?️ The pro’s way of fighting: trade in the opposite direction toward the tail
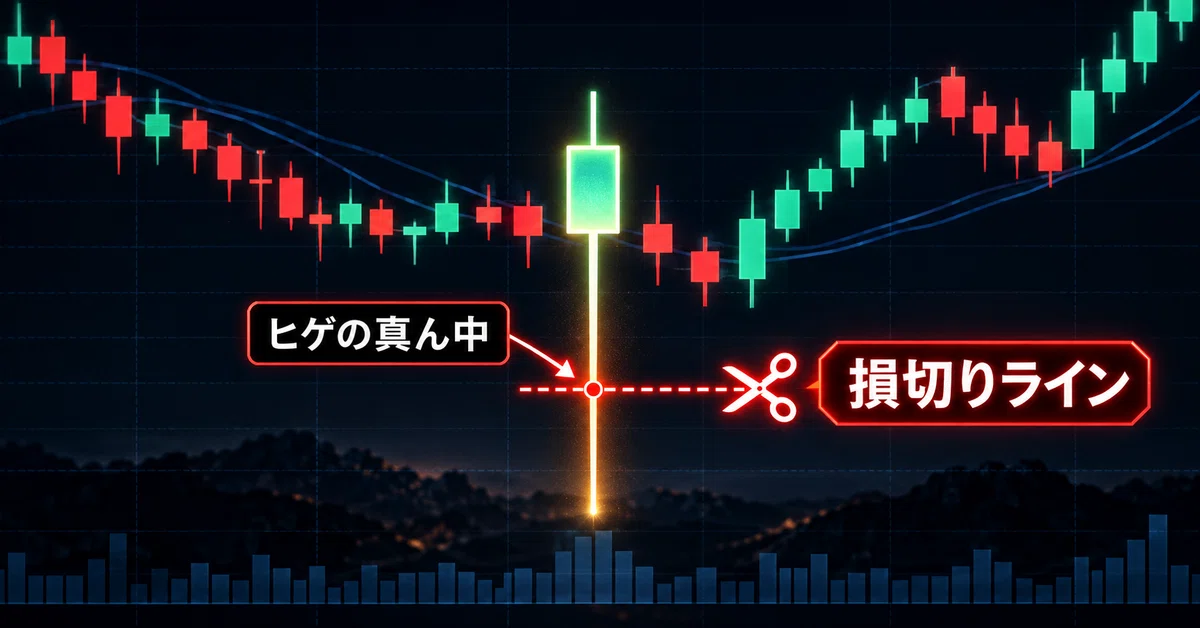
Once you find the Kangaroo Tail,you place trades in the direction opposite to the signal it indicates. If a downward tail appears, buy; if an upward tail appears, short-sell.
But here, there is a professional money-management rule that you must absolutely follow.