
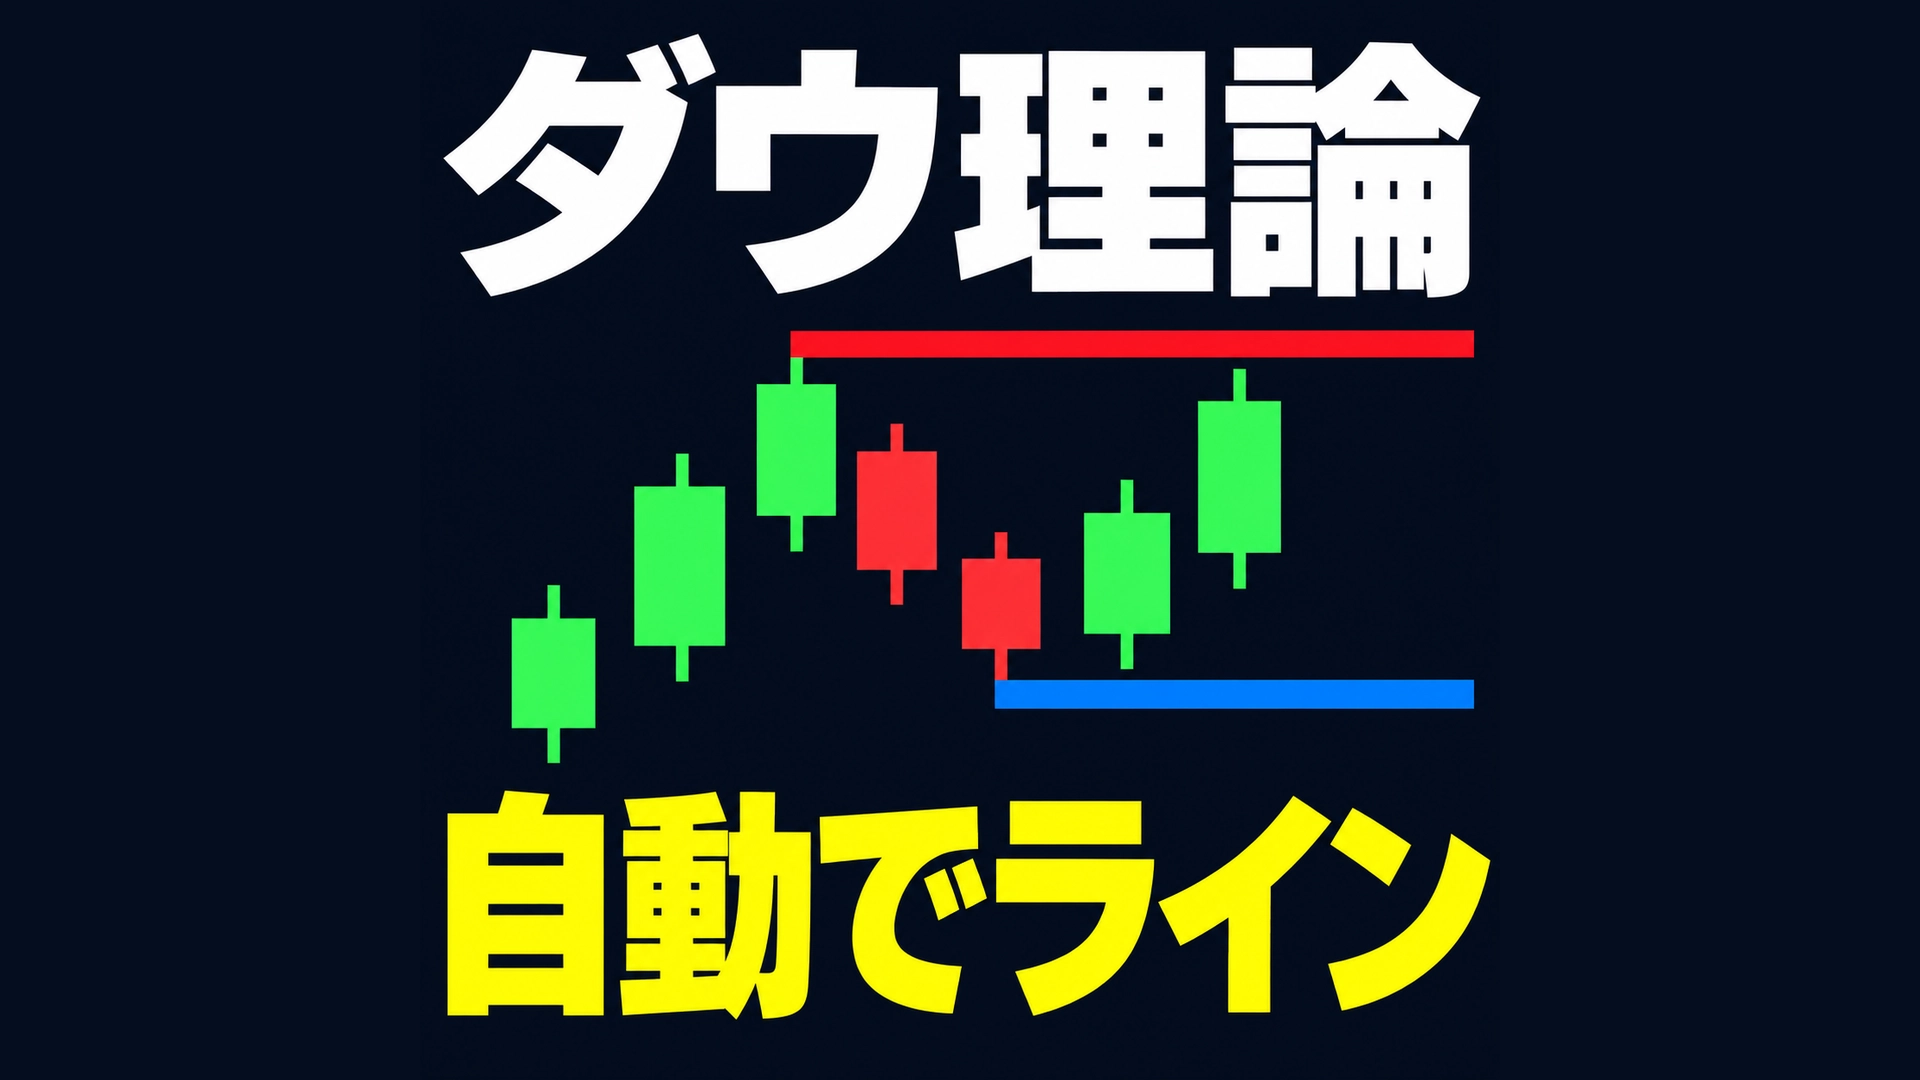
Dow Theory, not sure where the high and low are? Free indicator that can judge by line color [MT5 version released]
Hello, Ama Papa FX craftsman here.
We often hear, “Let’s look at the trend with Dow Theory.” The reasoning is simple, but when faced with an actual chart, hands stop. Have you ever experienced that?
This time, we will introduce the points where you tend to stumble with Dow Theory anda free indicator (MT5 version) that lets you judge the line coloras to line color.
■ Dow Theory trend judgment is only two things
The way to see the trend in Dow Theory is very simple.
・Uptrend: The highs are making higher highs, and the lows are making higher lows
・Downtrend: The highs are making lower highs, and the lows are making lower lows
And the trend is considered to continue until this pattern breaks.
What you look at are just four items: the most recent high and low, and the high and low just before that.
■ Then why is it difficult
Even if the theory is simple, in practice you get confused at the following points.
1. You hesitate where to take as high/low
If you pick up even small hills and valleys, you can’t tell whether it is a higher high or a lower high. Standards vary by person and by mood on that day.
2. You end up comparing four prices in your head
Comparing highs with highs and lows with lows is easy on one chart. However, each time you switch currency pair or time frame, you have to start over again.
3. It’s hard to notice the moment it collapses
If you’re convinced the trend continues, you tend to overlook that the lows have been broken.
■ Delegate high/low judgments to an indicator
This all-in-one is the “SEI_Dow_Line.”
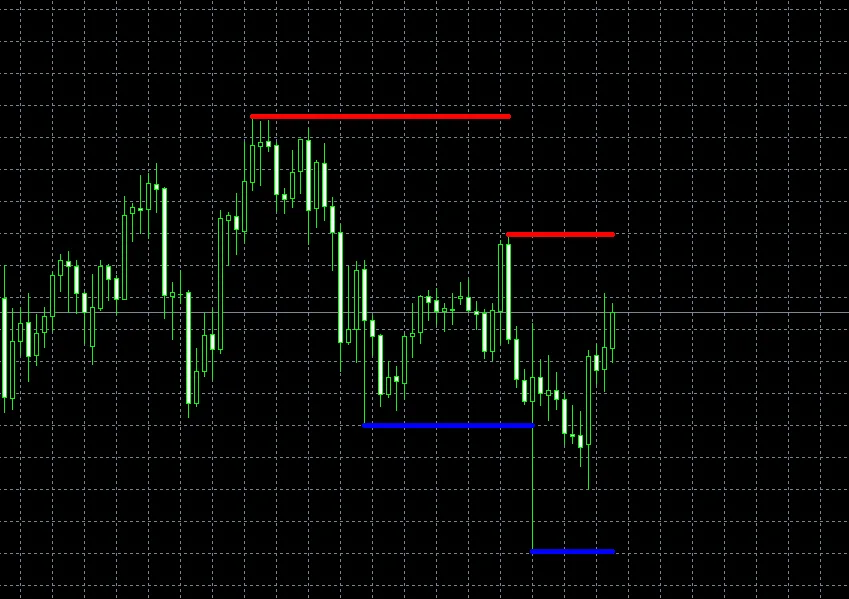
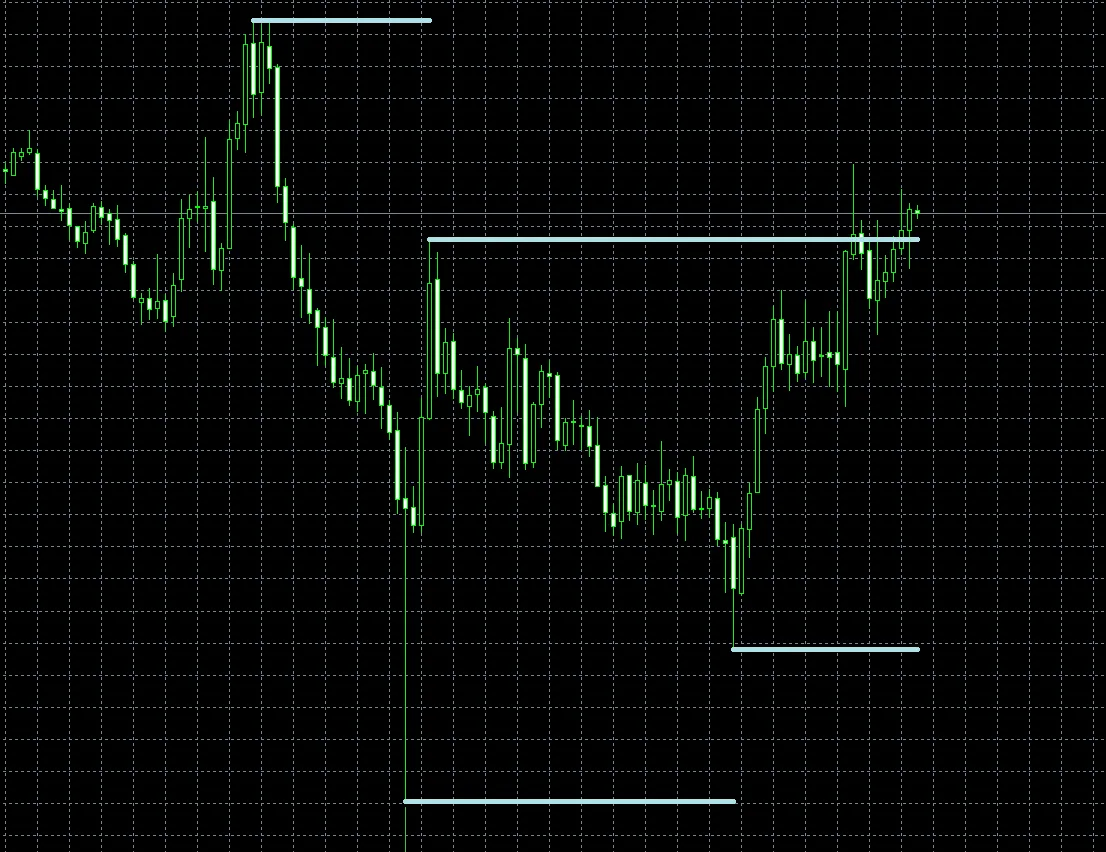
When placed on the chart, it automatically draws four lines for the most recent high and low and the one before them, and displays whether Dow Theory is in effect by color.
━━ Red and━━ Blue lines → Dow Theory is in effect
━━ Light blue line → Dow Theory is not in effect
Highs and lows always come from the same criterion (ZigZag), so they do not drift with mood. If you switch time frames, the highs and lows for that time frame are redrawn.
If you switch from higher time frames in order, you can grasp, just by color, situations like “the daily is valid, the 4-hour is broken.”
■ MT5 version is now available (free)
This indicator had been released only for MT4 so far. Thanks to you, the MT4 version has surpassed 2,400 downloads in total.
Recently, someone using MT4 asked, “I want to use it on MT5 as well,” so we created an MT5 version. Like the MT4 version, it is free to use.
▼ [MT5] Dow Theory成立 display & automatic line display indicator (free)
https://www.gogojungle.co.jp/tools/indicators/87601
▼ For those using MT4 (free)
https://www.gogojungle.co.jp/tools/indicators/28740
■ Things to know when using
・This is not a buy/sell signal or alert. It is a tool to view the trend condition. Please make entry decisions using your own method in combination with this.
・Because ZigZag is used to obtain highs and lows, when new highs and lows appear, the lines are redrawn.
・What is shown are the most recent highs and lows. It is not swing highs and swing lows. If you adjust ZigZag settings to avoid picking up minor hills and valleys, you’ll be closer to swing highs and swing lows.
・It does not guarantee perfect Dow Theory.
Dow Theory is a foundational way to view market direction. Let the indicator handle the highs and lows, and use the time to calmly confirm, “which way is it moving now.”
If you have observations or requests after using it, please feel free to let us know from the product page’s “Community.”