

[Trading Edition] Episode 6: The lines on the chart show traces of "the crowd's pain and regret." What are the traps of breakouts that professionals target? ??

In the previous article, I talked about how a chart is a record of the battle between buyers (bulls) and sellers (bears), and that you should not overlay your hopeful expectations on it.
This time, I will delve a little longer and deeper into the truth of “support (lower price support line)”—the most fundamental yet most powerful weapon among chart analyses—and “resistance (upper price resistance line).”and“the truth of resistance (upper line).”
When you draw a horizontal line on a chart, have you ever asked yourself, “Why does the price stop here?”
It’s not just because it’s a past high or low. Behind that line, the vivid emotions of people swirl.
? The market is a ball that bounces between the floor and the ceiling
Dr. Elder explains support and resistance very clearly by likening them to a “ball.”
If you drop a ball to the floor, it bounces back. Conversely, if you throw the ball upward, it hits the ceiling and comes down. The market is the same.
Support (the floor):The level where price that has fallen is bounced back by the buying power that thinks “it won’t go any lower.”
Resistance (the ceiling):The level where price that has risen is pushed down by selling pressure that thinks “it won’t go any higher.”
By simply connecting prominent highs or lows with a horizontal line on the chart, you can see this “floor and ceiling.” However, why do prices stop precisely at these floors and ceilings created months or even years ago?
? The line’s true nature is memory, pain, and regret
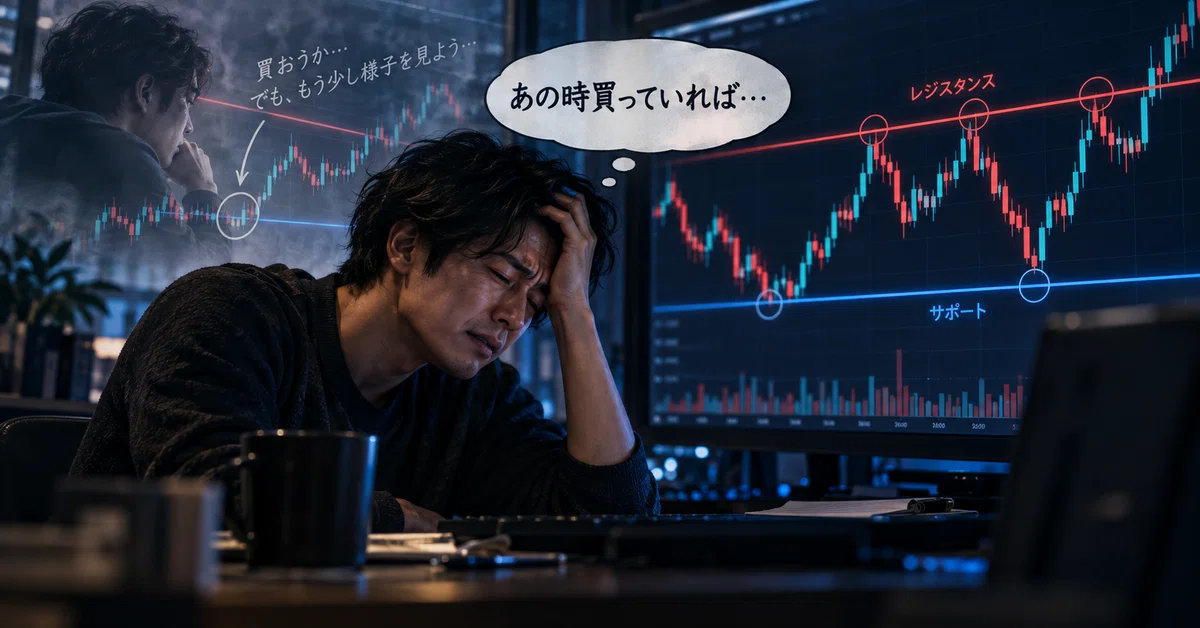
The real reason why support and resistance exist is thatthe majority of traders feel pain and regret at that price level.
Memories of past markets prompt us to trade, and they create new supports and resistances. For example, suppose a market fell to a certain price and then rose sharply. When it approaches that price again, people with the following emotions flood the market.
People who missed the chance to buy and regret it:“If I had bought back then, I would have bought at that price (the support) next time for sure,” and they wait for it to drop to that level again.
People who feel pain from short selling:“What I sold there was a mistake. The unrealized loss is painful. If it comes back to that price, I’ll cover at my cost and escape,” they pray.
In this way,the orders of people who want to buy out of regret and those who want to escape pain (buy back) concentrate at that price level, making it a strong support (floor). Resistance (ceiling) forms under exactly the same psychology, this time with the emotions of people who want to sell and those who want to escape pain (to exit by selling) concentrating there.
In other words, horizontal lines drawn on charts are not inert lines; they are “scars etched with the pain and regret of the crowd.”
? The amateur is hunted by the “false breakout”

Understanding the dynamics of support and resistance reveals why amateurs keep losing.
The prime example is how they respond to a “breakout (movement that penetrates the floor or ceiling).”