
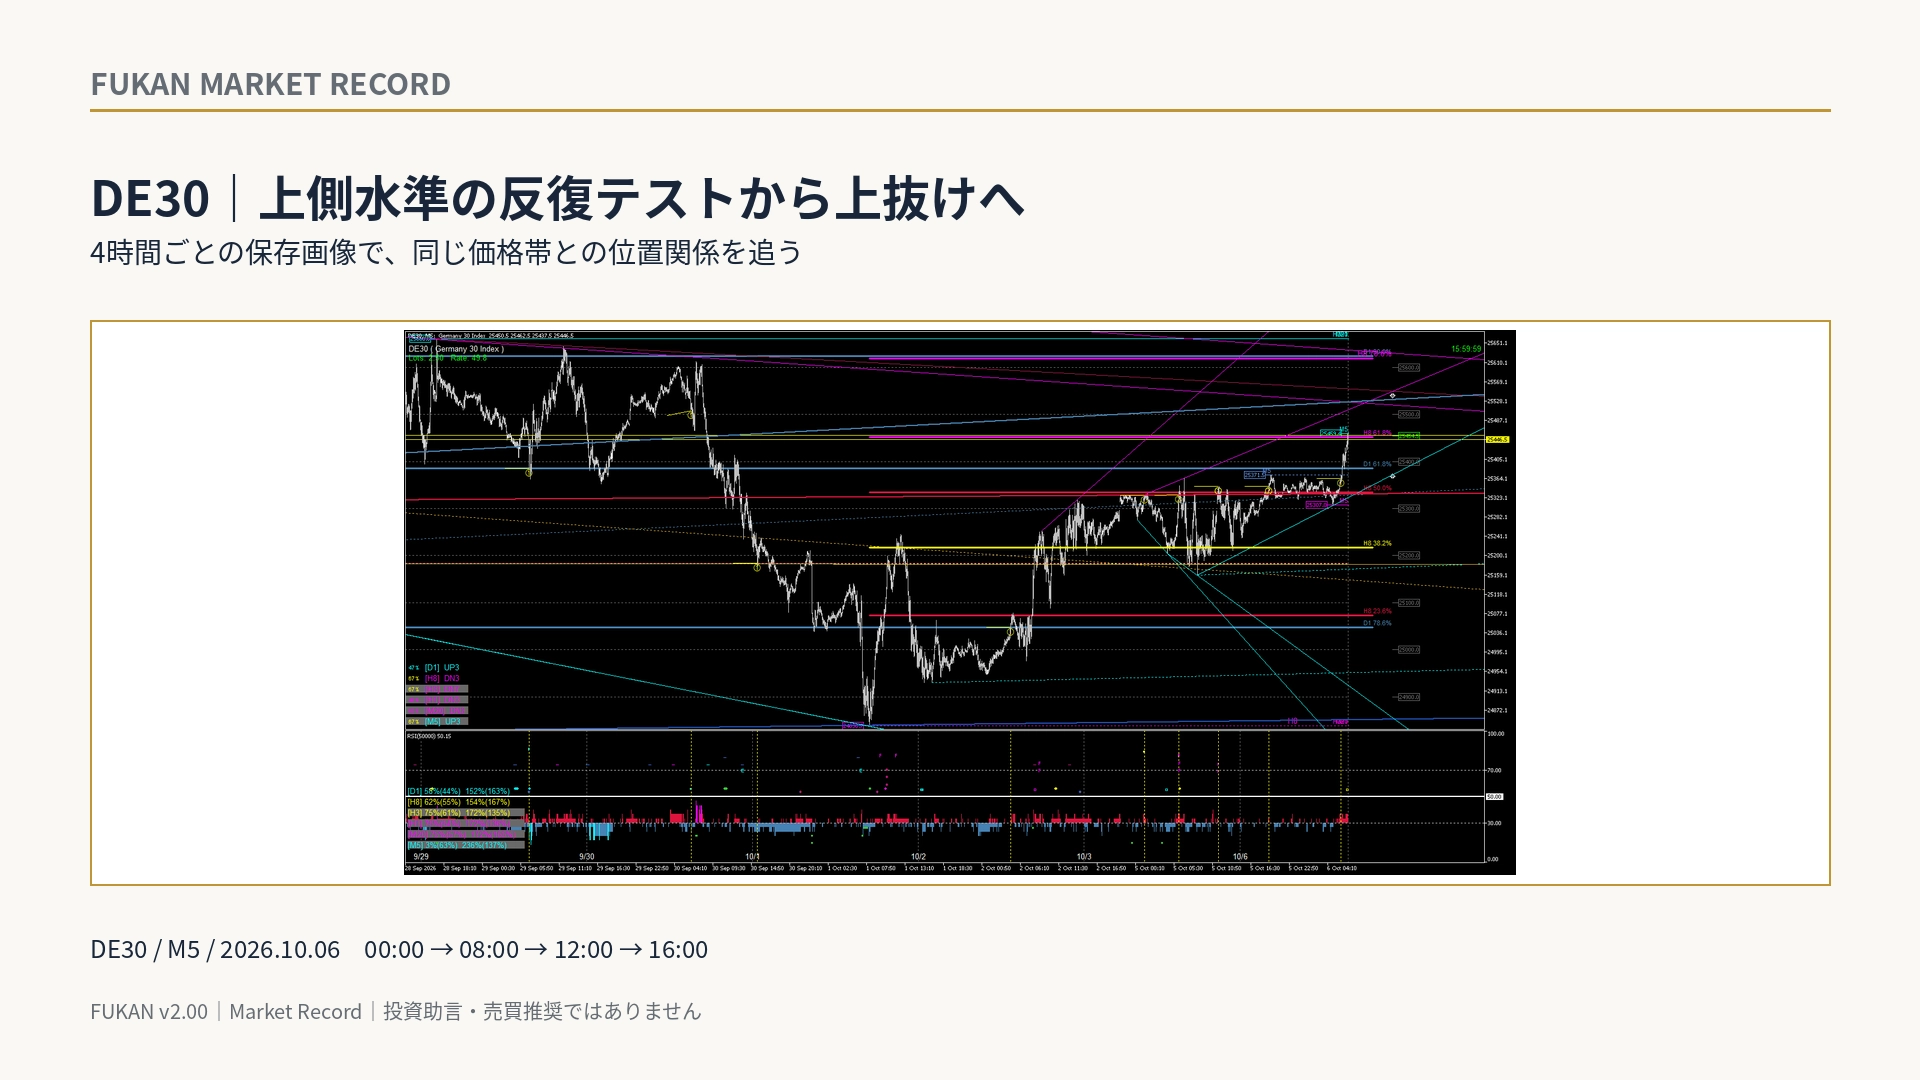
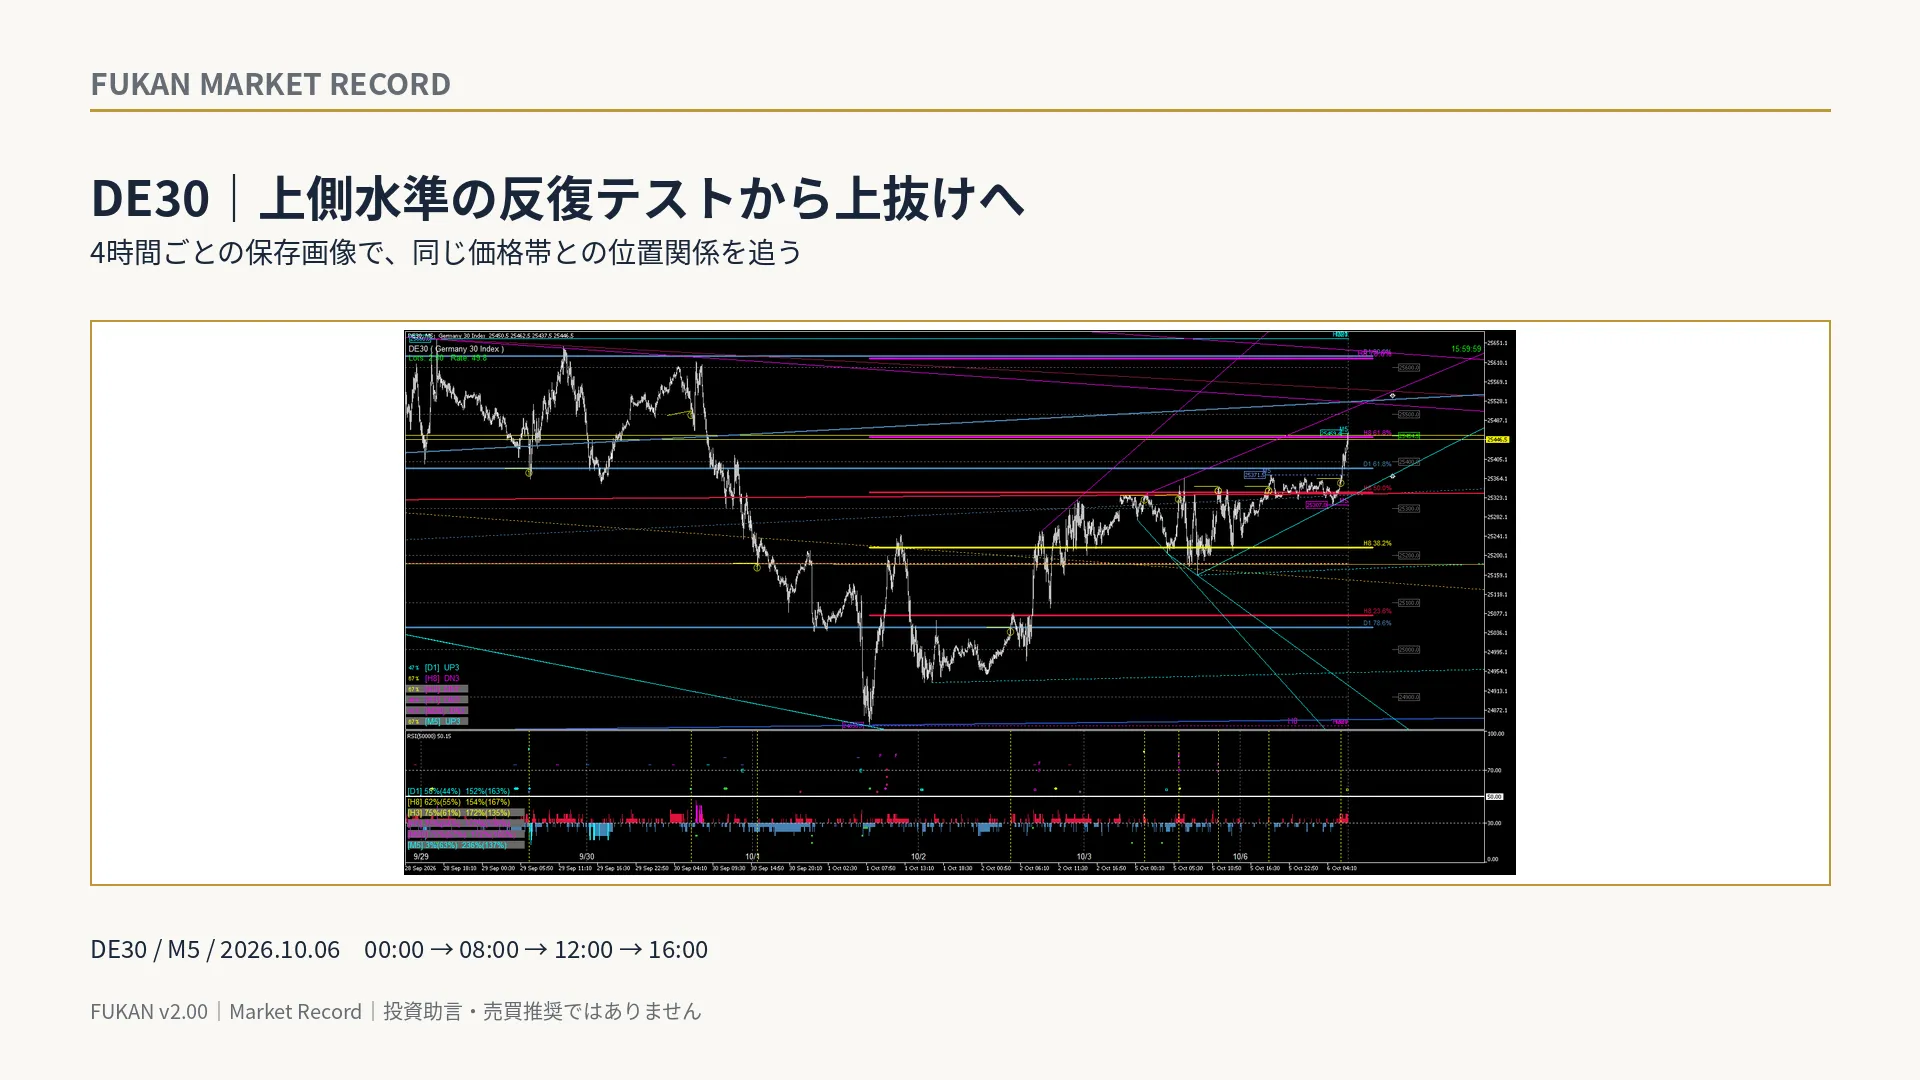
DE30, after repeatedly testing the upper level and breaking above—changes in the relative position seen on the 4-hour live chart
DE30, After repeatedly testing the upper level, breakout — Changes in positional relationships over a 4-hour chart
This Market Record is DE30 as of October 6, 2026.
Rather than capturing a single moment, we line up saved images at 00:00, 08:00, 12:00, and 16:00 to track how the price relationship to the same upper level has changed.
00:00 | Rebound approaches the upper horizontal band
From a large decline, the DE30 had approached the upper price band where several horizontal lines overlapped at the time of the 00:00 image.
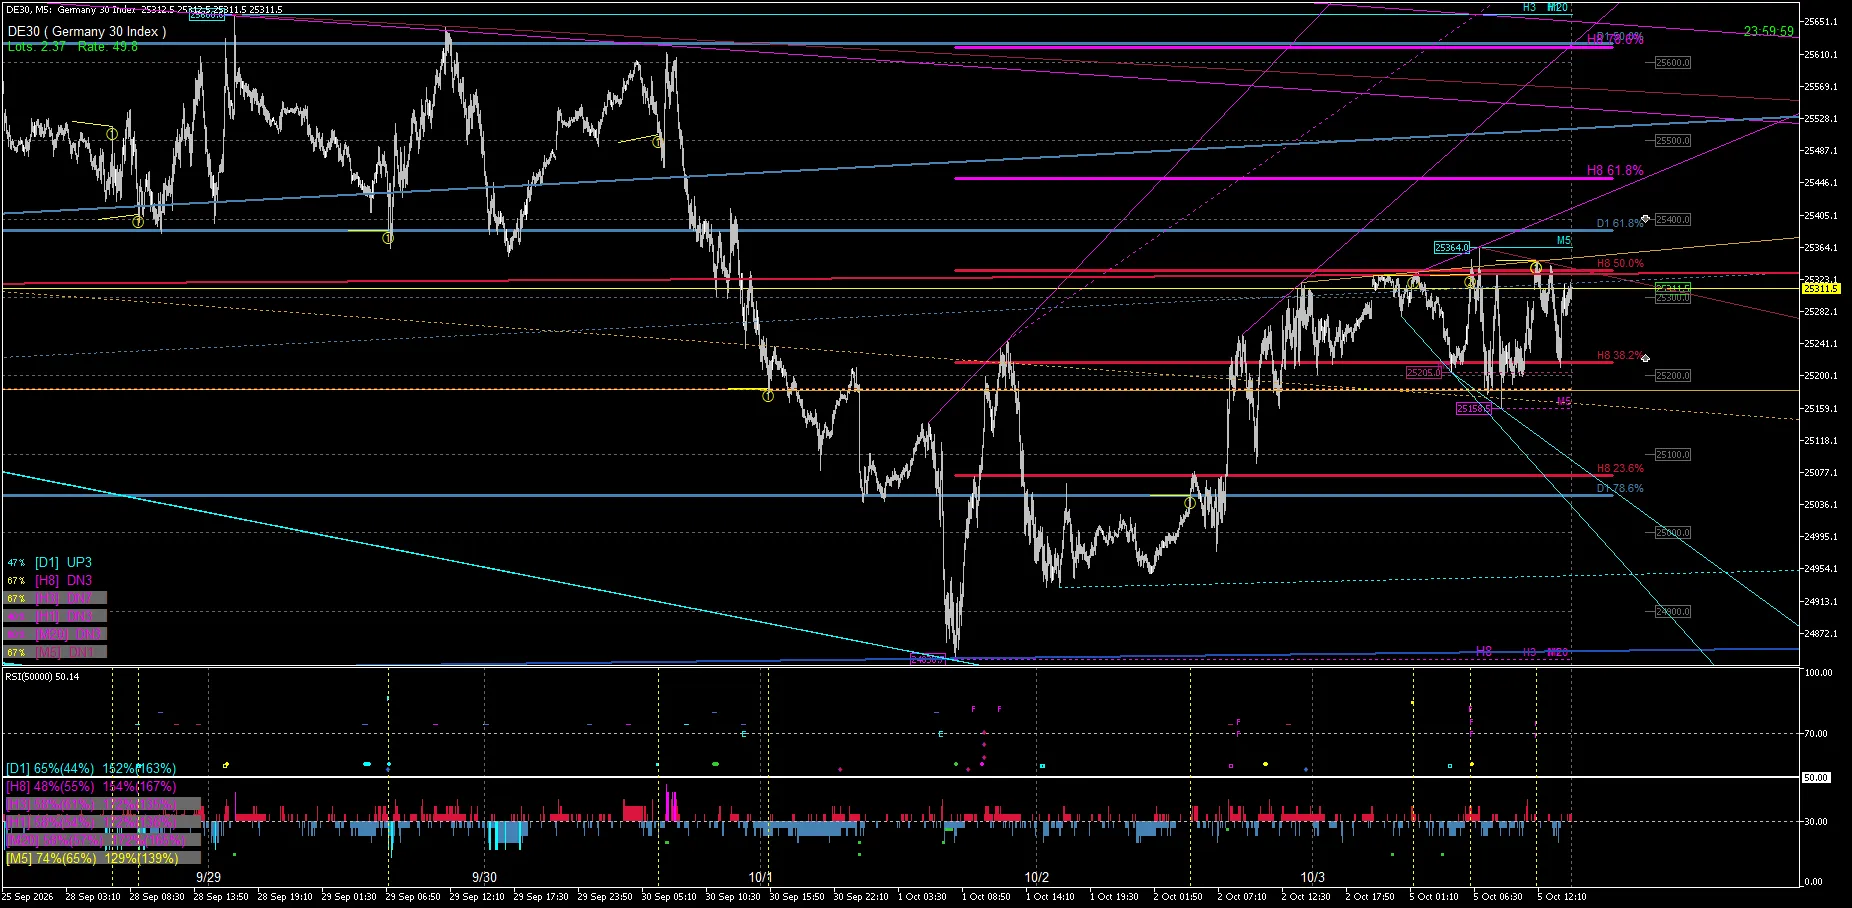
What is important here is not predicting that the price will reverse at this line. In FUKAN, multiple timeframe lines are overlaid on the same M5 chart to confirm how the current price is located relative to the structure.
08:00 | Staying near the same price band
Even in the 8-hour image, the price remains not far from the upper level and continues in the high price area.
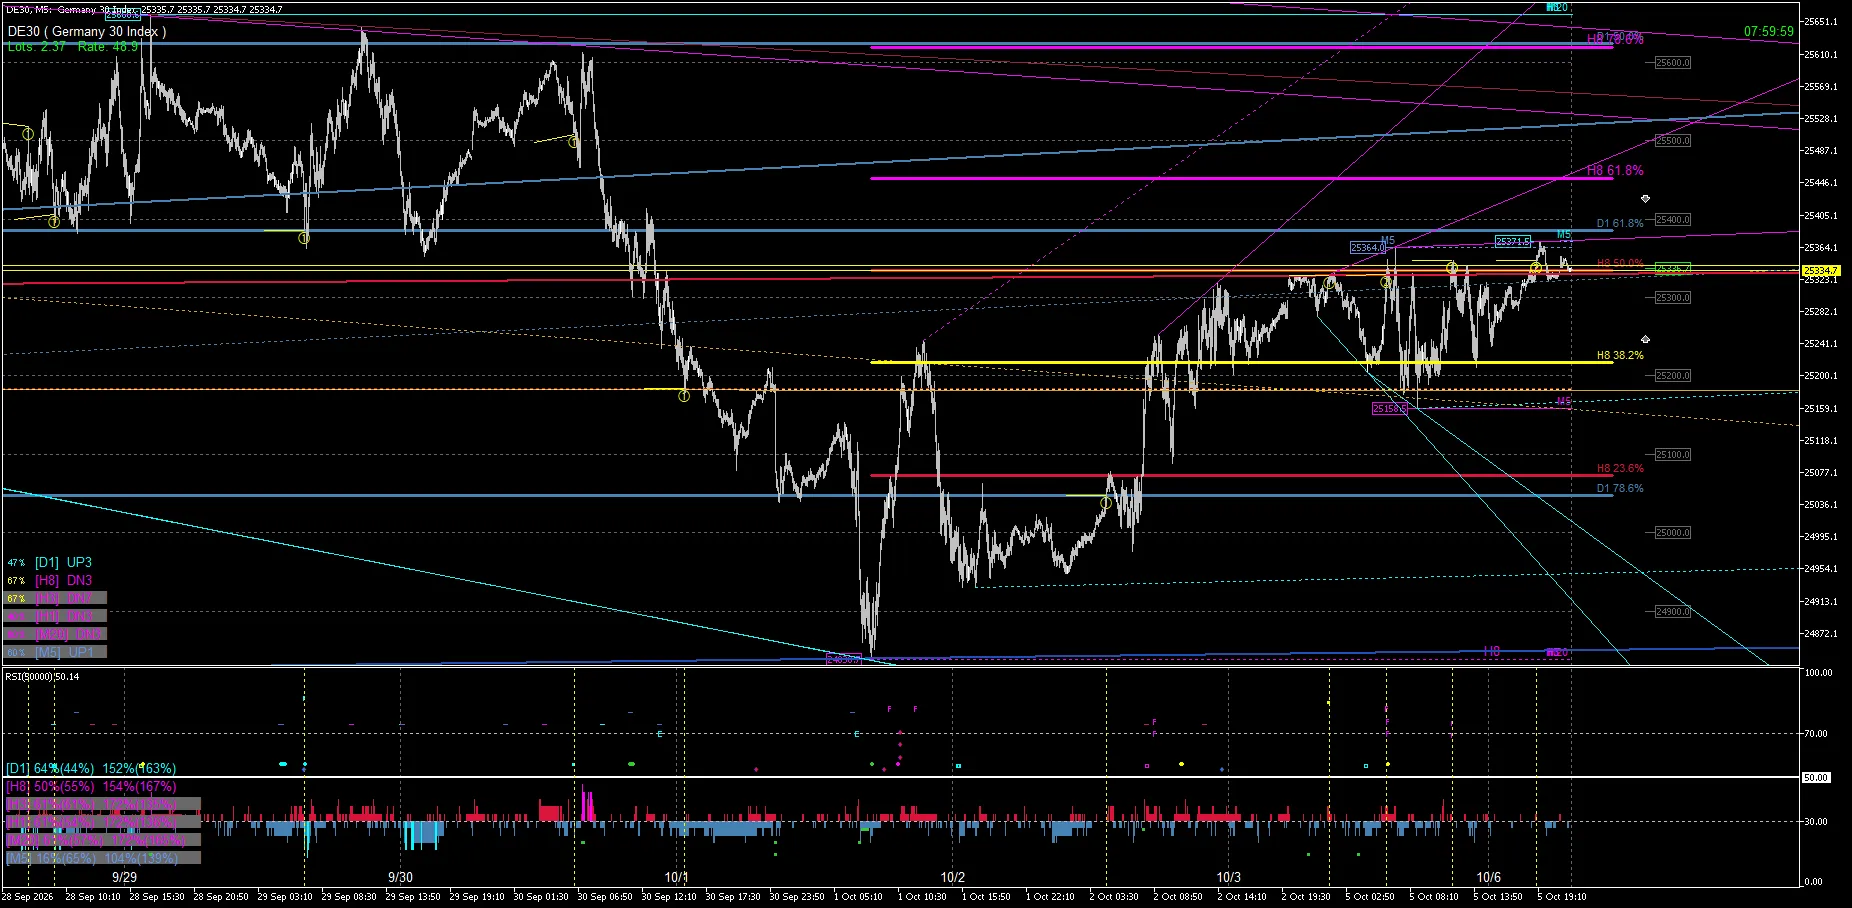
Not only whether it touched it once, but also whether it stayed near the same band as time passed, or moved away clearly, provides information different from a single still image.
12:00 | Re-testing the upper level
In the 12:00 image, the price continues to hold in the high-price area and tests the upper level again.
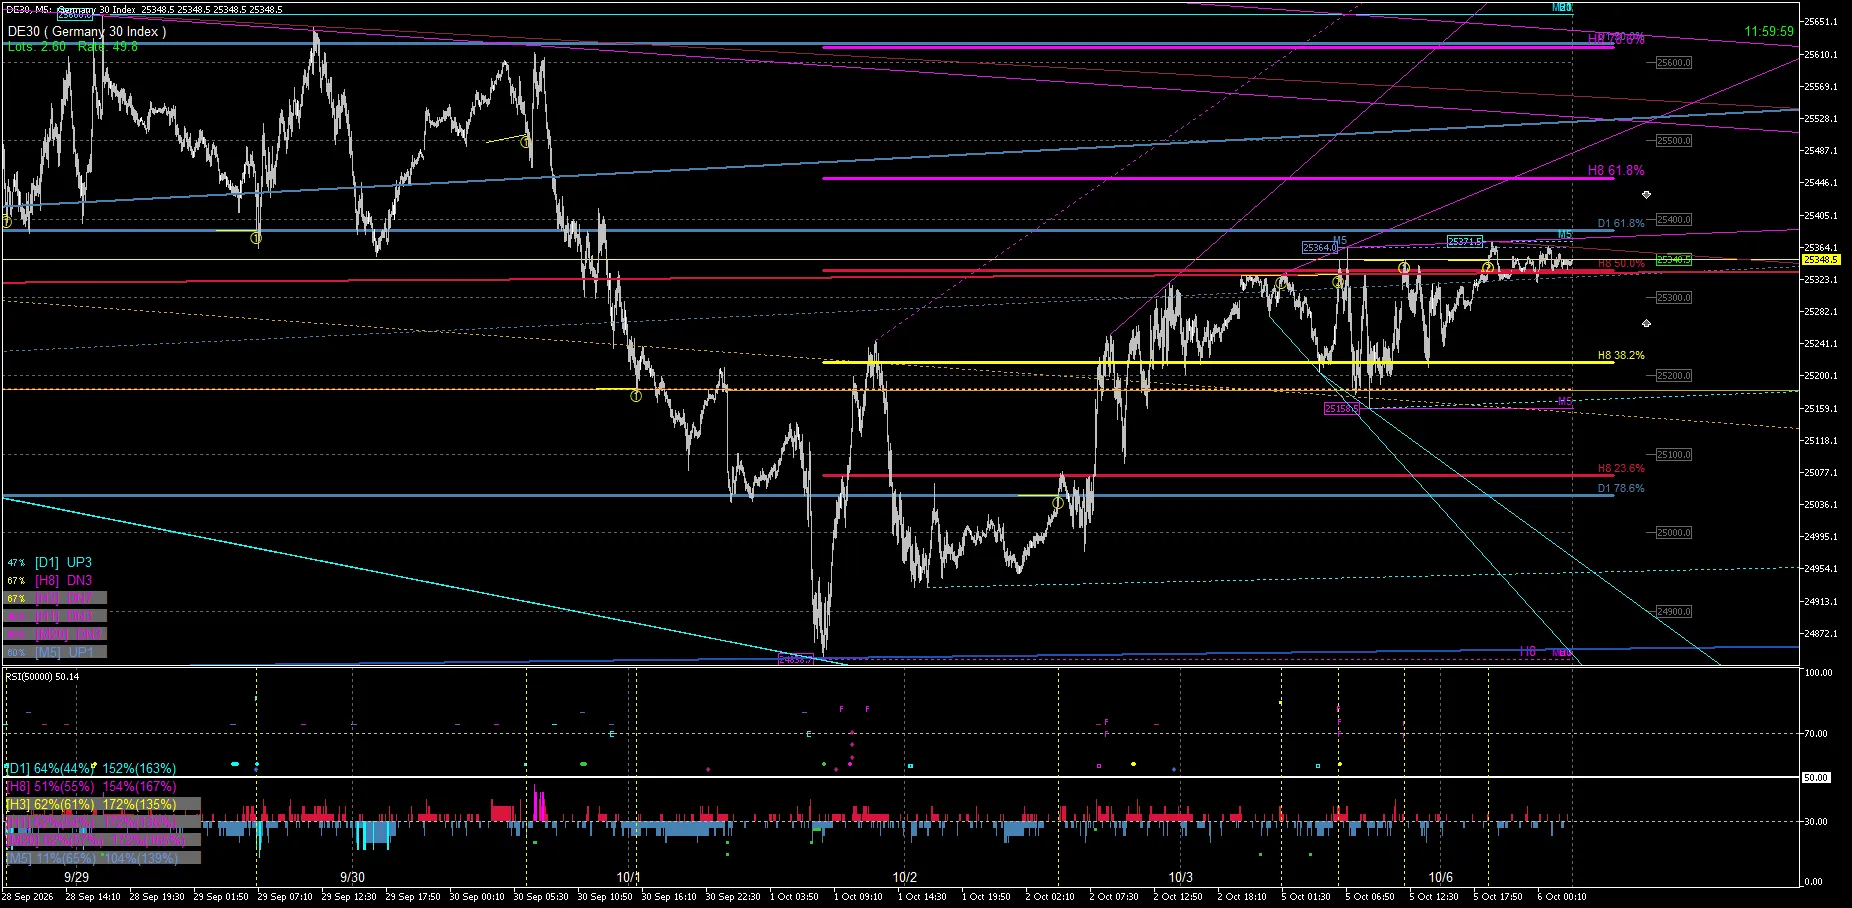
In FUKAN's Market Record, rather than only looking at the results afterward, the saved time series is laid out as-is. This time as well, the sequence of "approach → high-area maintenance → re-test" can be confirmed in the image.
16:00 | Breaks through the previously observed upper level
The 16:00 image shows the price breaking above the upper level that had been repeatedly approached, moving closer to a higher technical level further up.
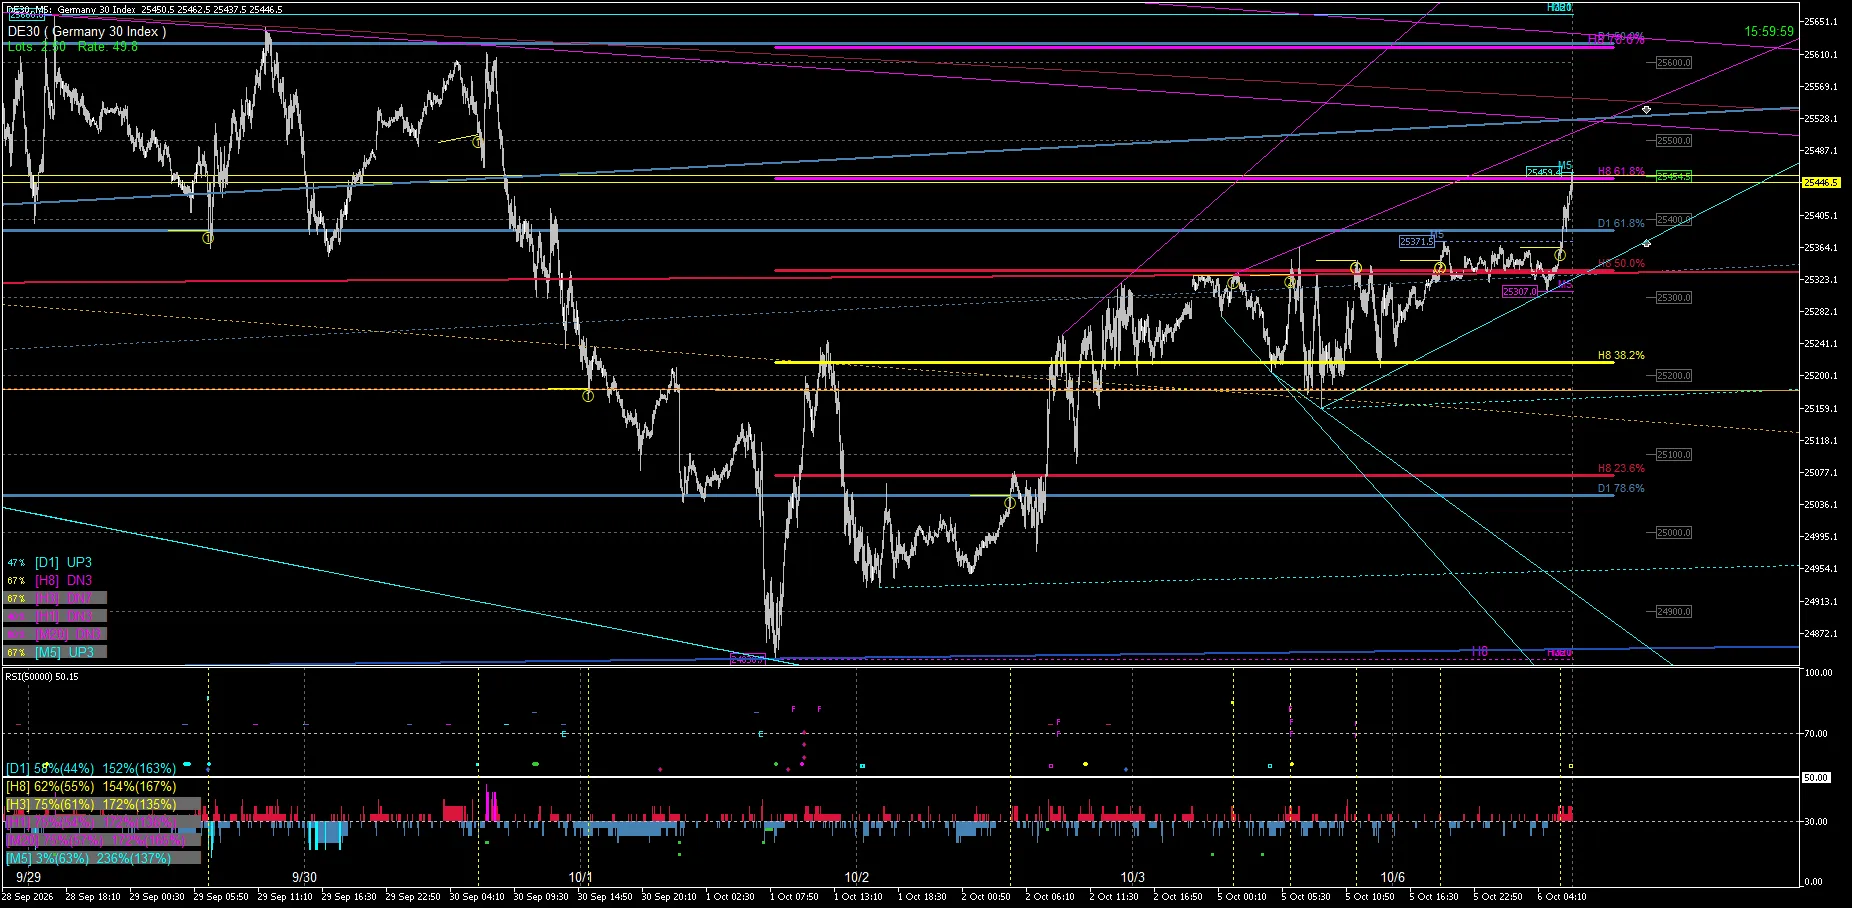
This does not mean that the breakout could be predicted. By juxtaposing images from 00:00 to 16:00, it records that the relationship with the same price band changes over time.
The meaning of watching time progress in FUKAN
FUKAN can project the structures of multiple timeframes—M5 / M20 / H1 / H3 / H8 / D1—onto a single chart.
Therefore, rather than looking at a single line in isolation,
• where the current price sits among multiple levels
• how long it stayed within the same band
• whether it touched and then moved away, or re-tested
• whether it broke through afterward
is useful for tracking time evolution.
This DE30 record is not an example of "a line touched once," but an example of "repeatedly testing the same upper level over time, with the subsequent change in positional relationship."
Summary
On October 6, 2026, DE30 approached the upper level at 00:00 and stayed in the high-price area at 08:00 and 12:00. By 16:00, the price had moved up toward that upper level.
In Market Record, we do not select only rebound examples or only breakout examples; we preserve the elapsed time as it happened.This article is market observation and analysis, not investment advice or buy/sell recommendations. It does not guarantee future price movements, profits, or win rates.