

[GOLD Price Movement Analysis] Round trip of $76. Do not sell at the lower end of the range, do not buy at the upper end | October 6, 22:30
Gold on October 6, 2026, after a sharp drop made a strong rebound and was pushed back again by night. The day's characteristic is not only that it changed from a strong decline to a strong rise. When overlaid with several days of price movements, it is important to read the situation as bouncing back and forth within a wide range.
This article bases its confirmation on confirmed candles up to 22:30 JST, checks the environment with hourly charts since October 1, and examines the movements in detail on the 6th with a 5-minute chart. Before hopping onto short-term momentum, let's organize where the current price sits within the range.
■ In higher timeframes, the range. See the upper and lower price bands concretely
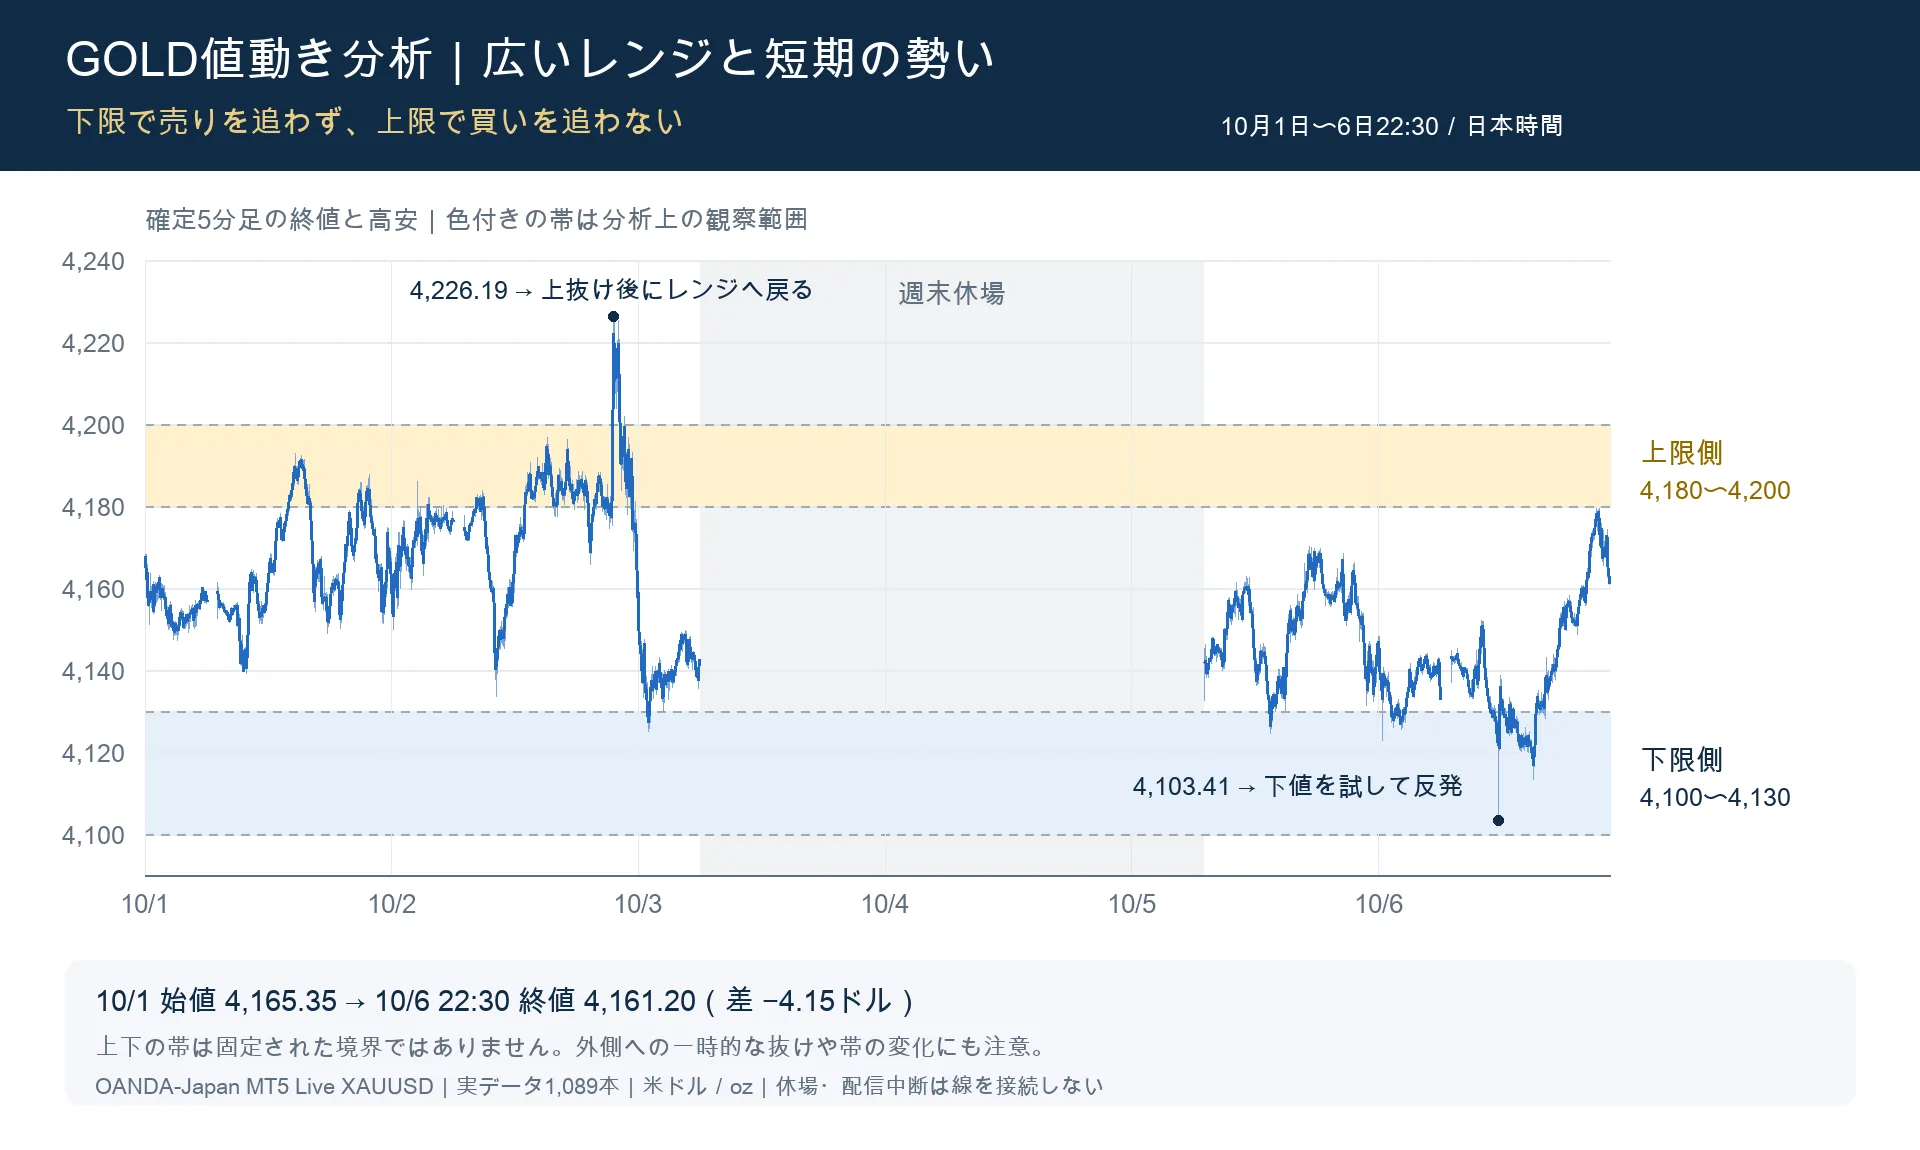
The opening price on October 1 was $4,165.35, and the closing price at 22:30 on the 6th was $4,161.20. Even if there is large movement in between, the difference from the starting point is about $4. There are reversals from the high zone to the low zone, and it is necessary to separate these from a sustained one-directional trend.
This time, I will organize the upper bound observation band around $4,180–$4,200 and the lower bound around $4,100–$4,130. On the upside, it reached $4,192.87 on the 1st and $4,196.68 on the afternoon of the 2nd. On the downside, it rebounded at $4,125.10 on the 3rd and $4,124.42 on the 5th, and on the 6th it expanded lower to $4,103.41.
This is a rough guide summarizing the reacting prices for analysis and is not a fixed upper and lower limit. After piercing up to $4,226.19 on the 2nd, it fell to $4,125.10 on the 3rd. Even if it temporarily exits the range, it can return, and the lower band is also widening. Do not judge solely by a simple horizontal box.
■ Today, even a range of 76 dollars can involve range-bound reversals
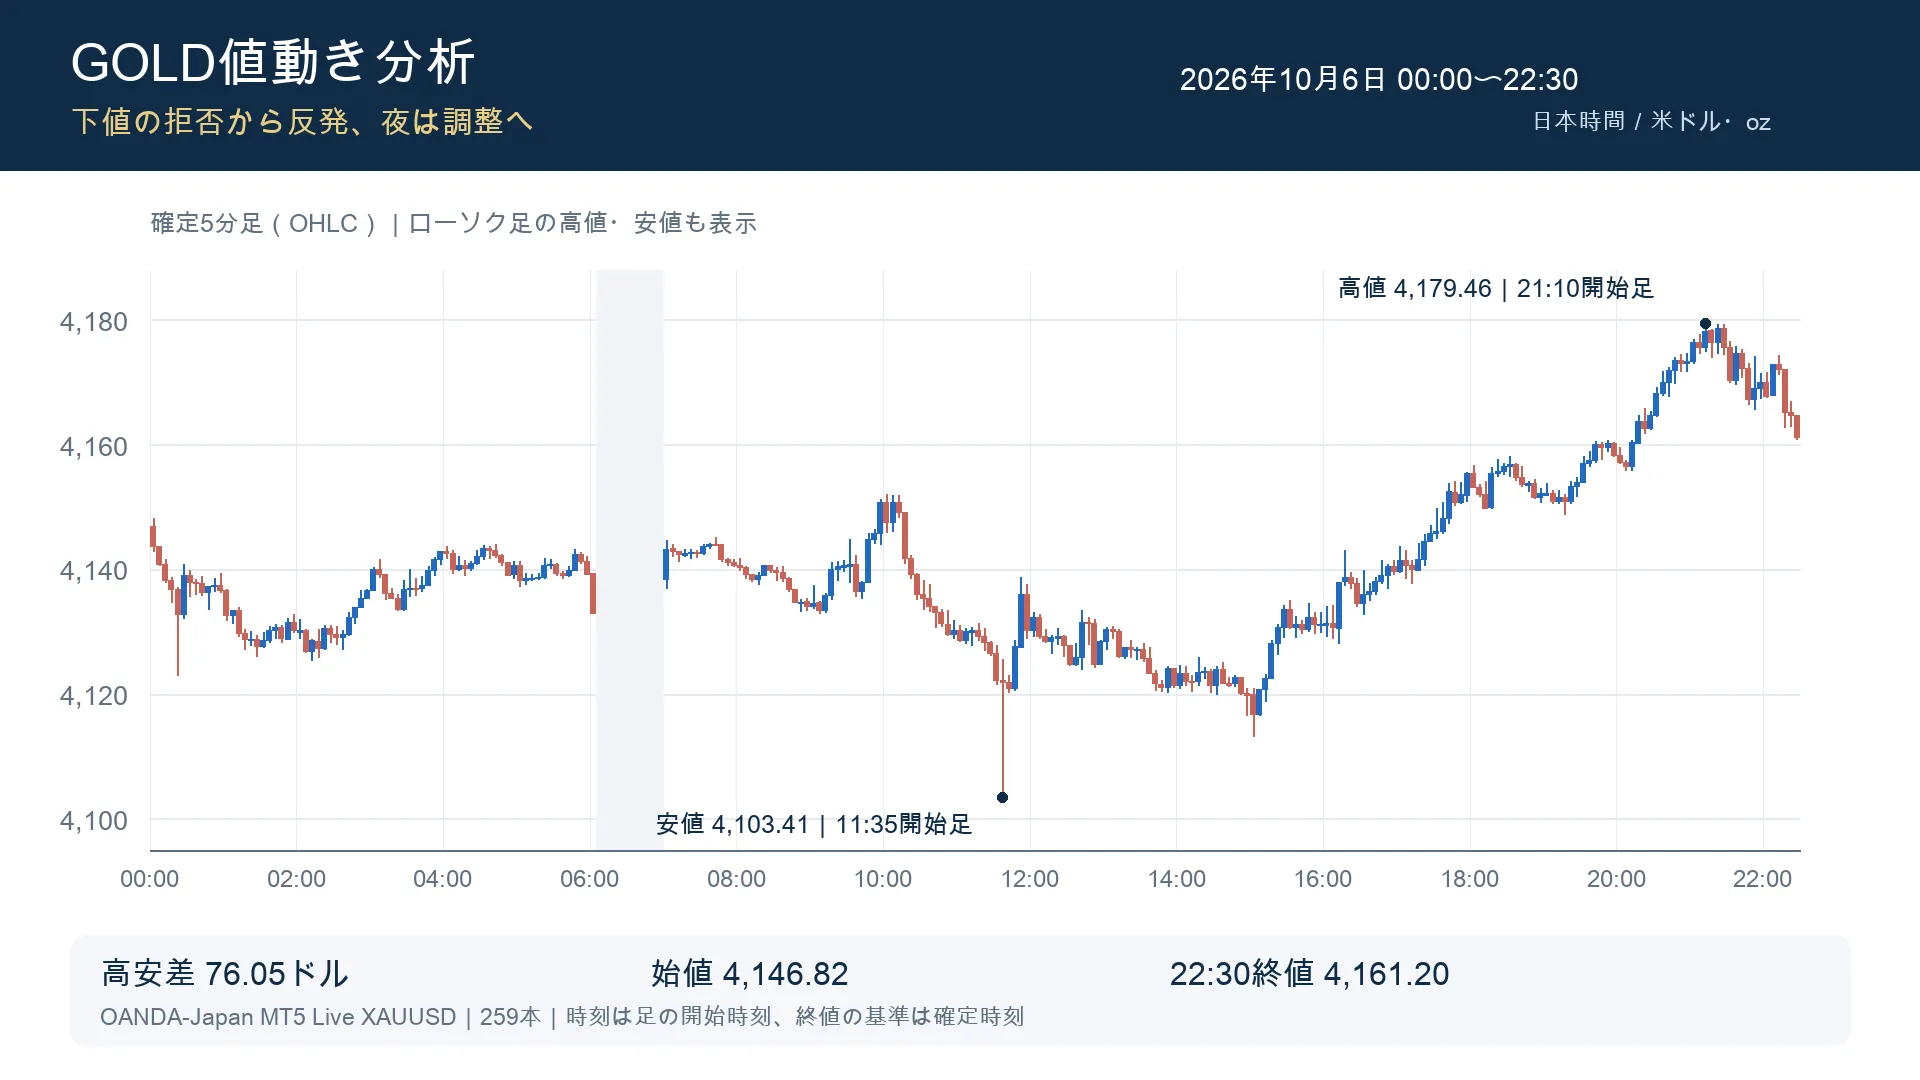
The opening price on the 6th was $4,146.82, the low was $4,103.41, the high was $4,179.46, and the closing price at 22:30 was $4,161.20. The high-low spread is $76.05, but the rise from the opening is $14.38. The magnitude of the price range does not necessarily mean a sustained one-direction move.
A five-minute chart starting at 11:35 shows a drop from $4,122.22 to $4,103.41, settling at $4,121.90. It is a long lower shadow that recovers about $18 from the low. Later, in the 15:00 area, it fell to $4,113.21, but rebounded in the afternoon and reached $4,179.46 on the starting bar at 21:10. By 22:30, it had retraced about $18 from the high.
A plunge toward the lower bound, a rebound, and a correction near the upper bound. If you view it in this order, there are intervals on the lower timeframes that look like strong trends but are actually moves from one end of the higher-timeframe range to the other.
■ Why I want to avoid shorts at the lower range
When the price falls sharply from $4,130 to $4,110, it may look like “there's still selling pressure” on the 1-minute and 5-minute charts. However, viewed with a broader perspective, it is the lower bound side. If you short again here, the range to the support band is small, and if it rebounds, you will face the return directly.
The move toward $4,103.41 on the 6th is a concrete example. If you chase selling by only looking at new lows, you will be exposed to a move back up to $4,121.90 within the same five-minute bar. The strength of the downward momentum and being in a good selling position are not the same thing. Near the lower bound, first refrain from chasing shorts and wait for a rebound or for the breakout to settle.
■ The same caution applies to longs at the upper bound
Conversely, when price rises from around $4,170 to around $4,180 and陽線 continues, you should also think carefully about going long just because of the trend. There are times when the upper bound is near and the room for upside is limited, causing stronger pullback.
The afternoon rebound on the 6th was a strong short-term rise, but after hitting $4,179.46, it corrected to $4,161.20. Buying into the upper bound becomes more susceptible to this correction. Don’t just say “it's going up, so buy”; check how many dollars remain to the resistance band on the higher timeframe.
■ Distinguishing the trend in the lower timeframe from the environment in the higher timeframe
Even if the highs and lows on the 5-minute chart are consecutively higher, if the hourly chart is approaching the upper bound of the range, you cannot use that ascent as a direct buying signal. A strong decline that makes lower lows is the same story if it remains within the range lower bound. The lower timeframe is a tool to time entries, and it does not justify ignoring the position in the higher timeframe.
The order of confirmation is: check the bands on the hourly chart, observe the reaction and the state after a breakout on the 15-minute chart, and finally search for an entry on the 5-minute chart. Since the range center has not reached either band, there is an option to wait rather than forcing a direction.
This completes today’s environmental assessment. In the “Read more” section after registration, I will organize conditional strategies for buying at the lower bound, selling at the upper bound, and waiting strategies if the range is broken. Let’s continue to monitor price zone changes next time as well.