

[Today's Practical Example] Publish post-sign movement | Maasan Trend Arrow Free for the first month now
In the previous article, we introduced the update of Maasan Trend Arrow.
This time, not only an explanation but alsowe will show, using today's price action, what signals appeared and what price movements followedwith the help of charts.
And finally, there is a notice for those who want to start using Maasan Trend Arrow.
You can try it now with a free first month.
First, let's look at today's chart.
Today's Signal ①: “Red↓” on the 1-minute chart during a downtrend
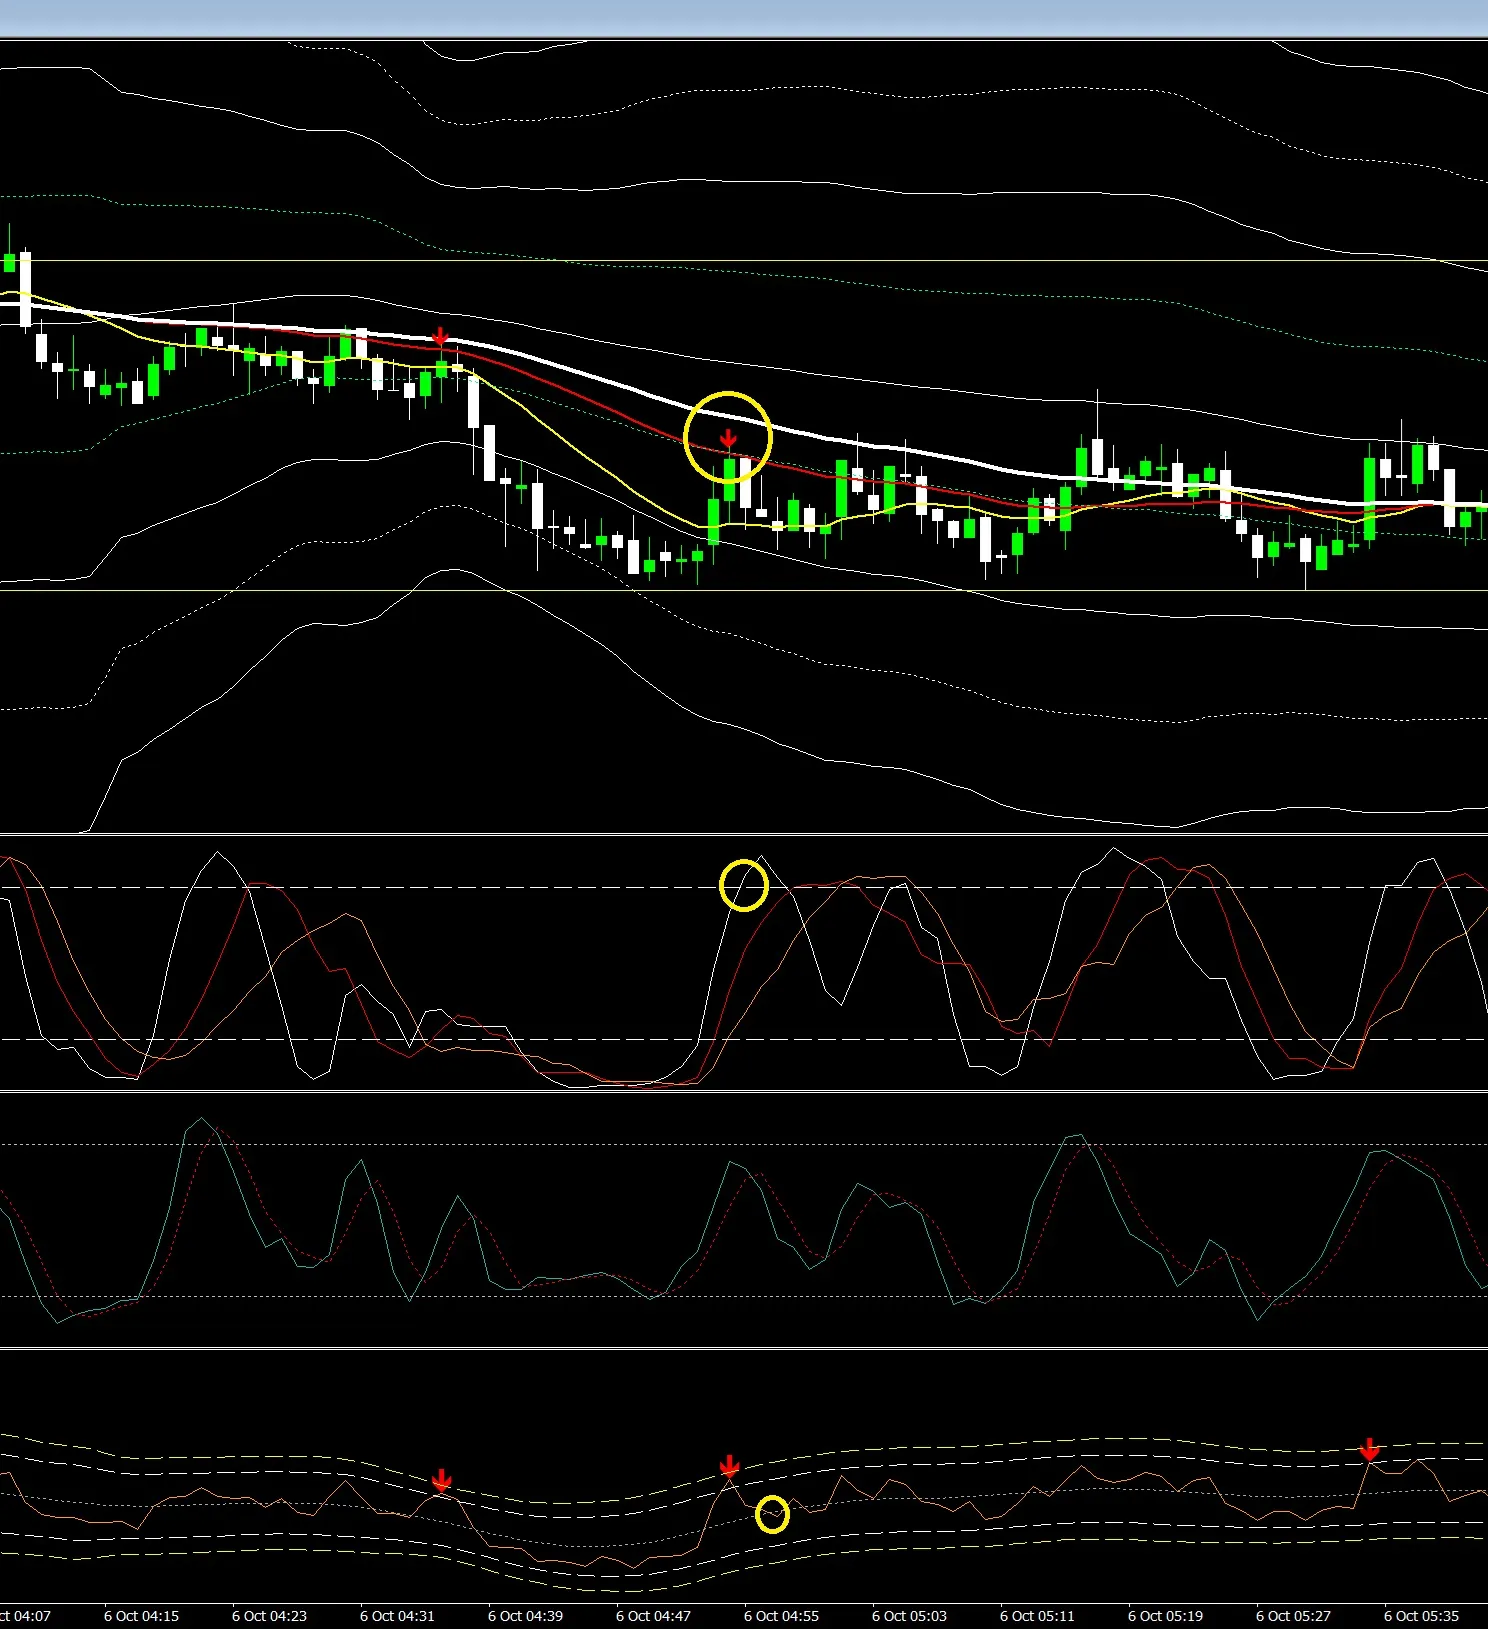
What I want you to pay attention to first is the part surrounded by a yellow circle in the image.
On top of the candlesticks,red↓ signalis displayed.
In this situation, I am not simply looking at the red arrow alone.
Looking at the entire chart, from the position relationships of moving averages, it is clear thatthe market environment tends to favor selling.
And pay attention to the RCI circled with a yellow ○ as well.
Furthermore, at the bottom Maasan Trend Arrow, there is a red↓ highlighted at a point that matches the criteria.
In other words, what I am looking at is not simply
“sell because red↓ appeared”
but something more nuanced.
“Is the market direction aligned with multiple conditions?”
That is what I am checking here.
In fact, after this signal appeared, when you look at the chart, the price indeed moved downward subsequently.
Scenes like this are one of the patterns I focus on when using Maasan Trend Arrow.
However,the specifics of which conditions to confirm for entry and where to take profits are content limited to purchasers, so please keep this to restricted-access content and not in a public article.
What is important is
not the arrow itself, but “why I paid attention to this arrow.”
Once you understand this, you will be able to distinguish between signals you want to aim for and signals you should pass on, even with the same red↓.
The previous red arrow resulted in a win, but I did not actually enter.
You can trade with arrows, but I enter only at points that meet the conditions to further improve the win rate.
Today's Signal ②: Now in the upward direction, “Blue↑”
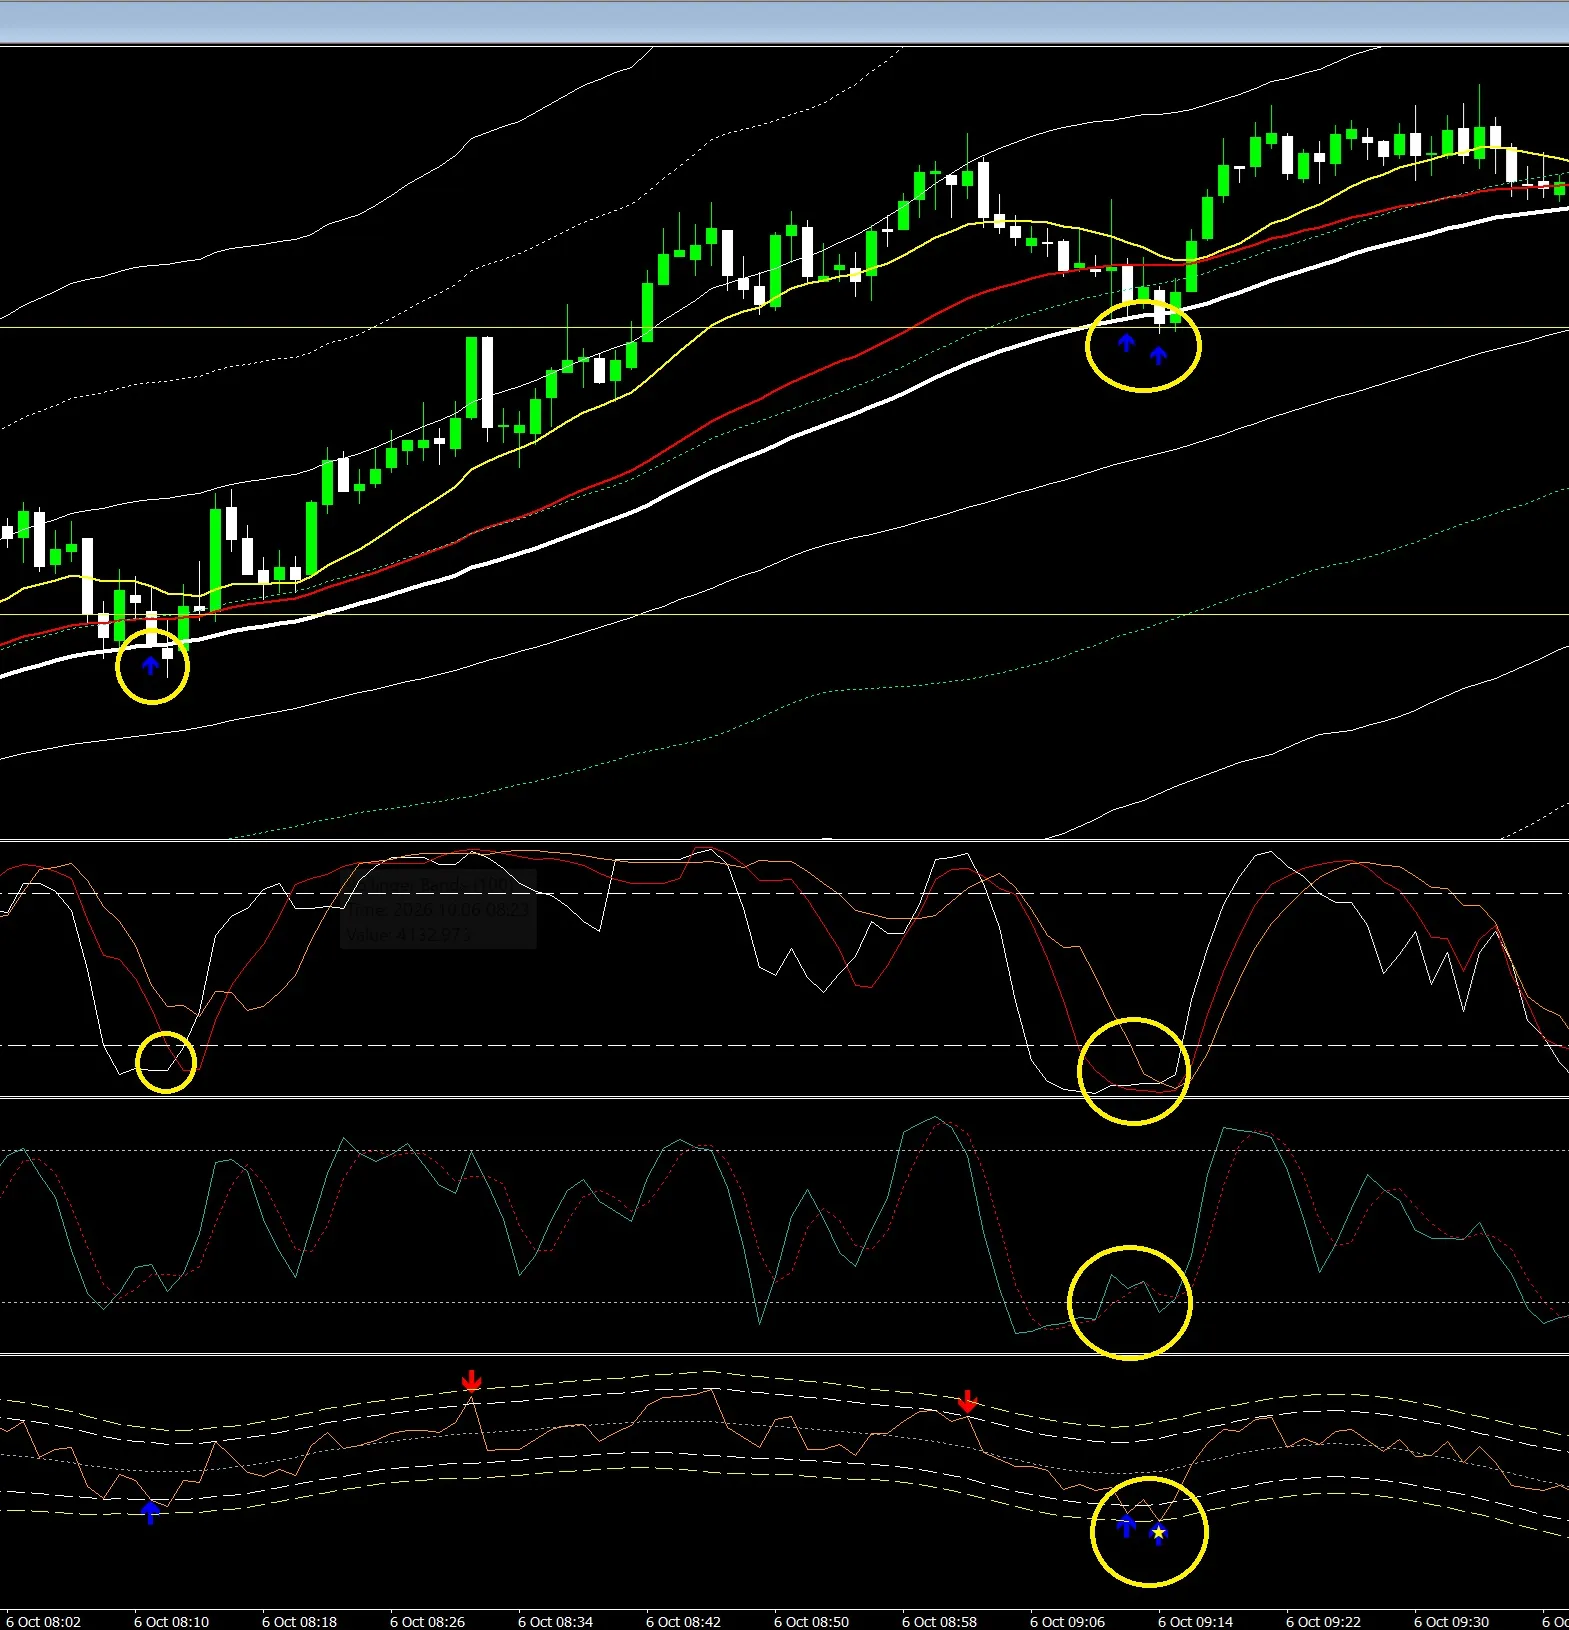
Next, this one.
Contrary to before,the blue↑ appears in a rising market.
Please look at the yellow circled parts in order.
Blue↑ is displayed on the candlesticks, and around the same timing, characteristic movements in RCI and Stochastics can be observed.
And at the bottom, blue↑ is also displayed in Maasan Trend Arrow.
Furthermore, on the right-side yellow circle, in addition to blue↑ from Maasan Trend Arrow, you can also see a yellow ★.
This yellow ★ is one of the important signals added in this update.
Yellow ★ is used to capture points where price is very biased, and I use it as a guideline forchecking for averaging in or rebound candidates.
However,
★ does not mean you should immediately averaging in.
This is also very important.
When ★ appears, what else do you check?
How to combine the usual blue↑ and red↓ with ★.
And which ★ to use and which to pass on.
This decision method is also explained in detail for purchasers.
If you actually look at the images, you can also see how the price action develops after blue↑ appears.
Not all signals lead to entries
This is a point I want to emphasize again and again.
Maasan Trend Arrow is not an indicator that
Blue↑ = absolutely buy
Red↓ = absolutely sell
Yellow★ = absolutely average in
This is not an indicator that guarantees such rules.
Rather, what I think is important is
“What to check after the signal appears?”
.
Even with the same blue↑, there are scenes where I enter and scenes where I do not.
Even with the same red↓, I sometimes pass.
The difference is created bythe combination of conditions including the direction of higher timeframes, perfect orders, RCI, Stochastics, etc..
And after entering, too, you must think about
“Where to take profits?”
for the trade to be complete.
Even for the images published this time, if I disclosed the exact entry conditions and profit-taking judgments, it would become purchaser-only content, so I have kept them hidden in the general article.
For purchasers,
“Why target this here”
“Why pass on this here”
these actual decision parts will be shared.
And for those who want to try it from now on.
Here is the announcement this time.
If you are interested in Maasan Trend Arrow but
“I’m not sure if it suits me”
“I want to judge after trying it on real charts”
some people may think so.
So currently,
★Maasan Trend Arrow First Month Free★
is available for use.
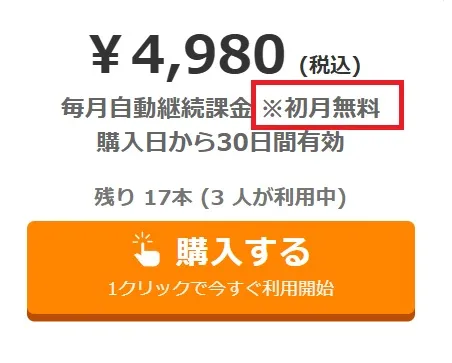
UsuallyMonthly fee 4,980 yen (tax included)but currentlyfirst month freeis offered.
It is valid for 30 days from the purchase date, so first, install Maasan Trend Arrow in actual MT4 and
see what kinds of scenes produce signals.
see how it functions in markets you usually monitor.
see whether you can incorporate it into your own trading style.
Please check it in actual market conditions.
Try it for 30 days in actual markets.
I believe indicators cannot truly reveal whether they suit you just by looking at pretty charts on a product page.
That is why, in this case,take advantage of the first-month free periodto use it in real markets.
And Maasan Trend Arrow is not just handing over an indicator and ending there.
For purchasers,we will also share detailed conditions, practical usage, the signals to aim for and signals to pass, and how to think about entries and profits.
The charts shown this time also include
“the arrow appeared, and then moved”
not just the result, but
“why did you pay attention to this signal?”
This is the most important point.
I want you to use Maasan Trend Arrow with that in mind.
First month free now.
“Where should you enter?” made simpler.
If you have been curious about Maasan Trend Arrow, please try it in actual markets during this opportunity.
Monthly fee 4,980 yen (tax included)
First month free
Available for 30 days from purchase
First, 30 days.
In actual charts, please check the signals of Maasan Trend Arrow.
The charts shown are past price movements and signal display examples and do not guarantee future profits or similar movements. There is a possibility of loss in FX trading.