

When I ran the EA I created in 2019, "PF1.85", over 16 years, even with zero cost, none of the four pairs won.
0.72–1.00 PF with zero cost (4 pairs) | 24 combinations Stop-loss and take-profit combinations. All below PF1 | t=0.58–1.07 The only improvement that worked. Hard to distinguish from chance |
I create MT4/MT5 indicators and sell them on GogoJungle under lab.aiueo.
In 2019, I made one EA (automatic trading program). It was a Bollinger Band reversal strategy.
In the folder, there were images of test results from back then. 1,560 trades on USD/JPY, PF 1.85, maximum drawdown 7%.
If it were me now, I’d first doubt those numbers. In August I re-ran this EA with about 16.5 years of data. Today are the results.
I’ll start with the conclusion.
The EA at that time
The rules were simple.
- If the close is outside the Bollinger Bands (period 8, ±2σ), enter in the opposite direction
- Two entry conditions
- The width of the previous candle’s band is narrower than the maximum of the previous eight candles
- The retracement wick is above a certain length
- Stop-loss 20 pips, take-profit 50 pips
- Another exit: label which band region you are in on a 0–5 scale, and exit if the price moves one step unfavorably
Here are the test results images from back then.
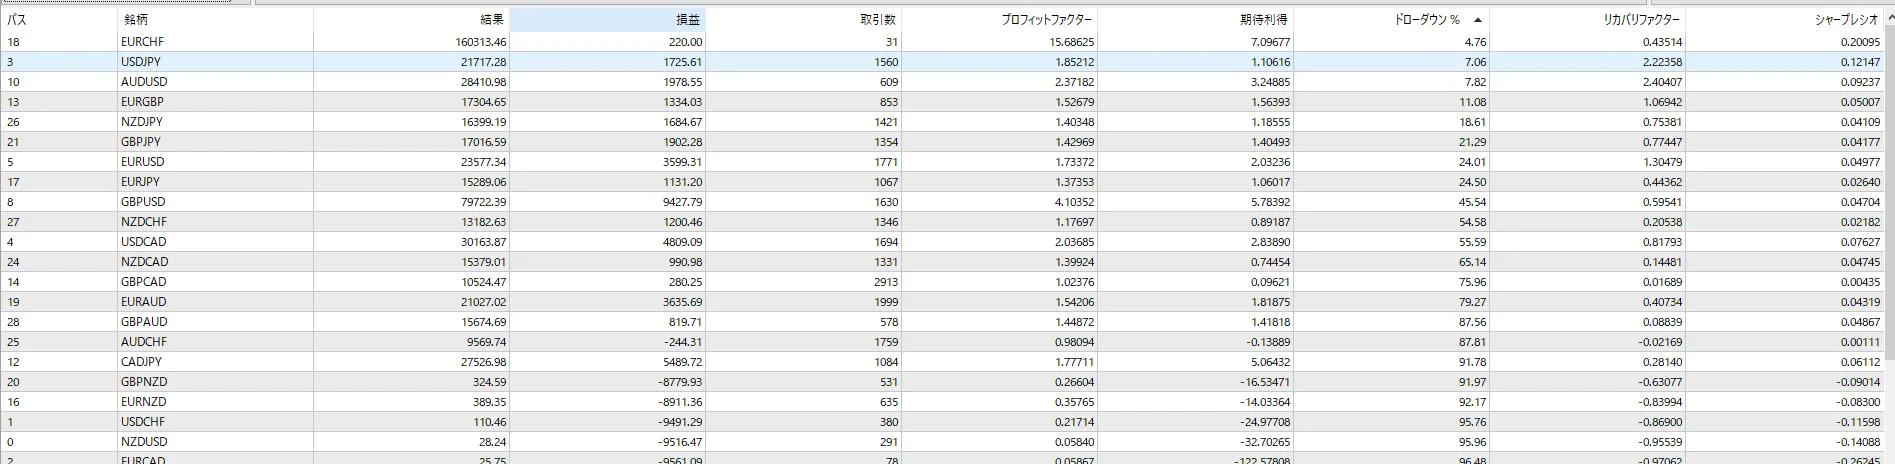
The images are sorted by drawdown low to high; USD/JPY is on the top two rows. Lower rows include pairs with PF below 1. The images do not show the test period or method.
Re-ran conditions
I rewrote the EA’s rules in Python and ran them on the price data in Ti〇n FX MT4.
- Currency pairs: USD/JPY, EUR/USD, GBP/USD, USD/CHF
- Time frame and period: 4-hour chart, December 2009 to July 2026 (about 16.5 years)
- Entry method: evaluate at each candle close and enter at the next candle’s open
- Stop-loss and take-profit: check if the price touched the high/low within the candle. If both touched in the same candle, treat the stop-loss as occurring first (strict)
- Cost: deduct the spread (0/0.5/1/2 pips)
One thing changed from the original EA: the wick condition.
In the original EA, the wick length was set to “0.0004”. For EUR/USD that’s 4 pips, but for USD/JPY it’s 0.04 pips, so it hardly mattered as a condition. I aligned it to 4 pips so it means the same across all four pairs.
Even with the original 0.0004 for USD/JPY, with zero spread PF was 0.86. The conclusion does not change.
Result: even with zero cost, cannot win
| Currency pair | Trades | Win rate | PF (spread 0) | PF (spread 1 pip) |
|---|---|---|---|---|
| USD/JPY | 406 | 31.5% | 0.83 | 0.74 |
| EUR/USD | 719 | 28.8% | 0.82 | 0.76 |
| GBP/USD | 670 | 30.7% | 1.00 | 0.92 |
| USD/CHF | 416 | 29.3% | 0.72 | 0.66 |
Trades and win rates are for spread 0.
GBP/USD 1.00 is −13.7 pips over 16.5 years; almost zero, slightly negative.
Looking at the breakdown of exits reveals why. For USD/JPY (spread 1 pip), there were 260 stop-losses and 66 take-profits. The price hit the 20-pip stop before reaching the 50-pip take-profit.
Two conditions and the band-exit also didn’t work
Entry conditions
Removing both conditions doubled the number of trades. PF was better for 3 of the 4 pairs when the conditions were removed.
The conditions only reduced the number of trades.
Exit in the band
Removing this exit and only using stop-loss and take-profit drops USD/JPY win rate from 29.8% to 22.1%. That exit had helped raise the win rate.
However, PF hardly changed or worsened. For 2 out of 4 pairs, removing it increased PF.
Even varying stop-loss and take-profit across 24 combinations, all failed
I tested 24 combinations of stop-loss and take-profit (6 kinds: 20/50, 20/20, 30/30, 50/20, 40/100, 20/100) across 4 pairs. In every case PF was below 1.
If you set take-profit to 50 and stop-loss to 20, the win rate rises to 57–65%, but PF remains about 0.65–0.84.
No matter how you adjust settings, you still cannot win, indicating the problem lies in the design rather than the settings.
The only thing that worked: limit entries to only in the same market direction as the current flow
There was one clearly beneficial adjustment.
When the 4-hour moving averages (50, 100, 200) are above, only go long; when below, only go short. Restrict contrarian plays to pullbacks within the trend and rallies.
| Currency pair | Before narrowing | 50 MA | 100 MA | 200 MA |
|---|---|---|---|---|
| USD/JPY | 0.74 | 0.90 | 1.02 | 1.12 |
| EUR/USD | 0.76 | 0.83 | 0.85 | 0.82 |
| GBP/USD | 0.92 | 1.18 | 1.14 | 1.08 |
| USD/CHF | 0.66 | 0.85 | 0.74 | 0.70 |
The numbers are PF, and the spread is 1 pip.
All four pairs improved compared to before narrowing. USD/JPY (200) and GBP/USD (50) have PF over 1.
Still, why I did not turn it into a product
I looked closely at the two cases where PF exceeded 1.
- Few tradesOver 16.5 years: USD/JPY 145 trades, GBP/USD 205 trades. About 9–12 trades per year
- Small profit per tradeAverage of +1.40 pips and +2.35 pips. This is eroded by time-of-day spreads and price slippage
- Not distinguishable from chancet-values from trade-by-trade profit variability were 0.58 and 1.07. They do not reach the practical threshold of 2 to be confidently non-random
- Optimal lengths differed by pairUSD/JPY favored 200, GBP/USD favored 50. EUR/USD and USD/CHF never reached PF 1 for any length. Afterward, choosing the best length makes the results look better simply due to selection bias
Direction-wise, the approach was correct. But by itself, it cannot become a product.
Why PF1.85 looked that way back then
The original test conditions aren’t preserved, so this is an educated guess. Two possibilities exist.
One is the testing method. In MT4 and MT5, testers allow varying the granularity of intrabar price movement. A coarse method may treat whether the stop-loss or take-profit was hit first inside a candle differently from reality.
Another is the “thinning” inside the EA. This EA evaluated only every 500 price moves, not every move. How many intrabar movements are reproduced depends on the testing method, and the timing of judgments varies by method.
So, even with the same EA, numbers can change depending on the test method.
There is also another image from the optimization in April 2019. The top result had PF 3.03 with 17 trades.
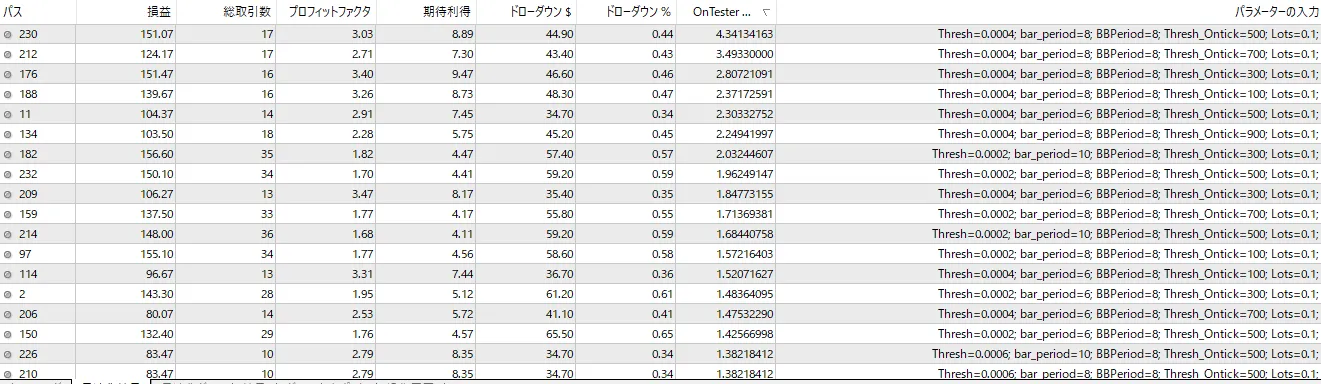
With 17 trades, you cannot distinguish from chance. Still, the settings that remained in the EA matched the table’s top value.
What I would do first now
- Run with zero spread. If you still lose, further adjustments are meaningless
- Check if the high/low within a candle triggered a stop-loss
- Don’t trust small sample sizes
- Don’t only look at the best line. Also review the worst lines in the same table
- Discount later selections that chose the best settings
This article is a record of my own past EA verification. It does not advocate a specific trading method, and the numbers shown do not guarantee future results. Verification was done by reproducing the same rules in Python, and may not match MT4 Strategy Tester results. Investment decisions are your responsibility.
Thank you for reading through to the end.