

[The Trading Series] Episode 5: Is the Chart a "Psychological Test"? The crowd's lies and true intentions hidden in candlesticks?️?
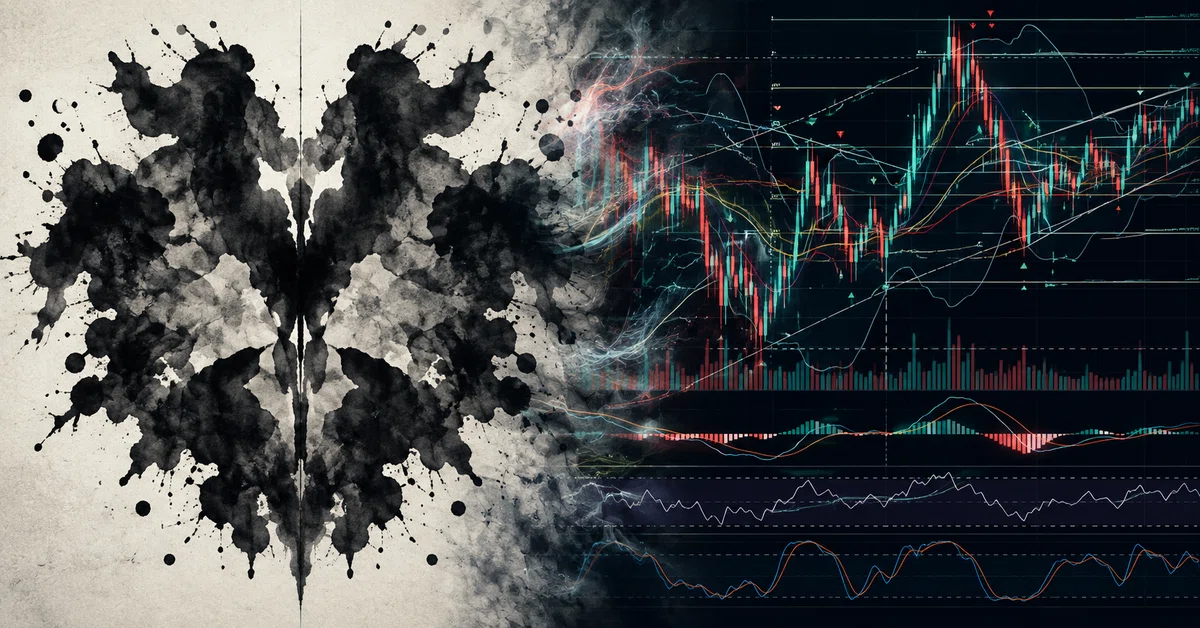
The true purpose of chart analysis is not to find the "magic signs" hidden in the market. As we begin Chapter 3, "Classical Chart Analysis," the conclusion is that a chart is a record of the battle between buyers (bulls) and sellers (bears), and a tool to measure their emotions objectively.
However, there is a very common pitfall that beginners encounter when learning chart analysis.
?️ A chart is a mirror reflecting "your mind"
There is a psychological test called the Rorschach test, where you look at inkblots and say what you think they look like. The ten inkblots themselves have no inherent meaning, but people project what comes to mind onto them.
In fact,the greatest weakness of classical chart analysis is that, like this psychological test, it easily becomes extremely "subjective.".
The trap of wishful thinking:Traders tend to interpret chart patterns in a bullish or bearish light according to their own judgments of whether they want to buy or want to sell.
The danger of inclined lines:Slanted lines such as trendlines can change their angle depending on how they are drawn, and at the same time the message they convey can change.
Seeing what you want to see:When you feel like buying, you narrow your eyes and stare at the chart, unconsciously trying to find signals to buy (such as a triple bottom).
To avoid self-deception in the market, you should focus on objective facts, such as "horizontal lines (support and resistance)" based on past highs and lows, rather than subjective slanted lines.you should focus on objective facts, such as "horizontal lines (support and resistance)" based on past highs and lows, rather than subjective slanted lines.
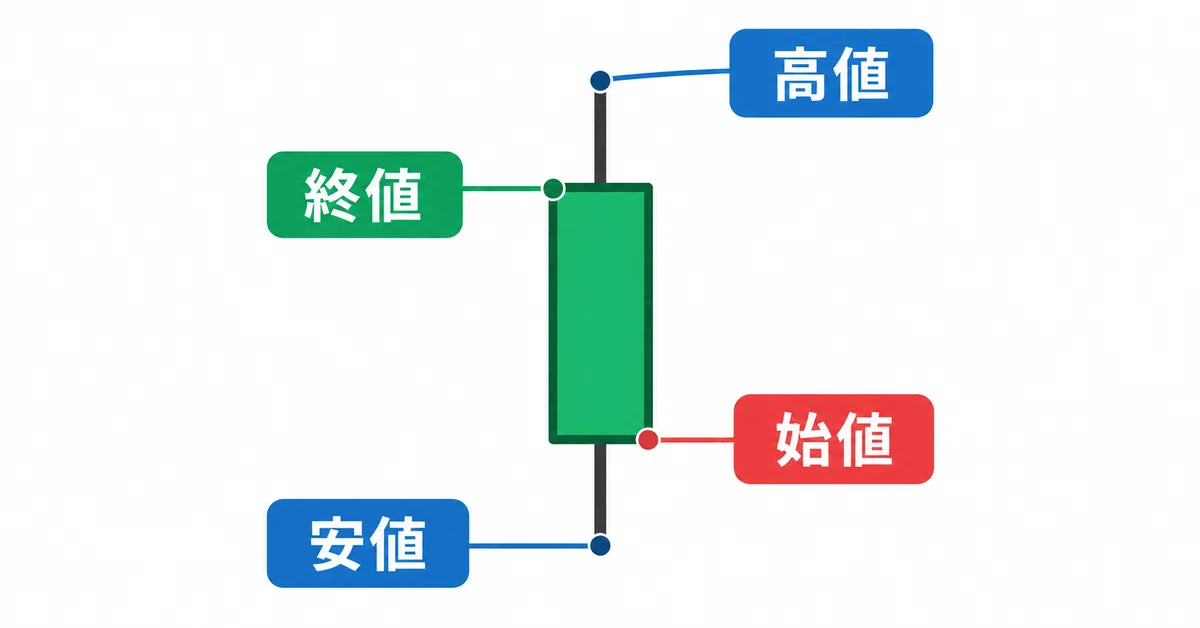
⚔️ Four facts spoken by one candlestick