Financial Instruments Business Operator Kanto Finance Bureau Director (Kinsho) No. 1960 / Membership Association Investment Trusts Association, Japan Membership No. 012-02323Go to GogoJungle Home
Since the burst of the bubble in the 1990s up to the present, I have remained involved in the financial markets, experiencing various aspects of equity, bond, foreign exchange, and derivative markets.
My career began at a Japanese securities company, where I worked in market-making for domestic and foreign-currency-denominated bonds for client-facing activities, gaining practical experience with interest rate, currency, and credit risks. Later, at a foreign securities company, I engaged in marketing to hedge funds and the formation of new funds, contributing to investment strategies on the institutional investor side, product design, and risk management.
After going independent, I have continued systematic trading in which discretionary judgment alone is not relied upon, with the Nikkei 225 futures as my main arena. Currently, I combine Dow Theory, multi-timeframe analysis, moving averages, price structure, supply and demand, and volatility to pursue reproducible trading judgments. Drawing on many years of market experience and practical futures trading perspectives, I focus on market analysis centered on Nikkei 225 futures, trading scenarios, and market outlooks.
Markets are always changing, but I believe the important thing is not to “guess the forecast” but to preemptively organize, in advance, “at which points and under what conditions will I act, and how.”
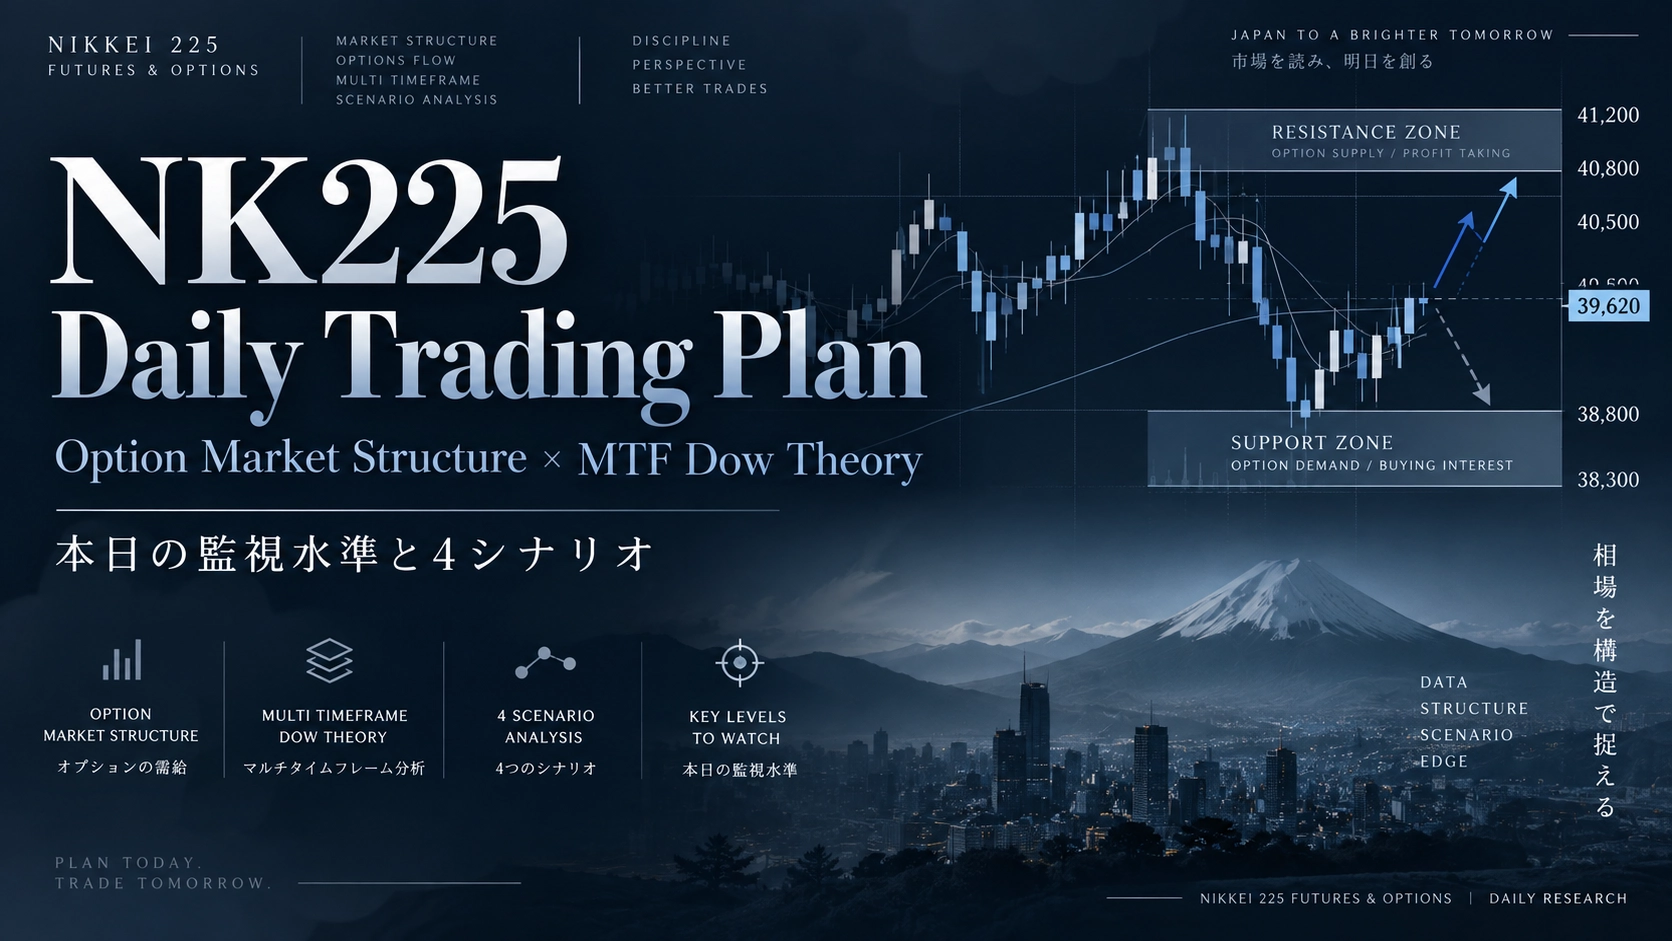
NK225 Daily Trading Plan| Monitoring levels on 10/6 and 4 scenarios
NK225 PROFESSIONAL DAILY
NK225 Daily Trading Plan|Today's monitoring levels and 4 scenarios
Option Market Structure × MTF Dow Theory
TRADE DATE2026.10.06
REFERENCE70,180
VALIDITY10/6 intraday〜10/7 06:00
UPDATED2026.10.06 06:02 JST
Previous Verification
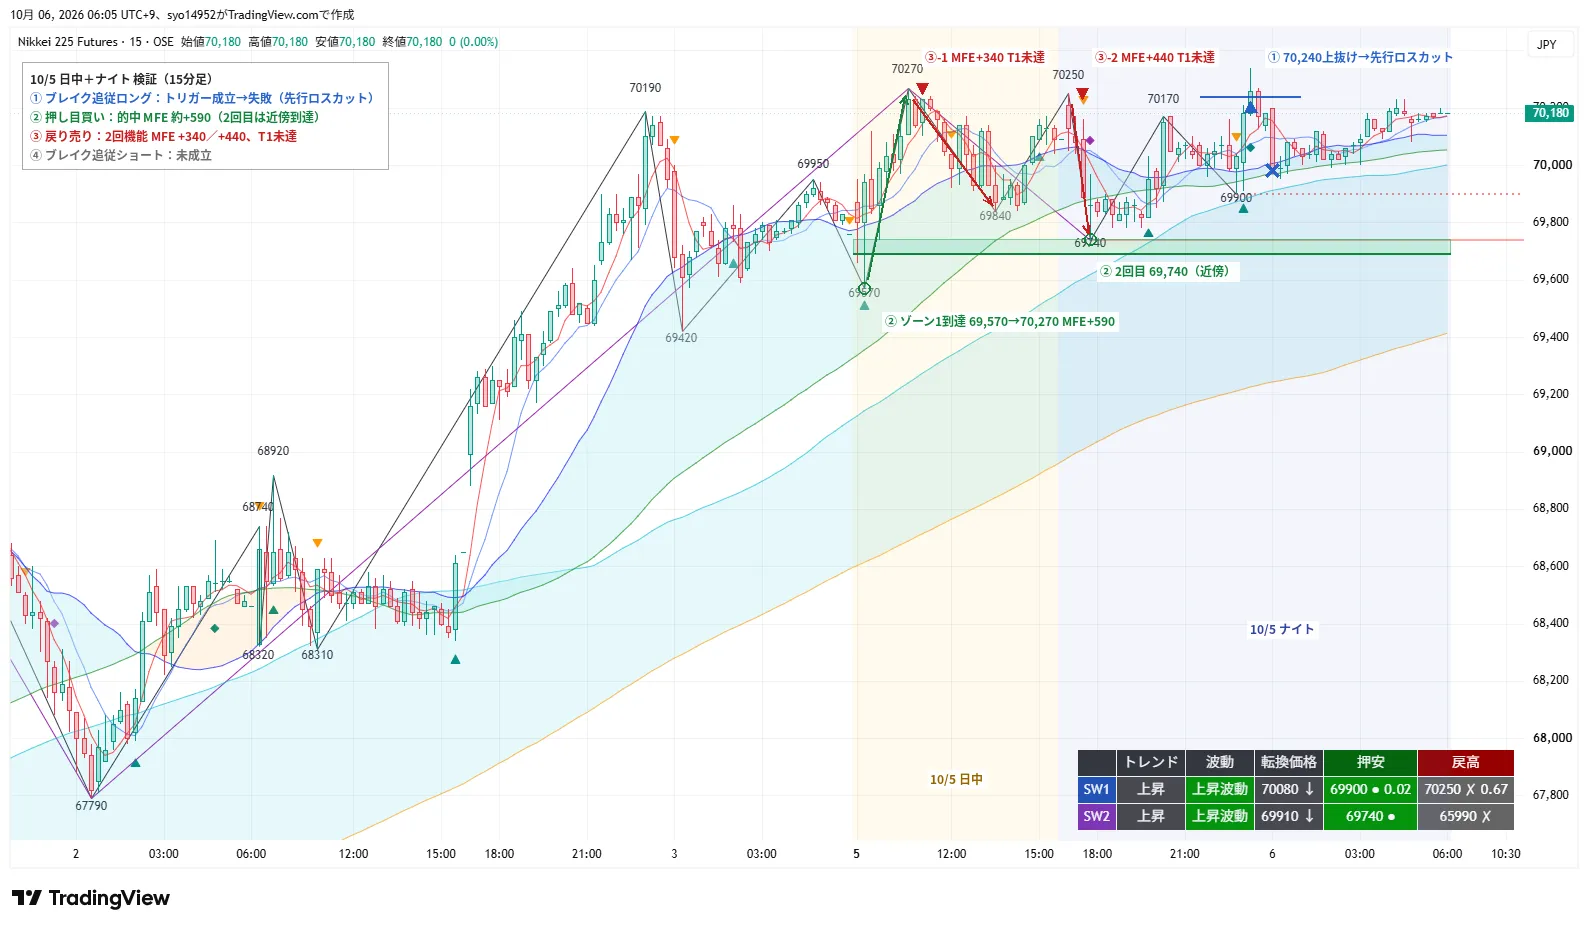
◎② reached the first monitoring zone and rose to T1/T2 prices. After the market opened on 10/5, 69,570 was inside the previous first monitoring zone 69,450–69,690. It then rose to 70,270, reaching 69,950 and 70,190. The final target 70,590 was not reached. After two consecutive zones not reached, this time the pullback came to the initial support zone.
Although ① briefly exceeded 70,240, the night high stayed around 70,330, not reaching 70,590 at T1. Because it pulled back to near 70,000 after breaking up, confirming a pullback and exit condition was important.③ also failed to reach T1 at 69,650 when dropping from the intraday high to 69,740, and did not reach 69,050 for ④.
4-Hour Swing Structure
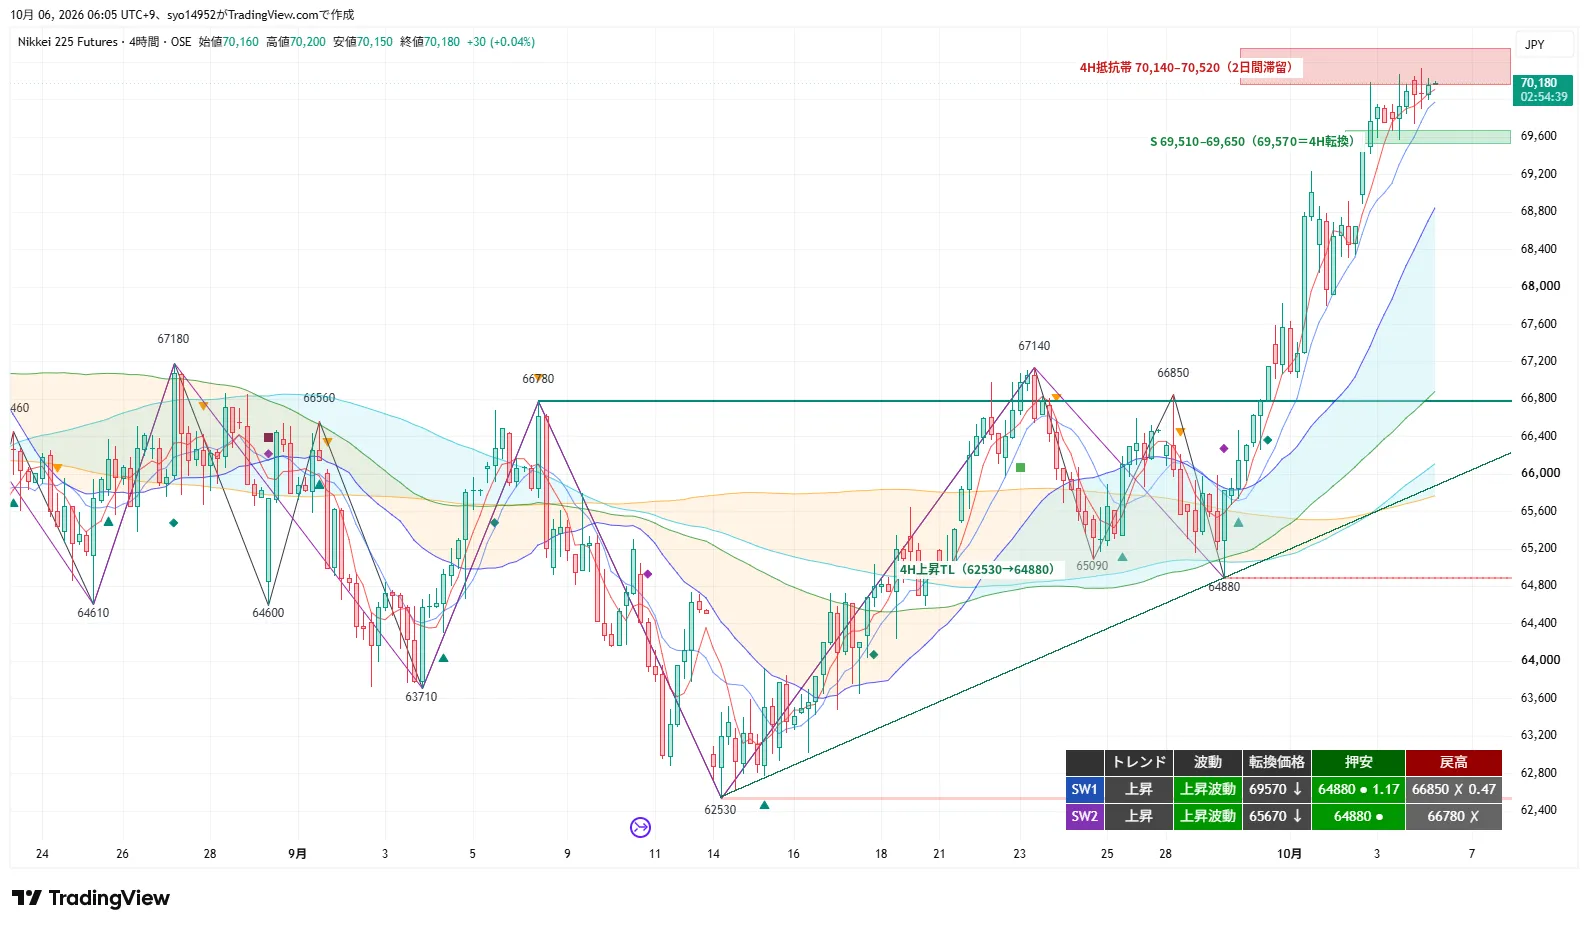
The 4H remains in an uptrend and upward wave. It pulled back to 69,570 right after the open on 10/5, but the wick only dipped below the August high of 69,650, and the 4H close stayed above it. The pivot price rose to 69,570, the swing low is 64,880, and the swing high of 66,850 has been broken above. The 20 EMA/20 SMA are rising, while the 120 EMA (daily 20 EMA equivalent) and 200 EMA lie below the price.
Above, 62,530 is the reference for the calculated target 70,590, and beyond that 71,000 with the daily chart’s resistance at 73,760. Below,Dividing 69,570 by the 4H close suggests the 4H wave turns bearish. In that case, the next pullback targets would be 69,360–69,060, corresponding to the 38.2%–50% retracement from 67,790→70,330.
Option Market Structure × MTF Snapshot
TOTAL GEX
+116.7
JPY bn / 1%|previous +83.5 increase
ZERO GAMMA
66,817
約3,363円 below the futures reference value of 70,180
KEY POSITIVE GEX
70,000
Net GEX +15.55|observe pullback reaction
CALL WALL
70,000
Moved away from 73,000|UNWINDING
4H
Upward / Upward wave
Turn at 69,570|pullback low 64,880|return high 66,850 (X)
1H
Upward / Upward wave
Turn at 69,910|pullback low 69,570|return high 65,990 (X)
15m
Upward / Upward wave
Turn at 70,080|pullback low 69,900|return high 70,250 (X)
Option:Bias from 10/5 19:40 data is Bullish (score +4.5, confidence 7/10). Put Wall is at 65,000・BUILDING. Major positive GEX values are 69,000 (+17.05), 70,000 (+15.55), 71,000 (+10.65), 72,000 (+18.48). Units are JPY bn / 1%. Open Interest decreases for the 70,000 call by 746 contracts, puts increase by 106 contracts. A decrease in Wall positions alone does not mean there is no upper resistance.
Position relationships:The current price 70,180 is 180 above 70,000. Distinguish whether the pullback near 70,000 will hold after breaking 70,350. With SQ on 10/9 ahead, ATM IV rises to 28.48%. Even with a positive GEX, do not treat the estimated evening as definitive supply/demand at night.
Today's Important Monitoring Levels
70,350
Outside the night high near 70,330
Break of 15m close for ① / confirm pullback to 70,250
70,250–70,450
Area where recent highs cluster and pullback occurs
③ First monitoring zone / after ① occurrence, skip new sells
69,900–70,100
1H turn at 69,910 + 15m pullback low 69,900
◎② First monitoring zone / Option adjustment implies S-side
69,550–69,750
4H turn / 1H pullback low 69,570 + old high 69,650
② Second monitoring zone / confirm re-turn after A and exit
69,540
Slightly below 4H turn at 69,570
④ 15m close break reference / separate from 4H judgment
69,000–69,100
Positive GEX around 69,000 and 50% retracement of a small wave
Take profit at T1; below 68,900 or 68,500 as targets
Today's 4 Scenarios
① Break-follow (Long)CONDITIONAL
Monitor
70,350. Slightly above the night high around 70,330
成立
Break above 70,350 on 15m close. Confirm the pullback does not break 70,250 on 15m close
Entry
Pullback to break level, 1–5 min frame re-acceleration. If pullback is shallow, also monitor around the rising 15m 20MA. Position builds after 1H close at 70,450 is recovered
Exit / Switch
Close the initial tranche slightly below the prior swing low; set the outer upper limit at 70,180. For the main position, exit if it falls below 70,080; full exit below 69,820. Do not widen the preset stop loss
Target
T1 70,590 → T2 71,000・71,500. Take partial profits near T1 and move stop to near entry
Option / Structure:A, no Option adjustment. If the high zone 70,250–70,330 is broken but pulled back, do not chase. Secure profits at Net GEX +10.65 for 71,000. After 15m close above 70,350, skip new sell in Zone ①.
② Buy on dips (Long)FOCUS
Monitor
First monitoring zone 69,900–70,100 / Second monitoring zone 69,550–69,750
成立
Hold at zone or nearby support, 1–5 min close above the latest pullback high. Then confirm 15m close at 70,080 rebound
Entry
First at 1-minute turn; add if 5-minute turn confirms. Rising 15m 20EMA, if it drops below then verify recovery above the 80EMA. Position builds after 1H close at 70,260
Exit / Switch
Initial leg slightly below the prior high. Zone 1 69,820, Zone 2 69,540 as outer limits. Position exits if 69,540 break, full exit below 69,350. Consider ④ if 69,540 breaks on 15m close
Target
T1 70,330 → T2 70,590・71,000. Partial profit near T1, after 70,350 breakout extend with ① conditions
Option / Structure:First is A, as 1H turn at 69,910 and 15m pullback 69,900 overlap, add S with 70,000 positive GEX considered. Distinguish from a true S where all three timeframes' turn prices align. Second is A where 4H turn and 1H pullback 69,570 align. From 70,260 to T1 there is a 70-yen range, so confirm remaining potential before adding.
③ Sell on rallies (Short)COUNTER
Monitor
First monitoring zone 70,250–70,450 / Second monitoring zone 70,520–70,720
成立
After a bullish wick or deceleration, 1–5 min closes below pullback low. Confirm 15m close back to 70,250. Do not rush selling above rising 15m/20EMA
Entry
First at 1-minute turn; add upon 5-minute confirmation. Second when new bearish turn and 1H close confirms the fall and position builds. Skip new entries in Zone 1 after ① and reassess in Zone 2
Exit / Switch
First leg close slightly above prior high; 70,480 is outer upper limit. Second leg exit if new rebound surpasses high; main exit if 70,860 is surpassed. If breakout fails, reevaluate condition ②
Target
T1 70,080 → T2 69,910・69,740. Take partial profits near T1 and move stop to near selling price
Option / Structure:B, no Option adjustment. Short-term sell into rising 4H, 1H, 15m. Since the outer boundary of Zone 1 at 70,480 lies below Zone 2, do not reuse Zone 2 stops. For Zone 2, decide exact stop positions before entry. Do not sell aiming only for a return to 70,000; protect profits with a +200 yen target.
④ Break-follow (Short)CONDITIONAL
Monitor
69,540. Slightly below the 4H turn and 1H pullback low at 69,570
成立
Break below 69,540 on 15m close. Confirm pullback cannot recover to 69,650 on 15m close and stalls
Entry
Pullback to the break level, or near the downward 15m20MA for a new downward turn. Position builds after 1H close below 69,400
Exit / Switch
First leg cut slightly above the prior high, 69,720 outer upper limit. Position recovers to 69,760, full exit above 69,920. If break fails, reevaluate condition ②
Target
T1 69,100 → T2 68,900・68,500. Take partial profits before entering 69,000 positive GEX band
Option / Structure:MTF is A; since Net GEX +17.05 exists at the lower 69,000, adjust to B. The 15m close below 69,540 and 4H close below 69,570 imply different wave turning. 68,250–68,375 are negative GEX, but reaching them does not instantly confirm a steep decline.
Actions at the Present
Upper: 70,250–70,590
Stalls at 70,250–70,450 → ③. Wait for 1–5 min turn
Break above 70,350 on 15m close → skip new sell in Zone ①
Pullback holds at 70,250 → consider ① buy
1H close recovers to 70,450 → position ① full, check room up to 70,590
Lower: 70,100–69,540
Rebound from 69,900–70,100 → ◎② First monitoring zone
1H close below 69,910 → watch for deeper pullback. Stop-loss upper limit for the front-runner is 69,820
After first exit, rebound 69,550–69,750 → consider ② Zone 2
Break 69,540 on 15m close → ④. Confirm 4H close at 69,570 separately
Risk Management
When you are in profit, prepare not to give it back. If price moves 200 yen in favorable direction from your entry/bid, move your stop references to either the buy/sell price or a price where some profit remains. If it moves 300 yen, shift to at least preserve 100 yen of profit or adjust to protect gains with the price action. Since ③ sells against the upward trend, always move toward selling price when price moves 200 yen.
If targets are near, secure profits early. For ①, near 70,590 and just before 71,000; for ② near 70,330; for ③ near 70,080; for ④ near 69,100. No need to wait for 200–300 yen moves. Even if additional conditions are met, do not aggressively add if there is little room up to T1. If entry conditions are confirmed, and you already exceed T1, skip the entry.
Decide stop location before entering. If buying, a little below the swing low just before a rebound; if selling, a little above the swing high just before a drop. The unfilled price is the trading boundary you can hold to the limit of your position, not waiting until full withdrawal. Even after position becomes profitable, do not move the stop loss or profit-protecting levels unfavorably. After stopping out in the first monitoring zone, re-confirm reversal in the second. Do not chase losses with additional trades.
Nearby zones still require reversal confirmation. If reversal occurs just before a zone, verify within 50 yen; if after passing through, verify within 100 yen. However, this range does not justify widening your stop loss. Even when moving from day to night sessions, do not reset your profit-protection or exit criteria. Trades that reach the condition of “full withdrawal” are closed. Even if options analysis suggests price action tends to stabilize, large upward or downward moves can occur.
NK225 DAILY TRADING PLAN2026-10-06
※MTF and price path refer to the report provided at 06:02 on 10/6; previous conditions are based on the 10/5 edition. This targets intraday 10/6 to 10/7 06:00. The previous verification compared zone reach and price path; it does not reflect realized P/L or MFE derived from 1–5 minute turns or trade records. The 15-minute and 4-hour chart images are not attached, so a placeholder is provided. 70,330 vicinity is reading from the original chart.
※Option is from the daily_summary / option_bias 2026-10-05 edition (generated at 19:40; spot 69,946.86; futures 70,090). Total GEX +116.6569, Zero Gamma 66,816.76, October expiry with DTE 4. The values are not recalculated from the night close at 70,180. Strike prices are based on the spot and are not identical to futures supports/resistances. Gamma changes with price (CME Group). The October SQ is on 10/9 (JPX System Overview).
※38.2%–50% retrace from 69,570 to 70,330 is approximately 70,040–69,950. From 67,790 to 70,330, 23.6% is about 69,731, and 38.2%–50% is about 69,360–69,060. 70,590 = 66,560 + (66,560 − 62,530) is a reference calculation from past starting points. The wave turns on each timeframe are judged by that timeframe’s closing price. The rank after Option adjustment is a supplementary assessment and should not justify entering with large quantities from the start.
※This material is for information purposes and is not investment advice. Please make investment decisions at your own risk.