

[GOLD Price Movement Analysis] The market moved to about $102 even though almost flat — October 1 to 5, 20:00
Despite having a wide range, you can be whipsawed whether you buy or sell. Have you ever traded GOLD and felt that way? The bigger the move, the more attention often goes to guessing the direction. However, even with the same upward move, the content you prepare for changes between a continuing rise and a rise that is quickly pushed back down.
In the series "GOLD Price Movement Analysis," we organize market characteristics from actual charts and deliver what you want to confirm before entering. The target period this time is from October 1, 2026 to 20:00 on the 5th. The conclusion is: from a back-and-forth price movement, to a sharp rise followed by a sharp fall, and then a recheck of the low to rebound in the market.
First, please look at the attached chart.
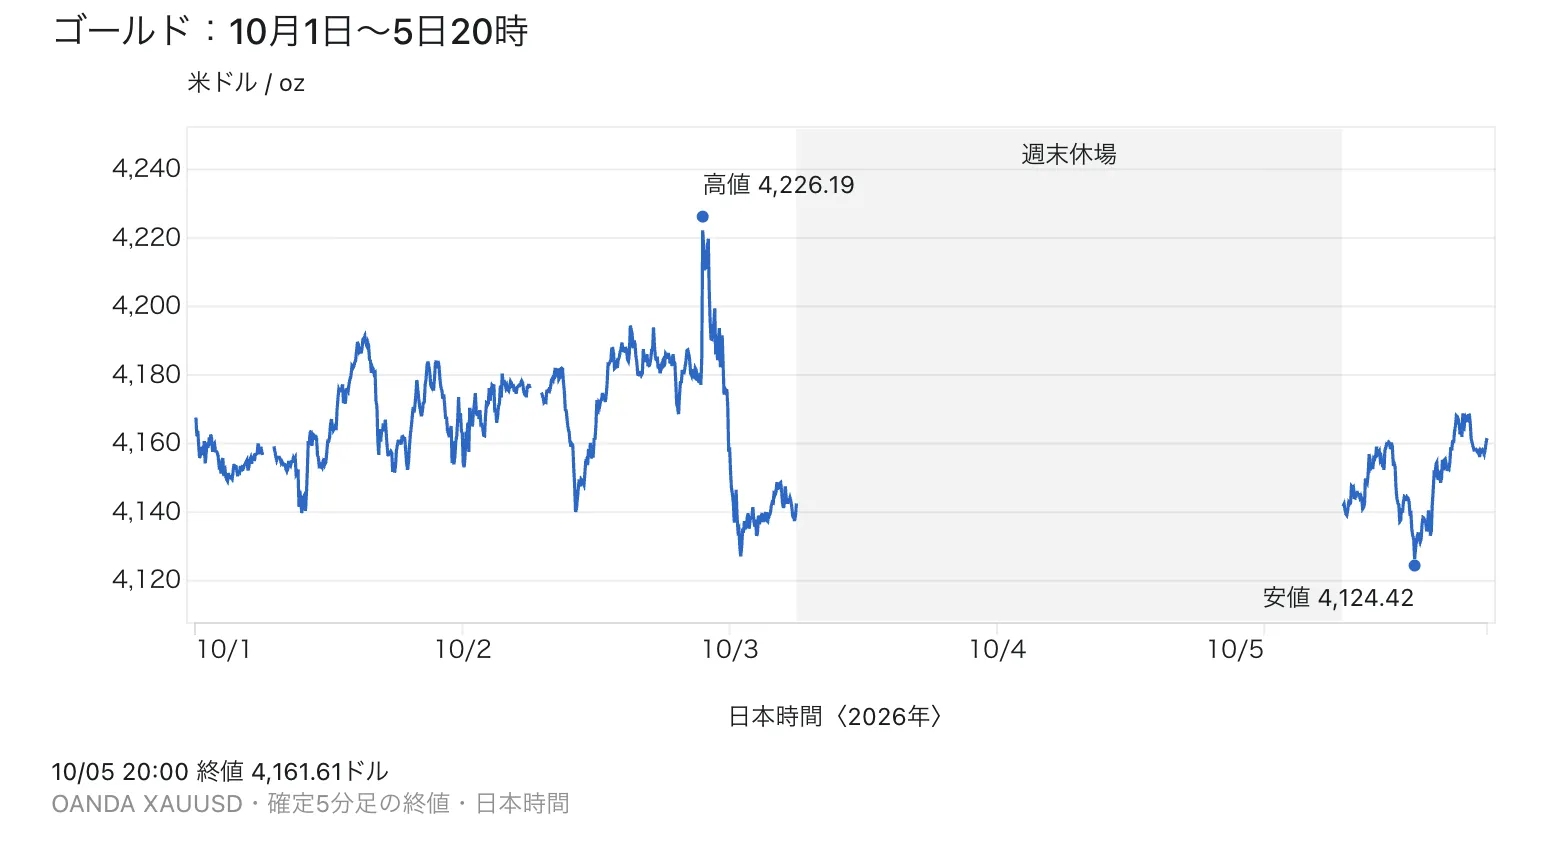
【Image】 GOLD from October 1–5, 2026 at 20:00. The blue line is the close of XAUUSD on OANDA on a confirmed 5-minute chart, and the circles indicate the period's high and low. Times are in Japan Standard Time, prices are in USD per ounce. The gray area is the weekend holiday.
Another caution: a line drawn by closing prices alone does not reveal the intrabar high and low within a single candlestick. The reason the high/low and the blue line positions differ is because of that. When considering short-term large fluctuations, also open the candlesticks and confirm the high, low, and the confirmed close together.
■ Nearly sideways results and a price range of about 102 dollars
The period’s opening price was 4,165.35 dollars, and the close at 20:00 on the 5th was 4,161.61 dollars. The difference is minus 3.74 dollars, and the rate of change is about minus 0.09%. By this number alone, it may seem they didn’t move much.
However, the high was 4,226.19 dollars and the low was 4,124.42 dollars. The difference reached 101.77 dollars. Even though the start and end were close, there were large intraday fluctuations.
From this, we can read that "a large price range" and "being prone to move in one direction for a while" are separate phenomena. In GOLD this time, there were scenes where prices were dragged down after chasing an upswing, or dragged up after chasing a downswing. To prepare your trading environment, you need to look not only at direction but also at the order in which prices moved.
■ October 1: Movement up and down, returning near the starting point
On the 1st, the price fell to 4,139.10 dollars in the morning, then rose to 4,192.87 dollars in the afternoon. Still, the daily close in Japan time was 4,162.98 dollars. It was 2.37 dollars lower than the opening price. The intraday high-low difference was 53.77 dollars.
A reaction of selling when it falls and buying when it rises tends to engage in a back-and-forth pattern. What to watch for is whether price can hold above the previous high after surpassing it, or whether it returns to the original range soon after breaking the low. If you observe the breakout moment and its subsequent stabilization separately, you can organize your judgments.
■ October 2 night: Do not treat the sharp rise as a continuation of the rise
Around 21:30 on the 2nd, it recorded a period high of 4,226.19 dollars. The high-low difference of this 5-minute candle was about 41.24 dollars. The average range for 5-minute candles in the target period is about 4.41 dollars, so this single candle was about 9.4 times the average. By ordinary intuition, chasing such movement feels different.
Also, the average range this time is a figure summarizing this period’s records. Do not fix it as the normal range or stop-loss width for future trading; use it as a reference to compare the size and speed of movement at the time of trading.
Afterwards, it could not sustain the high, and around 0:55 on the 3rd, it fell to 4,125.10 dollars. In about three and a half hours from the high, it retraced about 101 dollars. It is important to separate the fact that the price rose strongly from the expectation that the rise would continue.
From here, we will organize how to read the rebound on October 5 and the verification steps when considering buying or selling. If you want to use your own method, please apply for free access from "Read more" to view it.