If you know the ideas behind price movement forecasts and scenario methods, it's easy—about the Line Method ③
(keikana is.
Pound is too delicious! Sea urchin from Hokkaido and seared conger eel are exceptionally tasty (lol)
This time, an article that everyone can see
Last night’s tweet where I brought it downhttps://twitter.com/xOgv51L4Ux8MPjY
Dollar/yen around 6 was suspicious, I wrote yesterday.
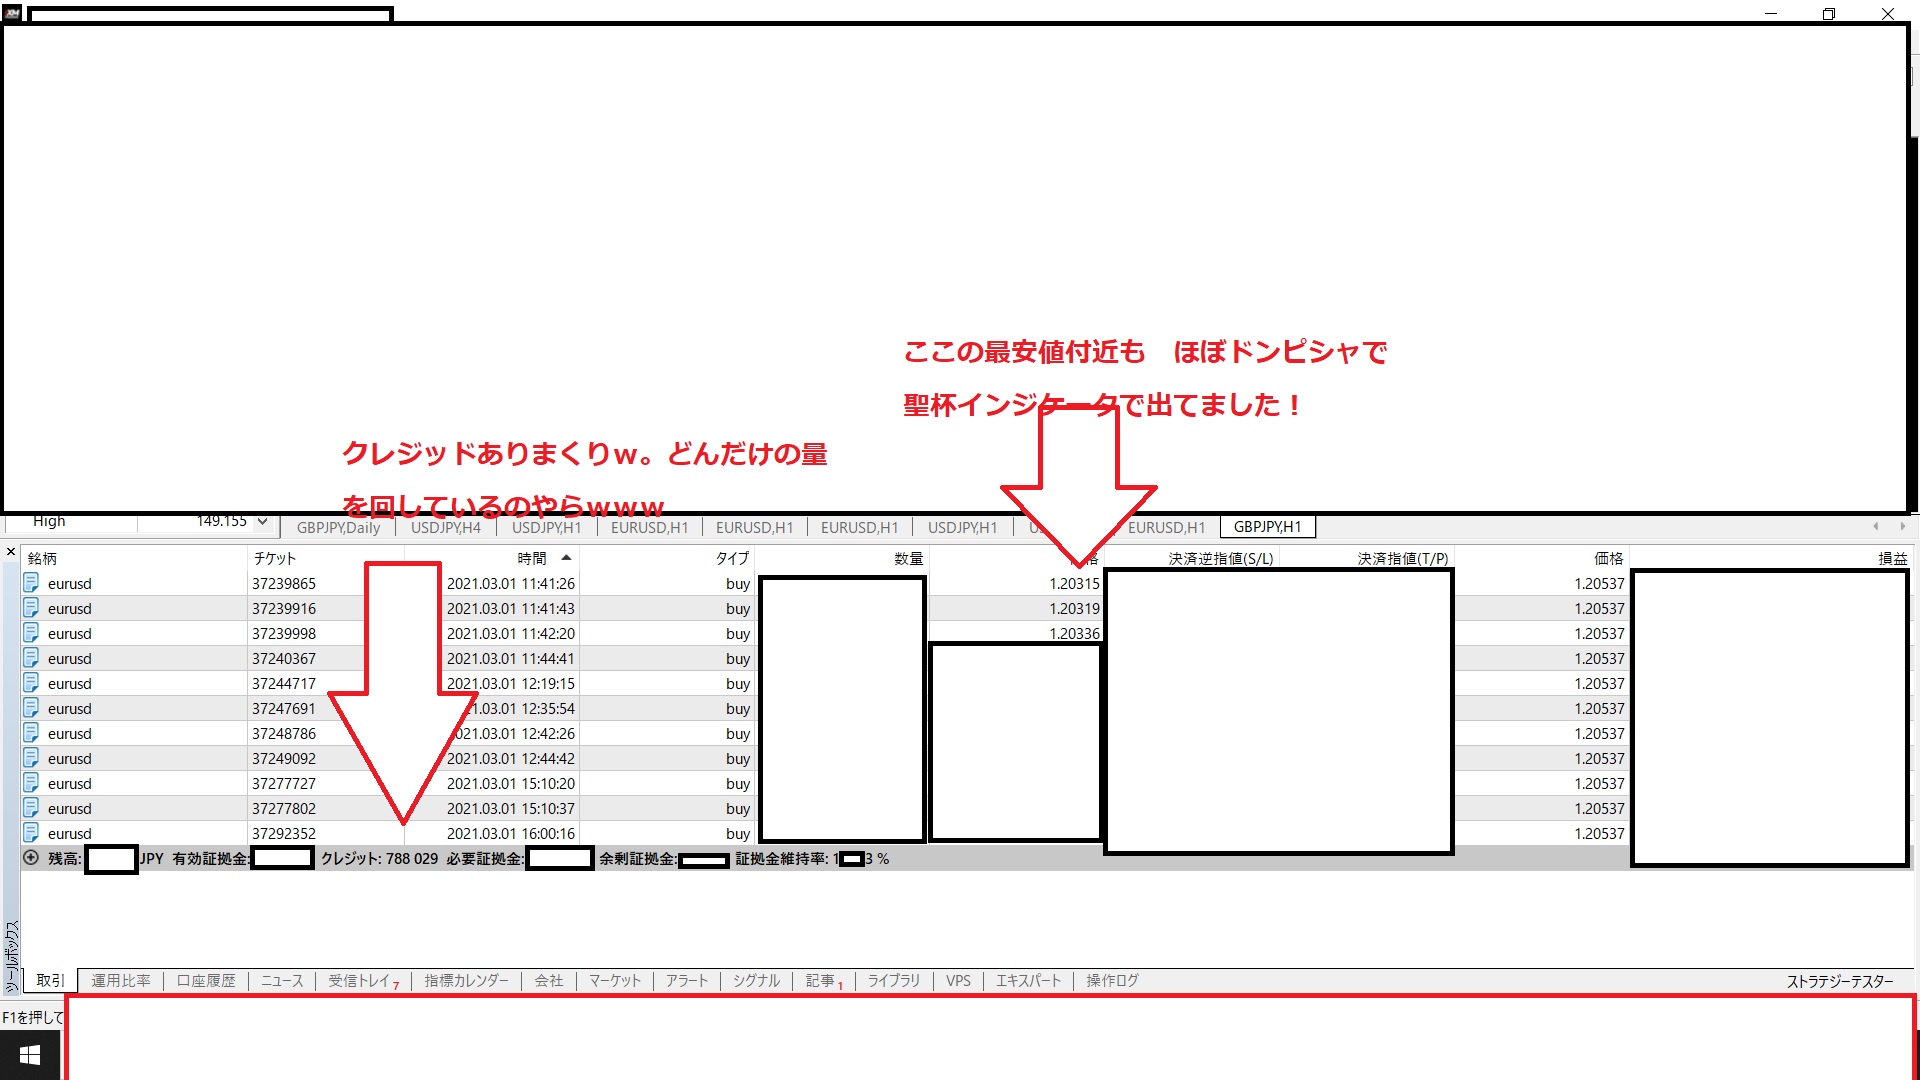
As for the pound/yen, it was sudden, so I took a margin call, but since then I’ve earned profits far exceeding the margin call
Now, to the main topic
① Future prediction method using the line method
・Draw effective lines
・Create a range
・Establish guidelines
・Draw a boundary line separating L and S
That’s all
② Scenario method
There are two kinds of this
Price movement has a time to decide the outcome
At that time
Whether to choose path A, a paved road
Or path B, a beaten path
Just confirm that
Usually, people choose A
Then it’s easy from there.
※As of the time I’m writing this article, if you confirm you chose A
Of course, you’ll be right.
There are also ways to draw lines for the quality of paved roads
When people hear “line method,” some only see the rebound point
but
Everything depends on how you use it
I’ll write again, but
Simply, analysis with drawn lines
Line analysis using insights from flashes or knowledge gained in seminars and good teachers
The above creates big differences in the future
Because it’s simple, it’s deep
I’ll write again, but
kei-kan-a Line differs from conventional candlestick analysis
For example
How to draw
・In core technicals
① Structural movement... methods to know things such as pullbacks, lifespan of trends, likelihood of new highs before updating highs or lows, etc.
② Setups... must rise or must fall; the boundary between L and S is clear, a technique
③ Semi-permanent trend line... you don’t need to draw lines. A simplified version of Ichimoku; above this line is L, below is S, a technique
④ Super entry wiggle line... a method showing the range when consolidating breaks, with entry and take-profit points
⑤ Absolute upper and lower lines... today, this week, this month, highs won’t go beyond here; similarly for lows; a way to know if it must rise, must fall, or a trend reversal
※ I expected a rebound by looking at item ⑤
and so on
Sometimes there are technical signs of declines or rises
⑥ The Big River Drop technique
⑦ Galaxy... a method to draw ranges based on star alignments; currently I am forecasting with the Galaxy since 2002
etc.
Even just the line method has this many possibilities
First, look at the chart and try various things!
※Above is taught in one-on-one lessons